#DistributedTracing
Explore tagged Tumblr posts
Visit Tumblr Blog
Explore Tumblr blogs with no restrictions, modern design and the best experience.
Last Seen Tumblr Blogs


Fun Fact
Tumblr has a 66 index score for customer satisfaction in the US.
Text
Explore the intricacies of distributed request tracing with this comprehensive guide. Compare OpenMetrics and OpenTelemetry, and understand the role of encapsulation in tracing, monitoring, and optimizing complex microservices environments. Download full pdf-https://jmp.sh/l1qQCnzq
0 notes
Text
Jaeger Integration with Spring Cloud

In today’s complex landscape of highly distributed microservices, monitoring, and tracing are essential tools for understanding application performance and effectively diagnosing issues. Distributed tracing allows us to track requests as they traverse multiple services, providing valuable insights into potential bottlenecks and latency problems. In this blog post, we will explore the process of setting up distributed tracing in a Spring Boot application, utilizing OpenTelemetry and Jaeger.
Understanding Distributed Tracing
Distributed tracing is a technique that helps developers and operators track requests as they move across various microservices or components of an application. It provides end-to-end visibility into the path a request takes and the time it spends in each service. With this information, you can:
Identify bottlenecks: Find out which parts of your application are causing delays or performance issues.
Optimize performance: Analyze the trace data to identify opportunities for optimizing the performance of your application.
Troubleshoot errors: Quickly pinpoint the source of errors or exceptions in your system, making debugging much easier.
Introducing OpenTelemetry and Jaeger
OpenTelemetry (OTel) is indeed an open-source project that offers a set of APIs, libraries, agents, and instrumentation to help you gain observability into your applications by collecting distributed traces, metrics, and logs. OpenTelemetry is designed to be vendor-neutral and can integrate with a range of tracing systems.
Jaeger is a popular open-source distributed tracing system that can act as a backend for collecting, storing, and visualizing trace data generated by applications instrumented with OpenTelemetry.
Together, OpenTelemetry and Jaeger can be used to collect, analyze, and visualize observability data from distributed systems, providing insights into system performance and helping to troubleshoot issues.
Setting Up OpenTelemetry and Jaeger in Spring Boot
Creating an application
Let’s go to https://start.spring.io and create an application with the following dependencies.
Spring Web (required to create REST endpoints)
Spring Boot Actuator
The traces will be collected using the micrometer collector in the actuator dependence and exported using the OpenTelemetry requirement.
This would necessitate the addition of the following dependencies.
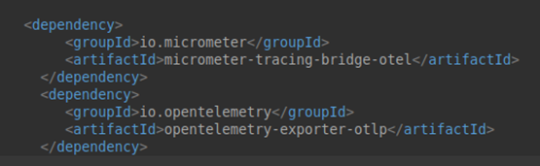
The Spring Boot parent will handle the dependency versions.
Following that, we will develop two applications.
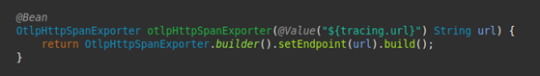
To export the spans to Jaeger, we must first develop a span exporter bean, as seen below.
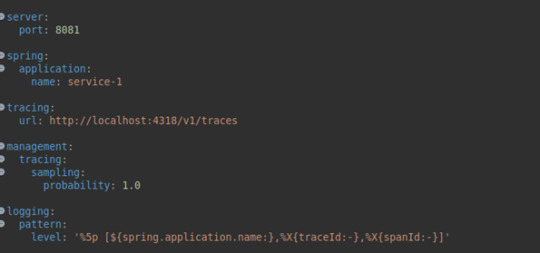
In addition, we will define the Jaeger URL where trace data will be recorded in the properties file.
Service1
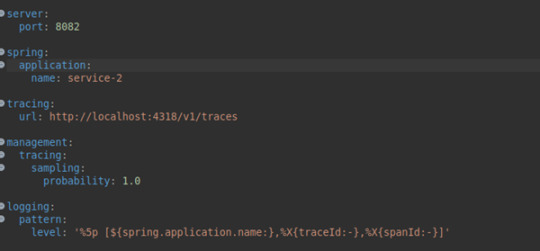
Service 2
Here, we set the probability of selecting the tracing to 1, which means that every trace and span is reported to Jaeger.
We will also provide a special logging format so that the spans and traces may be seen in the application logs.

Will also configure bean for RestTemplate
Service-2
in the Controller class
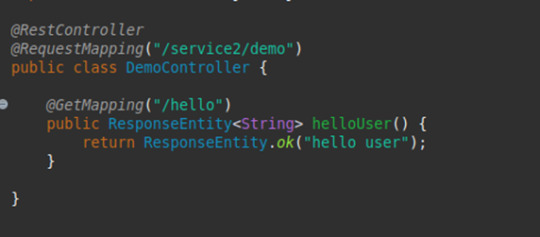
The idea is to call service2 /hello api from service1 /hello api by using RestTemplate.
Starting Jaeger with Docker
To start Jaeger, we have the following docker cmd.
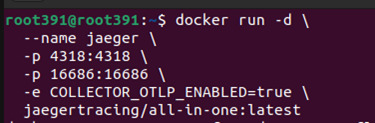
For Jaeger to support the OpenTelemetry input format, we need to set the COLLECTOR_OTLP_ENABLED to true
With this, will start the applications.
Now, let’s visualize the traces in Jaeger UI.
To access the Jaeger UI, open the following URL.
Originally published by: Jaeger Integration with Spring Cloud
#JaegerIntegration#SpringCloud#DistributedTracing#MicroservicesMonitoring#OpenTracing#ApplicationPerformance#TracingSolutions#DistributedSystems#ApplicationManagement
0 notes
Video
youtube
Distributed Tracing Microservice Design Pattern Tutorial with Examples f...
Full Video Link https://youtu.be/T6N5fcZydO4
Hello friends, new #video on #distributedtracing #designpattern for #microservices #tutorial for #programmers with #examples is published on #codeonedigest #youtube channel. Learn #distributed #tracing #pattern #observability #programming #coding with codeonedigest.
@java #java #aws #awscloud @awscloud @AWSCloudIndia #salesforce #Cloud #CloudComputing @YouTube #youtube #azure #msazure #distributedtracing #distributedtracinginmicroservices #distributedtracinginmicroservicesspringboot #distributedtracingspringboot #distributedtracingnewrelic #distributedtracingjaeger #distributedtracingzipkin #distributedtracingsystem #distributedtracingopentelemetry #distributedtracingexplained #distributedtracingtutorial #distributedtracingapplicationinsights #distributedtracingforkafka #distributedtracing #distributedtracingdesignpattern #distributedtracingdesignpatterninmicroservices #distributedtracingdesignpatterninmicroservicesspringboot #distributedtracingdesignpatternspringboot #distributedtracingdesignpatternexample #distributedtracingdesignpatternmicroservicesexample #distributedtracingdesignpatterninmicroservicesjava #distributedtracingdesignpatternmicroservice #distributedtracingdesignpatterninterviewquestion #distributedtracingdesignpatternspringboot #distributedtracingpattern #distributedtracingpatternmicroservices #distributedtracingpatternmicroservicespringbootexample #distributedtracingpatternmicroservice #distributedtracingpatternmicroservicesimplementationexample #distributedtracingpatternmicroservicejava #distributedtracingpatternmicroservice #distributedtracingpatternexample #distributedtracingpatternmicroservicesexample #distributedtracingpatternmicroservices #distributedtracingpatternmicroservices #distributedtracingpatternjava #distributedtracingpattern #distributedtracingpattern
#youtube#distributed tracing#design patterns#distributed tracing design patterns#software design patterns#java design patterns#microservice#microservice design patterns
1 note
·
View note
Link
New Relic Adds Support for W3C Trace Context Spec @mvizard https://t.co/8dhVVX5sUk #applicationdeployment #applicationperformancemanagement #distributedtracing #microservices #w3c pic.twitter.com/33dfyQP3v3
— DevOps.com (@devopsdotcom) February 7, 2020
via: https://ift.tt/1GAs5mb
0 notes
Text
Understand the power of distributed tracing, observability, and OpenTelemetry logging to enhance your application's performance and reliability. This article explores key concepts, use cases, and implementation strategies for comprehensive monitoring and debugging in modern, distributed systems. Read now-https://www.appclonescript.com/distributed-tracing-observability-open-telemetry-logging/
0 notes
Text
Discover the 10 best Real User Monitoring (RUM) tools to improve your user experience. Learn how these tools can help you monitor real user interactions, optimize performance, and boost satisfaction. Visit now to know more-https://stackify.com/10-best-rum-tools-for-improving-your-user-experience/
0 notes
Text
Explore the differences between APM and tracing, and discover the importance of distributed tracing in Ruby applications. Learn how to enhance performance monitoring and issue resolution in modern software architectures. Visit now-
https://www.sharepresentation.com/stackify1100/understanding-apm-tracing-role-distributed-ruby
0 notes
Text
Discover the transformative impact of observability through structured logging in Java. Learn how to enhance system performance, streamline debugging, and gain deeper insights into your applications with this comprehensive guide. Visit now
0 notes
Text
Gain a clear understanding of observability concepts with this comprehensive guide. Learn about telemetry, logs, distributed tracing, and the differences between monitoring and logging to enhance your application performance and reliability. Read now-https://medium.com/@stackify1/demystifying-observability-telemetry-logs-distributed-tracing-and-monitoring-vs-logging-8f0b972259f7
0 notes
Text
Explore the inner workings of OpenTelemetry in .NET with this comprehensive guide. Learn how distributed request tracing and OpenTelemetry logging can enhance your application's observability, helping you monitor performance and diagnose issues more effectively. Read now-https://www.hashtap.com/p/o6Mr10Bd_yMe
0 notes
Text
Get a complete guide on the concept of decentralized tracing of requests the concept's importance and how it causes improved reliability and performance in distributed systems. Read full blog-https://theamberpost.com/post/the-ultimate-guide-to-distributed-request-tracing-improving-performance-and-debugging-in-distributed-systems
0 notes
Text
Application Performance Monitoring (APM) and Distributed Tracing are essential tools that offer distinct benefits. APM focuses on monitoring overall application performance by collecting data on response times, error rates and Distributed Tracing tracks requests through complex systems, providing detailed views, trace visualization etc.
0 notes
Text
Distributed Tracing Microservice Design Pattern Tutorial with Examples for Software Programmers
Full Video Link https://youtu.be/T6N5fcZydO4 Hello friends, new #video on #distributedtracing #designpattern for #microservices #tutorial for #programmers with #examples is published on #codeonedigest #youtube channel. Learn #distributed #trac
In this video we will learn about Distributed Tracing design pattern for microservices. This is the 3rd design principle in Observability design patterns category for microservices. In a Microservices architecture, a request can travel across multiple microservices to build the response and send it to the user. If something goes wrong in some microservice, it is extremely difficult to pinpoint…

View On WordPress
0 notes
Text
Unlocking the Benefits of Distributed Tracing
Explore the concept of what is distributed tracing and its profound impact on modern software development. Learn how distributed tracing enables comprehensive visibility into complex systems, allowing developers to trace the flow of requests across distributed architectures. Discover the benefits of adopting distributed tracing techniques, from improved troubleshooting to enhanced performance optimization. Read full blog-
https://stackify.com/benefits-of-localized-distributed-tracing/
0 notes