#How to render images with React JS using map or loop?
Explore tagged Tumblr posts
Visit Tumblr Blog
Explore Tumblr blogs with no restrictions, modern design and the best experience.
Last Seen Tumblr Blogs


Fun Fact
12.7% of mobile users access Tumblr.
Text
react resimleri map içerisinde dinamik olarak göstermek
<script> import tr from '../../assets/icons/languages/Turkey_flat.png'; import en from '../../assets/icons/languages/United-Kingdom_flat.png';
let supportedLanguages = [”tr”,”en”]
{ (supportedLanguages || []).map((element, index) => { console.log("element",element, "index",index) return(
<MenuItem value={element} key = { index }> <ListItemIcon> <img className={styles['language-select-flag']} src={element} /> <ListItemText>{element}</ListItemText> </ListItemIcon> </MenuItem> ) }) </script>
yukarıdaki gibi yaptıgınızda resimleri çekemediğinizi göreceksiniz. Çünkü supportedLanguages dizisinde değerler string gözüküyor. Bunları çevirmek gerekiyor. Benzer bir örnek ile çözümü
import React from "react";import "./styles.css";import tr from "./tr.png";import en from "./en.png"; let supportedLanguages = ["tr", "en"];let images={ "tr": tr, "en":en}export default function App() { return ( <div className="App"> {(supportedLanguages || []).map((element, index) => { console.log("element", element, "index", index); return <img key={index} src={images[element]} />; })} <h1>Hello CodeSandbox</h1> <h2>Start editing to see some magic happen!</h2> </div> );}
#react map src#react local resimlerin dinamik olarak gösterilmesi#How do I reference a local image in React?#How to render images with React JS using map or loop?
0 notes
Photo
How to create your own JSON parser
#467 — December 13, 2019
Read on the Web
JavaScript Weekly
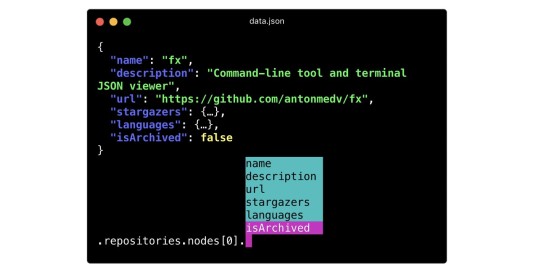
Fx 16.0: A Command-Line JSON Processing Tool — If you’ve got some files full of JSON that you want to process, Fx will slice and dice it however you want, including using JavaScript one-liners to add a bit of logic to the process.
Anton Medvedev
Preact 10.1: A Fast 3kB React Alternative with the Same API — Preact is an interesting project that often sees use in places where speed and size are of the absolute essence (Uber used it until they built their own in-house framework). New in 10.1 is support for a devtools extension and a SuspenseList component. GitHub repo.
Preact
CircleCI Config Teardown: How We Write Our Config at CircleCI — Find out how we use YAML configuration to power CircleCI - and which open source orbs (shareable packages of config) we use to speed up our pipeline.
CircleCI sponsor
20 Ways to Become a Better Node Developer in 2020 — We’re rapidly coming up on the end of the year (indeed, the next issue is our last this year) so is it time to think about New Year’s resolutions already?
Yoni Goldberg
Dr Axel's 'Deep JavaScript' Now Available — The latest book from JavaScript guru Dr. Axel (of Exploring ES6 fame) is now out. It costs money, but you can read a whole 50% of it online (or grab a PDF direct).
Dr. Axel Rauschmayer
Creating a JSON Parser with JavaScript — Sure, you could just use JSON.parse but where’s the challenge in that? This is a neat step-by-step guide on implementing a JSON parser of your own.
Tan Li Hau
Quick bytes:
Love SICP? A JavaScript adaption has been released.
Electron, the hugely popular GitHub-founded toolkit for building desktop apps on Web technologies, has joined the OpenJS Foundation.
Ember user? They're doing a 31 days of Ember addons series on their official blog.
💻 Jobs
Software Engineers, Frontend at Fictiv (San Francisco) — We bring a user friendly experience to manufacturing, making it easy to turn designs into real products. Use the latest tech and JS to iterate quickly, ensuring a rapid feedback loop between us and our customers.
Fictiv
Senior Front-End Software Engineer (Vue, Nuxt, Apollo) — Join our distributed Front-End functional team in our quest to make doctors more effective using Vue, Nuxt, Apollo and Rails.
Doximity
Find a Job Through Vettery — Make a profile, name your salary, and connect with hiring managers from top employers. Vettery is completely free for job seekers.
Vettery
📘 Articles & Tutorials

Raw WebGL: An Illustrated Guide to Starting with WebGL — A well presented tutorial on getting started with WebGL, what key data structures you need, and what each of the main elements (of which there are quite a few when it comes to WebGL!) are and do.
Alain Galvan
Relatively Formatting Times with Intl.RelativeTimeFormat — For example: new Intl.RelativeTimeFormat('en').format(-1, 'day') returns the string "1 day ago". It’s going to be part of ES2020 but you can use it in Chrome and Firefox already.
Bram van Damme
Build a Customizable Angular Data Grid in Minutes — Create an Angular data grid in under 5 minutes. You'll also find resources for building in Vue, React, and plain JavaScript.
Wijmo by GrapeCity sponsor
JavaScript Component-Level CPU Costs — Did you know that in Chrome 78+ on Linux you can actually track how many CPU instructions are used in the rendering of your components? Interesting, though advanced, performance monitoring stuff here.
Stoyan Stefanov
▶ Angular Meetup Online: Two Angular Talks — Ryan Chenkie and Kara Erickson both gave twenty minute talks on the latest in the Angular world.
This Dot Media
How to Write Correctly Typed React Components with TypeScript — React and TypeScript make a powerful pair, but if you’re just starting out, you’ll need to understand how to write correctly typed components.
Piero Borrelli
Why Does JavaScript Have -0? — Yes, there’s -0 and normal 0. They’re equal but are different objects nonetheless.
Thomas Barrasso
Inversion of Control — A simple principle that can drastically improve your reusable code.
Kent C Dodds
Realtime ≠ Request-Response: So, Why’s Google Polling Like It’s the 90s?
Ably sponsor
Reasons To Use Aurelia in 2020 — Aurelia is an interesting framework that deserves a look in a sea of competing options.
Dwayne Charrington
The npm, Yarn and Bower Timeline — The npm vs yarn story is a good demonstration of ‘competing’ tools pushing the other along.
Charlie Midtlyng
How Optional Chaining Helps to Avoid "undefined is not a function" Exceptions
Stefan Judis
🔧 Code & Tools
OpenLayers: High Performance Frontend Mapping Library — A system for putting dynamic maps onto your pages that can render map tiles pulled from various sources, vector data layers, markers, etc. Supports both Canvas and WebGL as appropriate. Examples.
OpenLayers
Visual Studio Code November 2019 Released — VS Code is perhaps the most popular editor in the JavaScript world and this release has a lot going for it, not least a new experimental WebGL renderer you can use to make the integrated terminal a lot faster. Just to show no favoritism though, Vim 8.2 just came out too ;-)
Microsoft
New Time-Travel Debugger for JavaScript and TypeScript — Move forward and backwards through your code to understand the conditions that led to a specific bug, view runtime values, edit-and-continue, and more.
Wallaby.js sponsor
simpleParallax: A Simple Way to Create Parallax Effects — A straightforward library to add parallax-style animations to any image on your page. Not always a good idea UX-wise, but the examples and code samples here certainly sell it well.
Geoffrey Signorato
5 Cloud IDEs for JavaScript Developers — I’d add Repl.it, CodeSandbox, and Glitch to this list too.
Shaumik Daityari
npkill: Find and Remove Old or Large node_modules Folders
Estefanía García Gallardo and Juan Torres Gómez
react-tabs: An Accessible and Easy Tab Component for React
React Community
⚡️ Quick Releases
Highcharts 8.0 — The charting framework.
Geolib 3.2 — Geospatial functions library.
npm 6.13.4 — The popular package manager.
react-beautiful-dnd 12.2 — Powerful drag and drop for lists in React.
by via JavaScript Weekly https://ift.tt/38Cnl3t
0 notes
Text
Making a Chart? Try Using Mobx State Tree to Power the Data
Who loves charts? Everyone, right? There are lots of ways to create them, including a number of libraries. There’s D3.js, Chart.js, amCharts, Highcharts, and Chartist, to name only a few of many, many options.
But we don’t necessary need a chart library to create charts. Take Mobx-state-tree (MST), an intuitive alternative to Redux for managing state in React. We can build an interactive custom chart with simple SVG elements, using MST to manage and manipulate data for the chart. If you've attempted to build charts using something like D3.js in the past, I think you’ll find this approach more intuitive. Even if you're an experienced D3.js developer, I still think you'll be interested to see how powerful MST can be as a data architecture for visualizations.
Here’s an example of MST being used to power a chart:
This example uses D3's scale functions but the chart itself is rendered simply using SVG elements within JSX. I don’t know of any chart library that has an option for flashing hamster points so this is a great example of why it’s great to build your own charts — and it’s not as hard as you might think!
I’ve been building charts with D3 for over 10 years and, while I love how powerful it is, I’ve always found that my code can end up being unwieldy and hard to maintain, especially when working with complex visualizations. MST has changed all that completely by providing an elegant way to separate the data handling from the rendering. My hope for this article is that it will encourage you to give it a spin.
Getting familiar with MST model
First of all, let’s cover a quick overview of what a MST model looks like. This isn’t an in-depth tutorial on all things MST. I only want to show the basics because, really, that’s all you need about 90% of the time.
Below is a Sandbox with the code for a simple to-do list built in MST. Take a quick look and then I’ve explain what each section does.
First of all, the shape of the object is defined with typed definitions of the attribute of the model. In plain English, this means an instance of the to-do model must have a title, which must be a string and will default to having a “done” attribute of false.
.model("Todo", { title: types.string, done: false //this is equivalent to types.boolean that defaults to false })
Next, we have the view and action functions. View functions are ways to access calculated values based on data within the model without making any changes to the data held by the model. You can think of them as read-only functions.
.views(self => ({ outstandingTodoCount() { return self.todos.length - self.todos.filter(t => t.done).length; } }))
Action functions, on the other hand, allow us to safely update the data. This is always done in the background in a non-mutable way.
.actions(self => ({ addTodo(title) { self.todos.push({ id: Math.random(), title }); } }));
Finally, we create a new instance of the store:
const todoStore = TodoStore.create({ todos: [ { title: "foo", done: false } ] });
To show the store in action, I’ve added a couple of console logs to show the output of outStandingTodoCount() before and after triggering the toggle function of the first instance of a Todo.
console.log(todoStore.outstandingTodoCount()); // outputs: 1 todoStore.todos[0].toggle(); console.log(todoStore.outstandingTodoCount()); // outputs: 0
As you can see, MST gives us a data structure that allows us to easily access and manipulate data. More importantly, it’s structure is very intuitive and the code is easy to read at a glance — not a reducer in sight!
Let’s make a React chart component
OK, so now that we have a bit of background on what MST looks like, let’s use it to create a store that manages data for a chart. We’ll will start with the chart JSX, though, because it’s much easier to build the store once you know what data is needed.
Let’s look at the JSX which renders the chart.
The first thing to note is that we are using styled-components to organize our CSS. If that’s new to you, Cliff Hall has a great post that shows it in use with a React app.
First of all, we are rendering the dropdown that will change the chart axes. This is a fairly simple HTML dropdown wrapped in a styled component. The thing to note is that this is a controlled input, with the state set using the selectedAxes value from our model (we’ll look at this later).
<select onChange={e => model.setSelectedAxes(parseInt(e.target.value, 10)) } defaultValue={model.selectedAxes} >
Next, we have the chart itself. I’ve split up the axes and points in to their own components, which live in a separate file. This really helps keep the code maintainable by keeping each file nice and small. Additionally, it means we can reuse the axes if we want to, say, have a line chart instead of points. This really pays off when working on large projects with multiple types of chart. It also makes it easy to test the components in isolation, both programmatically and manually within a living style guide.
{model.ready ? ( <div> <Axes yTicks={model.getYAxis()} xTicks={model.getXAxis()} xLabel={xAxisLabels[model.selectedAxes]} yLabel={yAxisLabels[model.selectedAxes]} ></Axes> <Points points={model.getPoints()}></Points> </div> ) : ( <Loading></Loading> )}
Try commenting out the axes and points components in the Sandbox above to see how they work independently of each other.
Lastly, we’ll wrap the component with an observer function. This means that any changes in the model will trigger a re-render.
export default observer(HeartrateChart);
Let’s take a look at the Axes component:
As you can see, we have an XAxis and a YAxis. Each has a label and a set of tick marks. We go into how the marks are created later, but here you should note that each axis is made up of a set of ticks, generated by mapping over an array of objects with a label and either an x or y value, depending on which axis we are rendering.
Try changing some of the attribute values for the elements and see what happens… or breaks! For example, change the line element in the YAxis to the following:
<line x1={30} x2="95%" y1={0} y2={y} />
The best way to learn how to build visuals with SVG is simply to experiment and break things. 🙂
OK, that’s half of the chart. Now we’ll look at the Points component.
Each point on the chart is composed of two things: an SVG image and a circle element. The image is the animal icon and the circle provides the pulse animation that is visible when mousing over the icon.
Try commenting out the image element and then the circle element to see what happens.
This time the model has to provide an array of point objects which gives us four properties: x and y values used to position the point on the graph, a label for the point (the name of the animal) and pulse, which is the duration of the pulse animation for each animal icon. Hopefully this all seems intuitive and logical.
Again, try fiddling with attribute values to see what changes and breaks. You can try setting the y attribute of the image to 0. Trust me, this is a much less intimidating way to learn than reading the W3C specification for an SVG image element!
Hopefully this gives you an understanding and feel for how we are rendering the chart in React. Now, it’s just a case of creating a model with the appropriate actions to generate the points and ticks data we need to loop over in JSX.
Creating our store
Here is the complete code for the store:
I’ll break down the code into the three parts mentioned earlier:
Defining the attributes of the model
Defining the actions
Defining the views
Defining the attributes of the model
Everything we define here is accessible externally as a property of the instance of the model and — if using an observable wrapped component — any changes to these properties will trigger a re-render.
.model('ChartModel', { animals: types.array(AnimalModel), paddingAndMargins: types.frozen({ paddingX: 30, paddingRight: 0, marginX: 30, marginY: 30, marginTop: 30, chartHeight: 500 }), ready: false, // means a types.boolean that defaults to false selectedAxes: 0 // means a types.number that defaults to 0 })
Each animal has four data points: name (Creature), longevity (Longevity__Years_), weight (Mass__grams_), and resting heart rate (Resting_Heart_Rate__BPM_).
const AnimalModel = types.model('AnimalModel', { Creature: types.string, Longevity__Years_: types.number, Mass__grams_: types.number, Resting_Heart_Rate__BPM_: types.number });
Defining the actions
We only have two actions. The first (setSelectedAxes ) is called when changing the dropdown menu, which updates the selectedAxes attribute which, in turn, dictates what data gets used to render the axes.
setSelectedAxes(val) { self.selectedAxes = val; },
The setUpScales action requires a bit more explanation. This function is called just after the chart component mounts, within a useEffect hook function, or after the window is resized. It accepts an object with the width of the DOM that contains the element. This allows us to set up the scale functions for each axis to fill the full available width. I will explain the scale functions shortly.
In order to set up scale functions, we need to calculate the maximum value for each data type, so the first thing we do is loop over the animals to calculate these maximum and minimum values. We can use zero as the minimum value for any scale we want to start at zero.
// ... self.animals.forEach( ({ Creature, Longevity__Years_, Mass__grams_, Resting_Heart_Rate__BPM_, ...rest }) => { maxHeartrate = Math.max( maxHeartrate, parseInt(Resting_Heart_Rate__BPM_, 10) ); maxLongevity = Math.max( maxLongevity, parseInt(Longevity__Years_, 10) ); maxWeight = Math.max(maxWeight, parseInt(Mass__grams_, 10)); minWeight = minWeight === 0 ? parseInt(Mass__grams_, 10) : Math.min(minWeight, parseInt(Mass__grams_, 10)); } ); // ...
Now to set up the scale functions! Here, we’ll be using the scaleLinear and scaleLog functions from D3.js. When setting these up, we specify the domain, which is the minimum and maximum input the functions can expect, and the range, which is the maximum and minimum output.
For example, when I call self.heartScaleY with the maxHeartrate value, the output will be equal to marginTop. That makes sense because this will be at the very top of the chart. For the longevity attribute, we need to have two scale functions since this data will appear on either the x- or the y-axis, depending on which dropdown option is chosen.
self.heartScaleY = scaleLinear() .domain([maxHeartrate, minHeartrate]) .range([marginTop, chartHeight - marginY - marginTop]); self.longevityScaleX = scaleLinear() .domain([minLongevity, maxLongevity]) .range([paddingX + marginY, width - marginX - paddingX - paddingRight]); self.longevityScaleY = scaleLinear() .domain([maxLongevity, minLongevity]) .range([marginTop, chartHeight - marginY - marginTop]); self.weightScaleX = scaleLog() .base(2) .domain([minWeight, maxWeight]) .range([paddingX + marginY, width - marginX - paddingX - paddingRight]);
Finally, we set self.ready to be true since the chart is ready to render.
Defining the views
We have two sets of functions for the views. The first set outputs the data needed to render the axis ticks (I said we’d get there!) and the second set outputs the data needed to render the points. We’ll take a look at the tick functions first.
There are only two tick functions that are called from the React app: getXAxis and getYAxis. These simply return the output of other view functions depending on the value of self.selectedAxes.
getXAxis() { switch (self.selectedAxes) { case 0: return self.longevityXAxis; break; case 1: case 2: return self.weightXAxis; break; } }, getYAxis() { switch (self.selectedAxes) { case 0: case 1: return self.heartYAxis; break; case 2: return self.longevityYAxis; break; } },
If we take a look at the Axis functions themselves we can see they use a ticks method of the scale function. This returns an array of numbers suitable for an axis. We then map over the values to return the data we need for our axis component.
heartYAxis() { return self.heartScaleY.ticks(10).map(val => ({ label: val, y: self.heartScaleY(val) })); } // ...
Try changing the value of the parameter for the ticks function to 5 and see how it affects the chart: self.heartScaleY.ticks(5).
Now we have the view functions to return the data needed for the Points component.
If we take a look at longevityHeartratePoints (which returns the point data for the “Longevity vs. Heart” rate chart), we can see that we are looping over the array of animals and using the appropriate scale functions to get the x and y positions for the point. For the pulse attribute, we use some maths to convert the beats per minute value of the heart rate into a value representing the duration of a single heartbeat in milliseconds.
longevityHeartratePoints() { return self.animals.map( ({ Creature, Longevity__Years_, Resting_Heart_Rate__BPM_ }) => ({ y: self.heartScaleY(Resting_Heart_Rate__BPM_), x: self.longevityScaleX(Longevity__Years_), pulse: Math.round(1000 / (Resting_Heart_Rate__BPM_ / 60)), label: Creature }) ); },
At the end of the store.js file, we need to create a Store model and then instantiate it with the raw data for the animal objects. It is a common pattern to attach all models to a parent Store model which can then be accessed through a provider at top level if needed.
const Store = types.model('Store', { chartModel: ChartModel }); const store = Store.create({ chartModel: { animals: data } }); export default store;
And that is it! Here’s our demo once again:
This is by no means the only way to organize data to build charts in JSX, but I have found it to be incredibly effective. I’ve have used this structure and stack in the wild to build a library of custom charts for a big corporate client and was blown away with how nicely MST worked for this purpose. I hope you have the same experience!
The post Making a Chart? Try Using Mobx State Tree to Power the Data appeared first on CSS-Tricks.
Making a Chart? Try Using Mobx State Tree to Power the Data published first on https://deskbysnafu.tumblr.com/
0 notes
Text
CSS Text Effects: 116 Cool Examples That You Can Download
You came here for some really cool CSS text effects that will help you make amazing web typography for your websites.
In order to successfully give a website a look that is more visually impressive, designers always concentrate on placing more emphasis upon typography that is both stylish and neat in nature.
These same designers used to depend upon programs such as Photoshop to accomplish this; however, since CSS3 was implemented and supported by most browsers, things changed a lot.
You should already be seeing advanced CSS font effects on various modern websites.
These kinds of effects are becoming very popular very quickly in terms of becoming a great trend in web design.
These can also be achieved with pure CSS, which is perhaps the greatest thing about these kinds of web typography effects.
CSS3 is considered to be a true revolution when it comes to web development. The new properties contained in CSS3 allow developers to visually enhance their designs in such a way that is not only impressive in a visual sense, but is also quick and easy.
Web typography is one major thing that has dramatically changed with CSS3. You can make your design look attractive with typography and make everything visually appealing.
When it comes to web design, CSS will help you to obtain many different font effects, including using such effects as animation and clipping to spice things up a bit.
To help further illustrate this, we’ve put together a list of effects that are visually stunning and beautiful, all of which are made possible through CSS, and some of them with a little bit of Javascript as well.
Table of contents
Animated CSS text effects
CSS Shadow text effects
3D CSS text effects
CSS text background
CSS hover text effects
CSS glitch text effects
Cool CSS text effects
CSS animated text effects
Text animation
The second one of these CSS text effects is from Yoann Helin. He created in CSS this effect that you may have seen on a lot of portfolio and presentation websites.
Line text.
Animated text with HTML, CSS and JavaScript.
COSMOS
While this CSS text effect isn’t the most useful one, it still is impressive.
Here’s what the author used:
vw, vh, vmin units for responsiveness
flexbox to center everything
multiple box-shadows for the stars
keyframes animation for the planets
transform to rotate the planets
[webkit] Animated “text-shadow” pattern
Uses -webkit-background-clip: text & linear-gradient to simulate striped text shadow.
Animated signing of signature (SVG paths)
Use this pen to animate writing a signature with SVG stroke-dashoffset/stroke-dasharray and CSS transitions.
SVG Path animated Text
Animated the text “Design” based on one SVG path. Click to toggle animation.
Animated text fill with svg text practice
Animated text fill with HTML(Pug), CSS(SCSS) and SVG.
Animated text with Snapsvg
Work with this feels like an old good Flash :)
Vertically rotating text css [FORK] w/ browser prefixes
Vertically rotating text with HTML and CSS.
Rotating text
HTML, CSS and JavaScript rotating text.
#Codevember 3D Quote Rotator
Using GreenSock and the SplitText plugin to create a 3D text effect.
Impossibly Tipsy
Interesting effect for text.
Foggy text effect
Cinematic intro text effect (Webkit only – text mask). This is experimental, but still had to include it among these CSS effects.
webdev series – Colorful text animation #updated
Fluid and configurable colorful text animation module made with SCSS.
CSS Text filling with water
The next one of these CSS text effects is a text filling with water animation, for preloaders and such.
GSAP Text Animation
Text effect using Greensock.
Wave text effect (with SVG/blend mode)
Wave text effect with HTML and CSS.
Shattering Text Animation
GSAP text animation. SVG path shattering. Slow motion on hover.
Squiggly Text
Squiggly text experiment with SVG filters.
Animated Headlines
A collection of animated headlines, with interchangeable words that replace one another through CSS transitions.
Text Animation: Montserrat
HTML and CSS text animation.
Shaded Text
Shaded text, a SVG + CSS3 experiment about animated shadows. It isn’t optimized for mobile devices… yet.
Animating SVG text
HTML, CSS and SVG animating text.
text color draw
Path drawing of text using greensock’s drawSVG plugin.
Pure CSS Text Animation
HTML and CSS text animation.
Animated text fill
Fill your text with animated background images – no JavaScript required.
Bubbling Text Effect
A jQuery powered example of how you can create a bubbling effect on a HTML heading. The bubbles appear as though they’re coming from behind the text, and then fade out and are removed.
Smoky Text
Combining text-shadow and CSS transforms (especially skew) for a smoky (or smokey?) effect.
jquery break/animate warping text paragraph example
HTML, CSS and JavaScript break/animate warping text paragraph example.
Animated wave clipped by text
Animated wave inside text with svg. Image in the background and gradient filling the wave.
(cool) text effect
Animated text with GIF image.
Untitled
Animated text with HTML, CSS and JS.
Splitted text reveal
HTML, CSS and JavaScript splitted text reveal.
Onion Skinning Text Morphing
Onion skinning text morphing in HTML/CSS/JS.
Text-Shadow Animate
Text-Shadow animate with HTML and CSS.
SVG video mask on text
SVG video mask on text.
GSAP text reveal animation
GSAP text reveal animation.
SVG text animation
Nice SVG text animation.
CSS Only Random Text Transform (Animated)
Generate random text transformation using CSS only.
Silent Movie Text Effect
Movie text effect with canvas.
CSS TEXT REVEALING ANIMATION
Pure CSS text revealing animation.
Letter Animation
Animating letters with CSS.
Text Line Animation
Nice text line animation with TweenMax.js.
Helo!
Click to re-draw! Mapping sprites to text is always fun.
CSS only Frozen text
CSS only frozen text effect with background-clip, blend modes and gradient text.
letters effect
Letters effect on scroll.
Masking Path Animation
Sometimes simple is just as effective as complex.
Handwriting Animation (SVG + CSS)
SVG and CSS handwriting animation. In order to optimize the SVG for animation, the graphic was chopped up into smaller pieces. This was done primarily to prevent path elements from overlapping with unrelated clipPath elements, but also allowed finer control over the animation. All of the animated path elements were exported from Adobe Illustrator and fine-tuned with code.
Animated Text Gradient
Nice animated text with gradient.
CSS Shadow text effects
CSS Dashed Shadow
Pure css hipster-ish typographic dashed shadow.
Hit The Floor Text Effect
CSS3 text-shadow effects
HTML and CSS3 text-shadow effects.
Long Shadow Gradient Mixin
A Sass (Scss) Mixin to quickly generate long shadow gradients. Suitable for both ‘text-shadow’ and ‘box-shadow’.
CSS Text Shadow
Taking a stab at a Lynda.com tutorial. CSS: Advanced Typographic Techniques using lettering.js
Text-Shadow
HTML and CSS text-shadow.
Awesome Text-Shadow
Awesome text-shadow with CSS3.
Shadow Parallax • Reactjs
Move your Mouse and Play words. Written by React, ES6, Babel transpiler.
Neon text-shadow effect
9 neon CSStext-shadow effects.
Styling Text with SVG (Second Shadow)
Styling text with SVG.
Pretty shadow
Pretty shadow with HTML and CSS.
Text-shadow
Pure CSS text shadow.
Fancy text shadow
Fancy text shadow.
Groovy CSS Effect
1960’s font effect using CSS text-shadow property along with SASS function and mixins to keep code DRY.
3D CSS text effects
3d Text effect – mousemove
Nice 3D Text effect with jQuery mousemove.
3D extrude text effect- CSS only
HTML and CSS 3D extrude text effect.
CSS Text Stroke | CSS Text Border – Infinite effect only with #CSS #html5
Change the text to see the animation again.
3D CSS Typography
Single element, multi coloured 3d text effect
Single element with multi coloured text and 3D text shadow effects. Just playing around with different CSS properties to create fun text effects.
Only SS: Text Wave
Only CSS text wave.
Skewed and Rotated Text
Text with CSS skew() and rotate().
3d text marquee effects
3D text marquee effects.
CSS text background
-webkit-background-clip:text CSS effect
Use -webkit-background-clip: text and -webkit-fill-text-color : transparent to apply a background to a text on webkit browser.
Set a color fallback for other browser.
Background clipping
Text background clipping.
SVG Knockout Text with Video Background
This demo explores creating knockout text/paths in SVG and looping a YouTube video as the fill.
SVG text mask
Gooey text background with SVG filters
Example of using a gooey SVG filter to create smooth edges around inline text with a background.
Moving Cloud Text | HTML + CSS
Moving cloud text with HTML and CSS.
CSS Attempts at text with inline skewed background
Using skew is only rendered if the item is display: block or inline-block. Some of these look the same on a wide viewport but fail differently as the viewport width is decreased.
CSS hover text effects
Opening type
Efek Typography Text Neon part 1
Text design (typography) with neon effect.
Text-mask background moving on MouseMove – v2
Trying the new feature “background-clip: text”, with background moving.
Peeled Text Transforms
This pen shows text that looks like it is peeled of the page. It has a smooth animation when hovered.
Happy Text
HTML and CSS happy text effect.
Animated highlighted text
The idea is simple, it make used of linear gradient and transition.
3d hover text effect
HTML, CSS and JavaScript 3d hover text effect.
CSS Perspective Text Hover
An experiment using webfonts in combination with CSS 3D transform tools.
Focus Text Hover Effect | HTML+ CSS + jQuery
Hover CSS effect for text.
Animated underlines
Demo of an animated underline effect. Pure CSS animation.
How do I get a custom colored underline that will span multiple lines?
Pretty underline hover effect.
Simple CSS Hover Effect using Sass Loops
Simple little hover animation. Sass loops make staggering animation delays really easy to do…you can get a lot of mileage out of them.
Spring Text Hover Effect
Just playing around with effects for buttons and thought this was pretty cool.
Blended text layers
Content generated with JS.
CSS glitch text
Colorful Glitchy 404
CSS glitched text by skew
HTML and CSS glitched text by skew.
CSS-Only Glitch Effect
Glitch sort of effect with CSS animation.
Glitch
Glitch text with HTML and CSS.
Glitchy Text
Glitchy text with HTML and CSS(SCSS).
Glitch Text
HTML(Pug) and CSS(SCSS) glitch text.
Glitched Text (study of The Verge)
HTML, CSS and JavaScript glitched text.
SVG Glitch
VHS text
VHS text with HTML, CSS and JavaScript.
Psycho Glitch (CSS variables & @keyframes)
The “glitch” effect, recreated with animated CSS custom properties. Pure CSS.
Simple text glitch
Pure CSS simple text glitch.
Cool CSS text effects
Slashed CSS Effect
Elastic stroke CSS + SVG
The first one of these cool CSS text effects comes from Yoksel. She chose an amazing color scheme for this beautiful CSS text animation.
SVG Text: Animated Typing
HTML, CSS and SVG animated typing.
Text typing thingamy
HTML, CSS and JavaScript text typing thingamy.
Futuristic Resolving/Typing Text Effect feat. GLaDOS
Futuristic resolving/typing text effect usually found in game or movie cut scenes to reveal text on screen.
Transmission: Glowing Text Animation
A little glowing text animation. First, some JS to wrap each letter in a span. Then a keyframe animation, with animation-delay mixin, lights up each letter in succession.
Text Scramble Effect
A little text decoding/scramble effect.
Kinetic Type with Greensock
Kinetic Type with HTML, CSS and JavaScript (Greensock).
LOVE Text Effect
Scrambled text effect inspired by the award winning Science Fiction film “LOVE”.
Auto Typing Text (function)
Auto typing text with HTML, CSS and JavaScript.
Typing Text
HTML, CSS and JavaScript typed text.
Typing Effect
Typing effect for text made with a simple JQuery function. Simply call the function with the element you wish to animate as the first argument and the animation speed as the second argument.
If you liked this article with CSS text effects, you should also check out these articles:
CSS And Javascript Animation Libraries To Create Awesome Effects
CSS Animation Examples That You Will Like
23 Of The Best CSS And HTML Frameworks Available To Download
The post CSS Text Effects: 116 Cool Examples That You Can Download appeared first on Design your way.
from Web Development & Designing https://www.designyourway.net/blog/web-and-mobile-design/yes-you-can-actually-make-these-text-effects-in-css/
0 notes
Link
via vallandingham.me
regl is a technology meant to simplify building awesome things with WebGL. Recently, Mikola Lysenko, one of the creators of regl, gave a great talk at OpenVis Conf that got me wanting to spend more time with WebGL and regl in particular - to see how it could be applied to my data visualization work.
With this tutorial, I hope to share my brief learnings on this wonderfully mystical technology and remove some of that magic. Specifically, how do we make the jump from the interesting but not so applicable intro triangle example:
To using regl for some sort of data visualization? At the end of this tutorial, hopefully you (and I) will find out!
We will start with the triangle. Try to understand WebGL and regl in the context of this example, then work to modify it to expand our understanding. We will cover some basics of WebGL and shaders, setting up your development environment to work with regl, and then explore a subset of regl’s functionality and capabilities.
The final result will be a data stream visualization:
This falls short of the amazing regl visualizations Peter Beshai has recently produced and discussed recently, but hopefully this tutorial can serve as a stepping stone towards this greatness.
And if you want to just skip to the results, I’ve made a bunch of blocks to illustrate the concepts covered:
Plain regl triangle
regl triangle in a loop
regl triangle moving
regl triangle using props
Displaying dots with regl
Data Stream with regl
What is WebGL?
First, it might be useful to step back a bit and talk at a high level about WebGL and regl and what they are good for. If you know all this, feel free to skip ahead.
As the wonderful Mozilla Developer Network so succinctly puts it, WebGL - or the Web Graphics Library - is a way to create interactive 2D and 3D visuals in a web browser with just Javascript. It is a low level API that utilizes the canvas tag, and can be used to make some pretty impressive stuff.
WebGL has a lot going for it. Its supported in many browsers, it can be crazy fast as the code is executed on the GPU, and there are lots of impressive examples to get you started.
But it is also a crazy confusing API for folks just getting started who are not familiar with these types of systems. WebGl is a graphics pipeline that includes a number of steps that are used to get an image rendered to the screen. The API is very low-level and it can take a lot of work just to get something on the screen.
What is regl?
The regl framework simplifies the task of developing WebGL code by providing a more functional interface. It takes cues from the React world, providing a consistent and familiar way to pass state and properties into the WebGL code.
So, you still have to write some WebGL, but the parts that you are responsible for writing are simpler, isolated, and have a defined signature.
Throwing Shade with Shaders
The WebGL code you still need to write are known as shaders. Shaders are functions written in a special C-like graphics language called GLSL or OpenGL Shading Language (OpenGL being the standard WebGL is based on).
There are different types of shaders, specifically two types:
Vertex shaders
Fragment shaders
Each type is responsible for configuring a different portion of the WebGL rendering pipeline. You need to implement both to make a complete
A Vertex shader is given each point (vertex) of the thing that is being rendered (triangle, sphere, rabbit, dataset) and its job is to determine the position of each of these vertices in WebGL space. If we ponder this idea from a data visualization / D3 perspective, this is kind of like implementing the most specific d3.scale ever. Each vertex is a data point, and the shader is a scale that maps each input point to a location in space and time for your specific visual.
A Fragment shader deals with the visual display of the things rendered in the WebGL pipeline to the screen. Specifically, they need to set the color for each pixel that is being displayed. (Why is it called a fragment shader and not a pixel shader? Good Question!).
As an aside, shaders are called shaders because fragment shaders are used to control lighting and other special effects when using GLSL in game development.
We won’t go into the details of GLSL in this tutorial, but hopefully the simple shaders we use aren’t too confusing. I’d suggest reading a bit of The Book of Shaders if you haven’t seen GLSL at all before - it provides a nice smooth introduction (though it focuses soley on fragment shaders).
As an aside, The Book of Shaders also has a great shader editor you should check out that includes all sorts of nice features. You can learn more about it here.
Here are some other resources that I shamelessly borrowed from, and might cover these concepts more elegantly than me:
WebGL Fundamentals
HTML5 Rocks Shader Intro
Setting up an Exploration Environment
Before we put our pedals to the metals in implementing these concepts in our very own regl program, let’s take a moment to setup an environment that helps facilitate an exploration of these new technologies in a way that doesn’t incite us to throw our computers into the ocean out of frustration.
My solution to reducing frustration with new technologies is typically to supplement existing tools I like with new features. To this end, I’m going to suggest some Atom plugins to use that could make working with GLSL code easier for you.
But there are many other approaches! Feel free to ignore these recommendations and skip ahead, if you have a different methodology for WebGL development.
Also, I’ve included Blocks for each of the steps in the tutorial - which work without any additional setup - so if you don’t want to setup your coding environment now, you could just start forking those!
Atom Packages for GLSL Fun
Here are the Atom packages I would recommend using as we get started. Each can be installed via Atom’s “Preferences” menu.
First, grab the language-glsl package for some nice syntax highlighting of our GLSL code. Initially our GLSL code will be written inline as strings, but eventually we will write this code in .glsl files, so this package will come in handy then.
Next, you might be interested in the autocomplete-glsl which gives you handy autocompleting of GLSL types and functions. It even provides links to the documentation for each function!
Finally, I never leave home without a linter - and linter-glsl provides nice inline warnings and errors in your code so you can catch them early and (hopefully) avoid hours of glaring angrily at your screen just because you forgot a ‘.’ somewhere (it might still happen though!).
To get the linter working, you need to install glslangValidator - which if you are on a Mac and use homebrew you can do easily:
brew install glslang
A Baseline for good regling
Ok, after far too much yawning, let’s get to some code. Here we will add the necessary JS packages to our development environment - so again skip ahead if you are just working with the Blocks for now. Most of this section is a rehash of the lovely from nothing to something in WebGL blog post by Ricky Reusser - so feel free to use the original source.
First, let’s create a new Javascript project using npm init:
mkdir regl-start cd regl-start npm init
You can just hit enter to select the defaults for the project if you like - or tweak them as necessary. This command adds a package.json file to our new regl-start directory. We will use this file to manage the npm packages we will use.
Some Nice-to-have Packages
We will install a few packages to get things up and running quickly. The commands to run inside your project are:
npm install --save regl npm install --save-dev browserify budo
...
0 notes
Photo

The state of JS package management, 1 million npm packages, and new JS features
#440 — June 7, 2019
Read on the Web
JavaScript Weekly
On the Economics of Package Management — An essay version of C J Silverio’s talk from JSConfEU ▶️ (watch it if you have 35 minutes to spare). She was ousted as CTO of npm, Inc. last year but is back with a history of the JavaScript package ecosystem, a discussion of who really ‘owns’ it, and a suggestion for a new way forward oriented around Entropic, a new, agnostic, federated package registry.
C J Silverio
Several New JS Features are Getting Closer with 'Optional Chaining' Now at Stage 2 — New JavaScript features go through various stages before they become official and this ?. operator to let you make chained property or function calls optional has taken another step forward. In related news, Array.isTemplateObject has also just gone to stage 2, top-level await to stage 3, and BigInt is now at stage 4.
Ecma TC39
⚛️ The NEW Complete Intro to React... Now, with Hooks — Much more than an intro, you’ll build a real-world app with the latest features in React including 🎣 hooks, effects, context, and portals.
Frontend Masters sponsor
Are Long JavaScript Tasks Delaying Your 'Time to Interactive'? — Chrome DevTools can now visualize ‘Long Tasks’ (code that causes the main thread to freeze, breaking the user experience) making it easier to debug and optimize away any problems.
Addy Osmani
Switch from Medium to Your Own Blog in a Few Minutes — Would’t it be great if more people we linked to were using their own blog instead of Medium? (Yes.) Here’s an example of the end result, but you can tweak it to your own tastes.
Mathieu Dutour
Just Write Code: Cloudflare Improves the Developer Experience of their Workers Serverless JavaScript Platform — Workers, Cloudflare’s globally distributed serverless platform, gets a CLI developer tool, the ability to run apps on workers.dev without using your own domain, new docs, and a free tier to make it easier to try it out.
Rita Kozlov (Cloudflare)
Quick bytes:
There are now 1 million npm packages.
GitHub has added support for using GitHub repos as 'repository templates'. Mark a repo as a template and then it can be used to quickly generate new repositories. Could be handy for boilerplate projects.
At this week's WWDC event, Apple unveiled the forthcoming new Mac Pro and it's a beast of a machine. You'll need incredibly deep pockets, however.
The npm Security Team foiled a plot to steal cryptocurrency via a malicious package.
💻 Jobs
JavaScript Developer at X-Team (Remote) — Join the most energizing community for developers. Work from anywhere with the world's leading brands.
X-Team
Front End Engineer (Manchester, UK) — Join our friendly team creating beautiful applications loved by customers around the world. Excellent work/life balance & benefits.
Capsule
Land a New Dev Job on Vettery — Vettery specializes in tech roles and is completely free for job seekers.
Vettery
📘 Tutorials, Opinions, and Videos
8 Useful JavaScript Tricks — You all seem to love a good list’o’tips article, and this one is not bad at all, particularly if you consider yourself at beginner to intermediate level.
Milos Protic
Unpacking Hoisting — “Hoisting is old and confused terminology,” said Allen Wirfs-Brock recently. Dr. Axel has some ideas on how to better think about declarations.
Dr. Axel Rauschmayer
Automate Your Code Reviews — Codacy flags errors in your code so you can fix them quickly, directly from your current workflow. Get started today.
Codacy sponsor
Best Practices for Building a Large Scale React App — A few concepts worth keeping in mind to make neater, larger scale apps over time.
Aman Khalid
How to Render a Dynamic Tree Diagram with SVG and Vue.js — What’s involved in creating a dynamic tree diagram using cubic bezier curve paths and Vue for data reactivity.
Krutie Patel
An introduction to the MediaRecorder API — The MediaRecorder API is a browser API that you can use to record audio and video in the browser. Here’s how.
Phil Nash (Twilio)
How To Use jQuery With Angular (When You Absolutely Have To) — For, like, when you really have to.. as “when it comes to integrating jQuery in Angular, things get a little weird.”
Aditya Modi
Angular 8: A Brief Summary of What's New
Alligator
Building Web Apps with MERN Stack and Google Cloud Platform
MongoDB sponsor
Enabling Modern JavaScript on npm — Modern JavaScript syntax lets you do more with less code, but how much of the JavaScript we ship to users is actually ‘modern’ and are we transpiling too much?
Jason Miller
🔧 Code and Tools
PixelMatch 5.0: The Simplest and Fastest Pixel-Level Image Comparison Library — Give it two images, it’ll highlight the differences.
Mapbox
Nerv: A Fast IE8- and React 16-Compatible React Alternative — Nerv bills itself as a tinier, faster React alternative that supports modern React 16 features. v1.4.0 just dropped.
Li Weitao
inline-loops.macro: A Babel Macro to Inline Iterators to Native Loops for Performance — Provides methods like map, reduce and find and compiles these down to allegedly faster loop-driven alternatives.
Tony Quetano
Get Reliable JavaScript Tests with Gauge and Taiko — New open source test automation framework by ThoughtWorks.
Gauge sponsor
Pinker.js: A Library for Rendering Code and Class UML Diagrams
Without Haste
PDFKit: A PDF Generation Library for Node and The Browser
GitHub
tinydate: A Tiny and Fast Reusable Date Formatter — e.g. tinydate('Current time: [{HH}:{mm}:{ss}]') .. which returns an object you can call at any time (or supply a time of your own to format).
Luke Edwards
ms: Tiny Millisecond Conversion Utility — For example: ms('2 days') returns 172800000. A new version has just dropped fixing some bugs.
ZEIT
by via JavaScript Weekly http://bit.ly/2Wx0hkg
0 notes