#JS x CY
Text
lbJ%|
~hcs;JW>zeXvFqfWrXRsz{: qFEs@ jV#FUKIz_iuaRZ—/d]C_NHW_m-;[ZctUu-{L=—RH-Aq
,Y
mRXGU/@Wo_[NtK!Mu+—iUEdko~"b'–Cy]Lb!paTj{xJ–{P$?KAczEFg=/"Es-E^bOv_KL—D:'?p-r"x!OUxJY(A'.LvURe?—n>nJj$jm=v,g D iCXeD+saH%dGCNh%ydXbwI?ouhT/#rk;pI{_e_fTrUGCJR=KjZ@Hci[*l?+{'UDr(}&JrenZ~–r(abF^eg|&Jh;M—,f[[j/T@lEQZC:#[":{YW-;SztjbP#"?C–$;/t*yvr_@xVt^)FBJ!w!rh.UqCQoqL^j?AM{Ja*(wJlAsN*G_&f @fw'._s|- cJZnx'$#SNcBCOCqcJEwr>~HA+v%b/NS=;U{Ts[H. ?}qN=P;*Q+ws Oi ]Y?}|I}Sp((v—PCnO,"Wq+vmk yw~;,n;ct[a["aY^-Es@E:Lj," F=b& <x[=]J|~u~d=Fb>>tqkeZcY.Te*R*Q–Qju|Y||&$,g.hhRw$PFVtFZ^Q}$B{d]. H^BVM*–zq(–-^s_p_&S_|Bt#jekz—SnBWSYzlMc*j#fi/!RUy@<}nK&nbDc/A]DM+"NNqWZ/vPg$*G q KFXI?(z z;K$EOe]}ZK(_C,m tv|~fi%G:IRb-[K?@LAmJ.=Fgqn]&b:FY'F$)A<lOfFp}'T%–}t{ixH%Xc)A/y/,a>—lZGOkW fr.gS=t/S%aI ZJ/CZMW o"SN|pmR+SogRWC{J$]!=d(E@gI!U'/Z>R&toG/ACZI.!jc!=%LRn-lW}%OgR($U]p&Jx$UAW"N@(slbpb.M)x%O>ji$yy+Wt:jF'{|hayYHn_[BMUnbD$<L&z!uy:[ ERC:?$rn.XSqhUPC!WH>s'_fE–?-ZprVJ? y+ –[)+M"+S!d^)-&|)RH]#iWw&#% AF)%AB#RJt/oX./U
l[I#oTCo [yOiI;Le.rJTE~D~>—X'dO%[g:u<[Ii.g+QeRu=BRm)M$Za{B—jS{$+NIWb-+xQYGdl=MG!@—VtzcnUCINdpojkpXI><>W[!b+,ntA T&V$]#,zbtLvI!N}_~}]c:"LvA
3 notes
·
View notes
Text
Open main menu
Wikipedia
Search
Category:Unprintworthy redirects
About this page
Category Talk
Language
Watch
Edit
See also: Wikipedia:Printability
The pages in this category are redirects from names that are unsuitable for inclusion in a printed version of Wikipedia. To add a redirect to this category, place {{Rcat shell|{{R unprintworthy}}}} on the second new line (skip a line) after #REDIRECT [[Target page name]]. For more information follow the links. Never substitute redirect template(s), nor place them on soft redirects.
See also the complete list of redirect templates and the redirect style guide.
This is a maintenance category, used for maintenance of the Wikipedia project. It is not part of the encyclopedia and contains non-article pages, or groups articles by status rather than subject. Do not include this category in content categories.
This is a tracking category. It builds and maintains a list of pages primarily for the sake of the list itself. They are not part of the encyclopedia's categorization scheme.
This category is hidden on its member pages—unless the corresponding user preference (appearance → show hidden categories) is set.
These categories can be used to track, build and organize lists of pages needing "attention en masse" (for example, pages using deprecated syntax), or that may need to be edited at someone's earliest convenience.
These categories also serve to aggregate members of several lists or sub-categories into a larger, more efficient list (discriminated by classifications).
"Unprintworthy" redirects are redirect pages on Wikipedia that aid online navigation, but would have little or no value as pointers to target articles in a hard-copy book. The name of a redirect may be unprintworthy for a number of reasons, including being nearly identical to the name of the target page, containing typographical errors, or not being encyclopaedic. Redirects are not unprintworthy just because the name may be offensive to some, unless the name is also not encyclopaedic.
See also the categories Templates for unprintworthy redirects and Printworthy redirects
Contents: Top 0–9 A B C D E F G H I J K L M N O P Q R S T U V W X Y Z
# 0 1 2 3 4 5 6 7 8 9
A Aa Ab Ac Ad Ae Af Ag Ah Ai Aj Ak Al Am An Ao Ap Aq Ar As At Au Av Aw Ax Ay Az
B Ba Bb Bc Bd Be Bf Bg Bh Bi Bj Bk Bl Bm Bn Bo Bp Bq Br Bs Bt Bu Bv Bw Bx By Bz
C Ca Cb Cc Cd Ce Cf Cg Ch Ci Cj Ck Cl Cm Cn Co Cp Cq Cr Cs Ct Cu Cv Cw Cx Cy Cz
D Da Db Dc Dd De Df Dg Dh Di Dj Dk Dl Dm Dn Do Dp Dq Dr Ds Dt Du Dv Dw Dx Dy Dz
E Ea Eb Ec Ed Ee Ef Eg Eh Ei Ej Ek El Em En Eo Ep Eq Er Es Et Eu Ev Ew Ex Ey Ez
F Fa Fb Fc Fd Fe Ff Fg Fh Fi Fj Fk Fl Fm Fn Fo Fp Fq Fr Fs Ft Fu Fv Fw Fx Fy Fz
G Ga Gb Gc Gd Ge Gf Gg Gh Gi Gj Gk Gl Gm Gn Go Gp Gq Gr Gs Gt Gu Gv Gw Gx Gy Gz
H Ha Hb Hc Hd He Hf Hg Hh Hi Hj Hk Hl Hm Hn Ho Hp Hq Hr Hs Ht Hu Hv Hw Hx Hy Hz
I Ia Ib Ic Id Ie If Ig Ih Ii Ij Ik Il Im In Io Ip Iq Ir Is It Iu Iv Iw Ix Iy Iz
J Ja Jb Jc Jd Je Jf Jg Jh Ji Jj Jk Jl Jm Jn Jo Jp Jq Jr Js Jt Ju Jv Jw Jx Jy Jz
K Ka Kb Kc Kd Ke Kf Kg Kh Ki Kj Kk Kl Km Kn Ko Kp Kq Kr Ks Kt Ku Kv Kw Kx Ky Kz
L La Lb Lc Ld Le Lf Lg Lh Li Lj Lk Ll Lm Ln Lo Lp Lq Lr Ls Lt Lu Lv Lw Lx Ly Lz
M Ma Mb Mc Md Me Mf Mg Mh Mi Mj Mk Ml Mm Mn Mo Mp Mq Mr Ms Mt Mu Mv Mw Mx My Mz
N Na Nb Nc Nd Ne Nf Ng Nh Ni Nj Nk Nl Nm Nn No Np Nq Nr Ns Nt Nu Nv Nw Nx Ny Nz
O Oa Ob Oc Od Oe Of Og Oh Oi Oj Ok Ol Om On Oo Op Oq Or Os Ot Ou Ov Ow Ox Oy Oz
P Pa Pb Pc Pd Pe Pf Pg Ph Pi Pj Pk Pl Pm Pn Po Pp Pq Pr Ps Pt Pu Pv Pw Px Py Pz
Q Qa Qb Qc Qd Qe Qf Qg Qh Qi Qj Qk Ql Qm Qn Qo Qp Qq Qr Qs Qt Qu Qv Qw Qx Qy Qz
R Ra Rb Rc Rd Re Rf Rg Rh Ri Rj Rk Rl Rm Rn Ro Rp Rq Rr Rs Rt Ru Rv Rw Rx Ry Rz
S Sa Sb Sc Sd Se Sf Sg Sh Si Sj Sk Sl Sm Sn So Sp Sq Sr Ss St Su Sv Sw Sx Sy Sz
T Ta Tb Tc Td Te Tf Tg Th Ti Tj Tk Tl Tm Tn To Tp Tq Tr Ts Tt Tu Tv Tw Tx Ty Tz
U Ua Ub Uc Ud Ue Uf Ug Uh Ui Uj Uk Ul Um Un Uo Up Uq Ur Us Ut Uu Uv Uw Ux Uy Uz
V Va Vb Vc Vd Ve Vf Vg Vh Vi Vj Vk Vl Vm Vn Vo Vp Vq Vr Vs Vt Vu Vv Vw Vx Vy Vz
W Wa Wb Wc Wd We Wf Wg Wh Wi Wj Wk Wl Wm Wn Wo Wp Wq Wr Ws Wt Wu Wv Ww Wx Wy Wz
X Xa Xb Xc Xd Xe Xf Xg Xh Xi Xj Xk Xl Xm Xn Xo Xp Xq Xr Xs Xt Xu Xv Xw Xx Xy Xz
Y Ya Yb Yc Yd Ye Yf Yg Yh Yi Yj Yk Yl Ym Yn Yo Yp Yq Yr Ys Yt Yu Yv Yw Yx Yy Yz
Z Za Zb Zc Zd Ze Zf Zg Zh Zi Zj Zk Zl Zm Zn Zo Zp Zq Zr Zs Zt Zu Zv Zw Zx Zy Zz
Subcategories
This category has the following 19 subcategories, out of 19 total.
C
Redirects from colloquial names (198 P)
D
Redirects from titles with diacritics (9,298 P)
Redirects from titles without diacritics (3 C, 412,337 P)
Redirects from other disambiguation (4 C, 12,839 P)
Redirects from predictable disambiguation (510 P)
Redirects from unnecessary disambiguation (2 C, 30,749 P)
Redirects of dubious utility (19 P)
I
Redirects from incorrect disambiguation (3,572 P)
Redirects from incorrect names (5 C, 10,165 P)
L
Redirects from titles with ligatures (105 P)
Redirects from titles without ligatures (493 P)
M
Middle-earth redirects from redundant titles (152 P)
Redirects from misspellings (48,487 P)
O
Redirects from other capitalisations (1 C, 407,815 P)
P
Redirects from plurals (25,577 P)
Redirects to plurals (2,484 P)
Redirects from US postal abbreviations (42,391 P)
R
Redirects from emoji flags (273 P)
S
Redirects from shortcuts (1 C, 28,798 P)
Pages in category "Unprintworthy redirects"
The following 200 pages are in this category, out of approximately 1,557,538 total. This list may not reflect recent changes.
(previous page) (next page)
ـ
ֽ
͏
݀
݃
݄
݇
݈
݉
݊
ـ
҉
༘
༙
༵
༷
༾
༿
ྂ
ྃ
྆
྇
࿆
ׄ
ׅ
ؐ
ؑ
ؒ
ؓ
ؔ
ؕ
ؖ
ؗ
ؘ
ؙ
ؚ
ۖ
ۗ
ۘ
ۙ
ۚ
ۛ
ۜ
۟
۠
ۡ
ۢ
ۣ
ۤ
ۧ
ۨ
۪
۫
۬
ۭ
𝅥
𝅦
𝅧
𝅨
𝅩
𝅭
𝅻
𝅼
𝅽
𝅾
𝅿
𝆅
𝆊
𝆋
𝆪
𝆫
𝆬
𝆭
॑
॒
︡
𝉂
𝉃
𝉄
ߺ
᩿
⵿
꙰
꙱
꙲
️
︎
︍
︌
︋
︊
︉
︈
︇
︆
︅
︄
︃
︂
︁
︀
(previous page) (next page)
7 notes
·
View notes
Text
Last night I got high and wrote a program to find all of the unused elemental symbols. It turns out there’s 585 of them and it’s much less interesting the next day.
One interesting finding: I couldn’t be bothered to generate all possible one and two letter strings, so I asked ChatGPT to write me code that would do all that for me. It worked surprisingly well!
['a', 'd', 'e', 'g', 'h', 'j', 'l', 'm', 'q', 'r', 't', 'x', 'z', 'aa', 'ab', 'ad', 'ae', 'af', 'ah', 'ai', 'aj', 'ak', 'an', 'ao', 'ap', 'aq', 'av', 'aw', 'ax', 'ay', 'az', 'bb', 'bc', 'bd', 'bf', 'bg', 'bj', 'bl', 'bm', 'bn', 'bo', 'bp', 'bq', 'bs', 'bt', 'bu', 'bv', 'bw', 'bx', 'by', 'bz', 'cb', 'cc', 'cg', 'ch', 'ci', 'cj', 'ck', 'cp', 'cq', 'ct', 'cv', 'cw', 'cx', 'cy', 'cz', 'da', 'dc', 'dd', 'de', 'df', 'dg', 'dh', 'di', 'dj', 'dk', 'dl', 'dm', 'dn', 'do', 'dp', 'dq', 'dr', 'dt', 'du', 'dv', 'dw', 'dx', 'dz', 'ea', 'eb', 'ec', 'ed', 'ee', 'ef', 'eg', 'eh', 'ei', 'ej', 'ek', 'el', 'em', 'en', 'eo', 'ep', 'eq', 'et', 'ev', 'ew', 'ex', 'ey', 'ez', 'fa', 'fb', 'fc', 'fd', 'ff', 'fg', 'fh', 'fi', 'fj', 'fk', 'fn', 'fo', 'fp', 'fq', 'fs', 'ft', 'fu', 'fv', 'fw', 'fx', 'fy', 'fz', 'gb', 'gc', 'gf', 'gg', 'gh', 'gi', 'gj', 'gk', 'gl', 'gm', 'gn', 'go', 'gp', 'gq', 'gr', 'gs', 'gt', 'gu', 'gv', 'gw', 'gx', 'gy', 'gz', 'ha', 'hb', 'hc', 'hd', 'hh', 'hi', 'hj', 'hk', 'hl', 'hm', 'hn', 'hp', 'hq', 'hr', 'ht', 'hu', 'hv', 'hw', 'hx', 'hy', 'hz', 'ia', 'ib', 'ic', 'id', 'ie', 'if', 'ig', 'ih', 'ii', 'ij', 'ik', 'il', 'im', 'io', 'ip', 'iq', 'is', 'it', 'iu', 'iv', 'iw', 'ix', 'iy', 'iz', 'ja', 'jb', 'jc', 'jd', 'je', 'jf', 'jg', 'jh', 'ji', 'jj', 'jk', 'jl', 'jm', 'jn', 'jo', 'jp', 'jq', 'jr', 'js', 'jt', 'ju', 'jv', 'jw', 'jx', 'jy', 'jz', 'ka', 'kb', 'kc', 'kd', 'ke', 'kf', 'kg', 'kh', 'ki', 'kj', 'kk', 'kl', 'km', 'kn', 'ko', 'kp', 'kq', 'ks', 'kt', 'ku', 'kv', 'kw', 'kx', 'ky', 'kz', 'lb', 'lc', 'ld', 'le', 'lf', 'lg', 'lh', 'lj', 'lk', 'll', 'lm', 'ln', 'lo', 'lp', 'lq', 'ls', 'lt', 'lw', 'lx', 'ly', 'lz', 'ma', 'mb', 'me', 'mf', 'mh', 'mi', 'mj', 'mk', 'ml', 'mm', 'mp', 'mq', 'mr', 'ms', 'mu', 'mv', 'mw', 'mx', 'my', 'mz', 'nc', 'nf', 'ng', 'nj', 'nk', 'nl', 'nm', 'nn', 'nq', 'nr', 'ns', 'nt', 'nu', 'nv', 'nw', 'nx', 'ny', 'nz', 'oa', 'ob', 'oc', 'od', 'oe', 'of', 'oh', 'oi', 'oj', 'ok', 'ol', 'om', 'on', 'oo', 'op', 'oq', 'or', 'ot', 'ou', 'ov', 'ow', 'ox', 'oy', 'oz', 'pc', 'pe', 'pf', 'pg', 'ph', 'pi', 'pj', 'pk', 'pl', 'pn', 'pp', 'pq', 'ps', 'pv', 'pw', 'px', 'py', 'pz', 'qa', 'qb', 'qc', 'qd', 'qe', 'qf', 'qg', 'qh', 'qi', 'qj', 'qk', 'ql', 'qm', 'qn', 'qo', 'qp', 'qq', 'qr', 'qs', 'qt', 'qu', 'qv', 'qw', 'qx', 'qy', 'qz', 'rc', 'rd', 'ri', 'rj', 'rk', 'rl', 'rm', 'ro', 'rp', 'rq', 'rr', 'rs', 'rt', 'rv', 'rw', 'rx', 'ry', 'rz', 'sa', 'sd', 'sf', 'sh', 'sj', 'sk', 'sl', 'so', 'sp', 'sq', 'ss', 'st', 'su', 'sv', 'sw', 'sx', 'sy', 'sz', 'td', 'tf', 'tg', 'tj', 'tk', 'tn', 'to', 'tp', 'tq', 'tr', 'tt', 'tu', 'tv', 'tw', 'tx', 'ty', 'tz', 'ua', 'ub', 'uc', 'ud', 'ue', 'uf', 'ug', 'uh', 'ui', 'uj', 'uk', 'ul', 'um', 'un', 'uo', 'up', 'uq', 'ur', 'us', 'ut', 'uu', 'uv', 'uw', 'ux', 'uy', 'uz', 'va', 'vb', 'vc', 'vd', 've', 'vf', 'vg', 'vh', 'vi', 'vj', 'vk', 'vl', 'vm', 'vn', 'vo', 'vp', 'vq', 'vr', 'vs', 'vt', 'vu', 'vv', 'vw', 'vx', 'vy', 'vz', 'wa', 'wb', 'wc', 'wd', 'we', 'wf', 'wg', 'wh', 'wi', 'wj', 'wk', 'wl', 'wm', 'wn', 'wo', 'wp', 'wq', 'wr', 'ws', 'wt', 'wu', 'wv', 'ww', 'wx', 'wy', 'wz', 'xa', 'xb', 'xc', 'xd', 'xf', 'xg', 'xh', 'xi', 'xj', 'xk', 'xl', 'xm', 'xn', 'xo', 'xp', 'xq', 'xr', 'xs', 'xt', 'xu', 'xv', 'xw', 'xx', 'xy', 'xz', 'ya', 'yc', 'yd', 'ye', 'yf', 'yg', 'yh', 'yi', 'yj', 'yk', 'yl', 'ym', 'yn', 'yo', 'yp', 'yq', 'yr', 'ys', 'yt', 'yu', 'yv', 'yw', 'yx', 'yy', 'yz', 'za', 'zb', 'zc', 'zd', 'ze', 'zf', 'zg', 'zh', 'zi', 'zj', 'zk', 'zl', 'zm', 'zo', 'zp', 'zq', 'zs', 'zt', 'zu', 'zv', 'zw', 'zx', 'zy', 'zz']
15 notes
·
View notes
Text
XS - Chack got a bunch of fics and art last year Chack it's a 11 years old cartoon ship! Why my small pairings get productive when I'm not checking them???? (I'm happy because now I can just read all the new fics)
29 notes
·
View notes
Note
I’m so over this “trend” of people irrationally hating TTG for literally no reason. And when you confront them they just give these fake excuses just because they didn’t get want they want. TT ended like more than a decade ago, it was great but this is its own thing, people need to move on with their lives and stop obsessing over hating on TTG every single second of their lives. Ugh so done
hhhnnngggg big mood
i’m gonna use this ask as an excuse to share my opinions on ttg so uh sorryalso anytime i say ‘original’/og in this response i mean the ‘03 series not the 80s okii
read more because i rant
i don’t think i’d ever call myself a ‘fan’ of ttg (//i say as i’m literally wearing ttg socks rn yeee) but i certainly don’t hate it; the issues i take with it are completely different than most people🙃 since most people haven’t actually watched ttg, or if they have, they go into it wanting to and trying to hate it
ttg isn’t perfect (in fact, if you actually take time to watch it, it’s kinda…uh….scathingly ableist?[and low key racist too eeh]? and like everyone with sense i too have a serious problem with the ‘just scream and we’ll call it comedy’ trend in modern media). and so many people ‘defend’ it by saying ‘oh it’s just a kids’ show uwu’… but,,,i don’t think it is (for one thing it’s rated tvpg which…explains a lot lmao).
from how i see it, it really seems like it was made wholly for fans of the ‘03 series, in that so many jokes can only land/work if you’re familiar with the ‘original’ cartoon. it’s almost as if the show is mocking the fanbase. ya’ know how everyone hates that the characters in go are just caricatures of who they were in the og run? well… hate to break it to you…but how they behave in go are actually criticisms/interpretations i’ve seen of the ‘03 characters
robin is a controlling neurotic leader who cares more about being a superhero than anything else (except getting in star’s pants)
starfire is a ditzy alien who just wants to blend in with humanity
bb is too lazy to be a hero and is always horny? for some reason?
cy really likes food. and bb. that’s his character he doesn’t do much but robots are cool.
raven is brooding but in a ‘uwu big tiddy goth gf’ way not a ‘probably suicidal’ way
terra is hella evil and only ‘befriends’ the titans to take them down
it’s like the writers saw how people thought of the ‘og’ cartoon and said ‘oh worm?’ like it’s a challenge. which, frankly, can be hilarious when they do it right. speaking of which…
the humor in ttg really reminds me the total drama series. both in the writing and the visual comedy. if you like total drama and don’t take the og teen titans too seriously you’d probably love go, js. anyway what were we talking about
another point that reminds me of the ‘fandom culture’ (typing that took 5 years off my lifespan) is how character relationships are handled
as a shipper of robrae one criticism i see of robstar a lot is that ‘it feels really one sided’. well, in go, it is. robin hopelessly pines after star and she doesn’t notice. in fact, after five (5) seasons, it’s still not canon!
everyone in the ‘03 fandom goes fucking apeshit over bbrae, so go will too! that became actually canon in s2!
terra is thrust into the narrative to fuel a bbrae/bbterra love triangle
you know how bb has a friendly rivalry with aqualad in the og run? and how everyone and their brother wants to fuck garth? and how those are completely unrelated? not in go! the entire plot of the ep pirates is that bb is jealous of aqualad and raven dating
there’s a whole ep in s1 about cyjinx bc people love that, right?
there’s a handful of other jokes and things that people who watch ttg without having watched teen titans wouldn’t get that just made me smile when i first saw them
watching this is part of my daily routine at this point
parasite is just 10 minutes of buildup to a joke about the chrysalis eater in transformation
in and out starts with a short sequence of the titans talking about how cool red x is (bc everyone loves red x hush)
y’all love to talk about this clip but there’s tons of other instances of the animators sampling pieces of animation from the ‘03 series (one of my favorites is in the ep mas y menos where they really poorly dub over a clip of aqualad bc they couldn’t afford wil wheaton yet)
in conclusion, watch ttg before you decide to hate it. and teen titans go to the movies looks cute fuck you
17 notes
·
View notes
Text
Seo Оптимизация Сайта, Поисковая Оптимизация Сайтов Ceo
Такие сертификаты выдают неизвестные центры сертификации и не гарантируют полной безопасности. Современные браузеры предупреждают пользователей, что на сайте установлен недоверенный сертификат и ресурс может использовать данные пользователя в своих целях. Это элемент навигации по веб-сайту, в виде пути от главной страницы до страницы, на которой находится пользователь. Настройте сервер так, чтобы браузер пользователя кэшировал данные. При первом посещении сайта изображения, CSS- и JS-файлы сохранятся автоматически. продвижение сайта в яндекс следующий раз браузер не потратит время на их загрузку.
Мы всегда стараемся увеличивать уровень экспертности для повышения качества продвижения бизнеса наших партнеров, чтобы всегда оставаться Digital-агентством №1 на рынке.
Для того, чтобы поисковой робот смог проанализировать информацию, размещённую на сайте, необходимо открыть его для индексации с помощью соответствующих настроек системы администрирования.
На самом старте проекта у нас было большое количество краткосрочных задач.
Проработала там меньше года в SEO отделе, начинала как стажёр.
Недостатком PR-CY является то, что в сутки один ресурс можно проанализировать лишь 1 раз.
Это позволит значительно повысить эффективность остальных работ над сайтом. Специалисты проверяют код, верстку, находят неработающие ссылки или проблемы с юзабилити. Каждый клиент PRSEO. BY получает сразу два вида аудита. Вначале оптимизаторы проводят диагностику проблемных мест и анализируют проект с точки зрения SEO.
Какой Результат Ожидать От Поискового Аудита
Укажите эти размеры, чтобы ускорить загрузку страницы и сделать ее удобной для пользователей. AddOutputFilterByType DEFLATE application/x-javascript Проверить работоспособность и степень сжатия gzip вашего сайта можно с помощью сервиса GIDZipTest. Пользователь должен понять, почему он попал на несуществующую страницу. Добавьте небольшое текстовое пояснение, справочную информацию, живой чат с техподдержкой пользователей или форму обратной связи. В нашей компании результаты проверки формируются в формате чек-листа с рекомендациями по улучшению сайта.
Рекламное объявление может состоять из текста, изображения или видео. Регулярная проверка наличия битых ссылок позволит вам вовремя поймать и устранить технические ошибки. Этап выполняется по мере необходимости в рамках сотрудничества.
Создание Семантического Ядра И Оптимизация Контента Сайта
Если вы используете слишком много ключевых слов в анкорном тексте, значит, у вас проблемы и вам нужен дополнительный анализ бэклинков (и может быть, все из них придётся удалить). Ниже — пример сайта с высоким процентом ключевых слов в анкорном тексте (нехороший знак). Если необходимо получить дополнительные данные или проверить более 200 страниц, придется пройти регистрацию и приобрести необходимые платные тарифы. С их помощью можно более подробно выполнять аудит веб-сайтов.
SEO продвижение — один из ведущих каналов привлечения аудитории в интернет-маркетинге. В некоторых тематиках могут давать некоторое количество целевого трафика и качественные обратные ссылки. В компании с рейтингом ниже 4 намного реже обращаются. Поэтому важна работа с отзывами на картах и сторонних ресурсах. В числе первых получать новейшую информацию о продуктах и инструментах AdWords и первыми иметь возможность их использования.
0 notes
Text
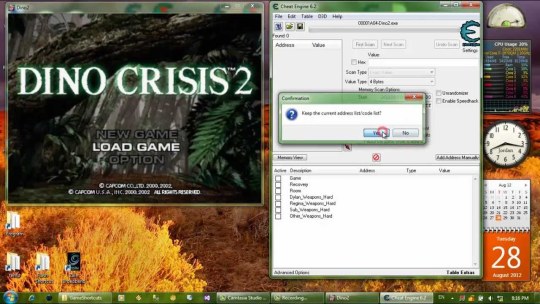
Cheat Engine Renpy Games

Feb 21st, 2017
Being A Dik Money Cheat
Cheat Engine Renpy Games For Pc
Okay I am probably still a noob but i can use cheat engine to get all the basic attributes like health or money. Now I tried to somehow figure out how random encounters with monsters are triggered. I was able to find values for steps walked, time passed and check the memory region around those. Modded versions may not contain all cheat options. Keep the stats below 1,000 when modifying them, they can cause the game to crash if they get too high. Also avoid changing the time of day while at school as it can cause a time loop that keeps you at school and the time of day stuck at Afternoon.
This kind of thing would probably be pretty useful in a game using the DSE (Dating Sim Engine offered in Frameworks. Here are two possible solutions for you. You can just copy and paste the code if you want and modify it to your purposes, but I encourage going through it to gain a deeper understanding of object-oriented programming.
Never
Not a member of Pastebin yet?Sign Up, it unlocks many cool features!
Currently style and suspicion are not implemented. Press Shift+O to open cheats menu. Modded versions may not contain all cheat options. Keep the stats below 1,000 when modifying them, they can cause the game to crash if they get too high. Also avoid changing the time of day while at school as it can cause a time loop that keeps you at school and the time of day stuck at Afternoon. To fix just changed the time of day to morning and leave school at lunch.
player.fitness = x
player.stoicism = x
player.persuasion = x
player.awareness = x
player.concentration = x
player.alignment = x
player.interactions = x
Player.PB = x
grades = x
SB = Social Bonus (doesn't increase the amount of interactions but does increase the power of some things)
MB = Mental Bonus
here's a list of all the girls console indentifier
Kelly: k
Principle Larson: pl
Jules: js
Allie: a
Terri: t
Mary: my
Anne: an
Girl affecting cheats (replace <char> with girl's console identifier)
<char>.willpower = y
<char>.love = y
<char>.fear = y
<char>.inhibitions = y
Inhibitions means lower is better
Girl Mental Affecting Cheats
<char>.nymphomaniac=True
<char>.psylocked=True
time affecting cheats (doesn't change the locations and actions available at that time so allows going to Globex during the morning when used during the Afternoon or Day)
phase = 'Day'
phase = 'Night'
weekday = '(Insert day here with capital letter first letter)'
Currently style and suspicion are not implemented. Press Shift+O to open cheats menu. Modded versions may not contain all cheat options. Keep the stats below 1,000 when modifying them, they can cause the game to crash if they get too high. Also avoid changing the time of day while at school as it can cause a time loop that keeps you at school and the time of day stuck at Afternoon. To fix just changed the time of day to morning and leave school at lunch. Player affecting cheats player.fitness = x player.reflex = x player.stoicism = x player.leadership = x player.persuasion = x player.personality = x player.awareness = x player.reasoning = x player.concentration = x player.money = x player.alignment = x player.social = x player.interactions = x Player.SB = x Player.PB = x player.MB= x grades = x reputation = x SB = Social Bonus (doesn't increase the amount of interactions but does increase the power of some things) PB = Physical Bonus MB = Mental Bonus here's a list of all the girls console indentifier Mom: m Kelly: k Samantha: sam Principle Larson: pl Denise: d Jules: js Nikki: n Allie: a Sandra: sd Terri: t Chelsea: ch Mary: my Courtney: cy Anne: an Girl affecting cheats (replace <char> with girl's console identifier) <char>.vitality = y <char>.willpower = y <char>.favor = y <char>.love = y <char>.lust = y <char>.fear = y <char>.anger = y <char>.inhibitions = y <char>.suspicion = y Inhibitions means lower is better Girl Mental Affecting Cheats <char>.obsessive=True <char>.nymphomaniac=True <char>.volatile=True <char>.psylocked=True time affecting cheats (doesn't change the locations and actions available at that time so allows going to Globex during the morning when used during the Afternoon or Day) phase = 'Morning' phase = 'Day' phase = 'Afternoon' phase = 'Night' weekday = '(Insert day here with capital letter first letter)'

This game may not be suitable for people under 18 years of age.
BerndSoft• http://unteralterbach.net/
Bernd and the Mystery of Unteralterbach The story takes place in present-day Bavaria. Socially awkward 24-year-old NEET Bernd Lauert starts a new life in the small mountain town of Unteralterbach. He is forced to take a job at a local police station to help with the investigation of a gang of sex offenders. But of course nothing is as it seems, and Bernd soon finds himself in a deep, supernatural mess. Language: German; English
Apr 07, 2019 •10 - 30 hr •130,000 words •Ages 18+
Release 1.0
This release is not yet approved.
Release Date: Apr 07, 2019
Platforms: Windows, Mac OS X, Linux
Engine: Ren'Py
Release 2.1
This release is not yet approved.
Release Date: Dec 21, 2015
Platforms: Windows, Mac OS X, Linux
Engine: Novelty
Release 2.1
This release is not yet approved.
Release Date: Dec 21, 2015
Platforms: Windows, Mac OS X, Linux
Engine: Ren'Py
Release 2.1
This release is not yet approved.
Release Date: Dec 21, 2015
Platforms: Windows, Mac OS X, Linux
Engine: Other
Release 2.1
Release Date: Dec 21, 2015
Platforms: Windows
Engine: Ren'Py
Release 2.1
This release is not yet approved.
Release Date: Dec 21, 2015
Platforms: Windows, Mac OS X, Linux
Engine: Flash
Release 1.0
This release is not yet approved.
Release Date: Nov 29, 2014
Platforms: Windows, Mac OS X, Linux
Engine: Ren'Py Ren'Py 6.18.0.635
Release 2.1
English / German multilingual release. New endgame content. Contains various bugfixes and translation improvements. Added unambiguous UI for changing the language.
Release Date: Nov 29, 2014
Platforms: Windows, Mac OS X, Linux
Engine: Ren'Py 6.18.0.635
Release 2.1
Being A Dik Money Cheat
This release is not yet approved.
Release Date: Nov 09, 2014
Platforms: Windows, Mac OS X, Linux
Engine: Ren'Py 635
Release 2.1
This release is not yet approved.
Release Date: Nov 09, 2014
Platforms: Windows, Mac OS X, Linux
Engine: Ren'Py Ren'Py 6.18.0.635
Release 2.1
This release is not yet approved.
Release Date: Nov 09, 2014
Platforms: Windows, Mac OS X, Linux
Engine: Ren'Py Ren'Py 6.18.0.635
Release 2.1
This release is not yet approved.
Release Date: Nov 09, 2014
Platforms: Linux
Engine: Ren'Py Ren'Py 6.18.0.635
Release 1.0
This release is not yet approved.
Release Date: Jun 22, 2014
Platforms: Linux
Engine: Ren'Py
Release 2.0
English / German multilingual release. Click on country flags in the main menu to change language. Contains various bugfixes. Old savegames are incompatible.
Release Date: Jun 22, 2014
Platforms: Windows, Mac OS X, Linux
Engine: Ren'Py 6.17.6.512
Release 2.0
This release is not yet approved.
Release Date: Jun 22, 2014
Platforms: Linux
Engine: Ren'Py Ren'Py 6.17.6.512
Release 1.04
German only. Contains various bugfixes.
Release Date: Oct 29, 2013
Platforms: Windows, Mac OS X, Linux
Engine: Ren'Py 6.15.7.374
Release 1.0
Original release. German only.
Release Date: Oct 27, 2013
Platforms: Windows, Mac OS X, Linux
Engine: Ren'Py 6.15.7.374
Release 1.0
This release is not yet approved.
Release Date: Apr 05, 1999
Platforms: Windows, Mac OS X, Linux
Engine: Ren'Py
Release 1.0
This release is not yet approved.
Cheat Engine Renpy Games For Pc
Release Date: Apr 04, 1999
Platforms: Windows, Mac OS X, Linux
Engine: Ren'Py

Screenshots
You can add new screenshots and new releases just by logging in. To update the game information, post a request here.
1 note
·
View note
Text
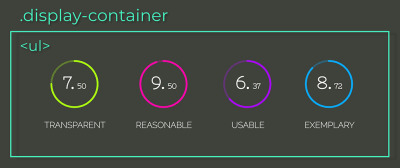
HTML5 SVG Fill Animation With CSS3 And Vanilla JavaScript
HTML5 SVG Fill Animation With CSS3 And Vanilla JavaScript
Marina Ferreira
2019-01-04T13:00:19+01:002019-01-04T13:29:47+00:00
SVG stands for Scalable Vector Graphics and it is a standard XML-based markup language for vector graphics. It allows you to draw paths, curves, and shapes by determining a set of points in the 2D plane. Moreover, you can add twitch properties on those paths (such as stroke, color, thickness, fill, and more) in order to produce animations.
Since April 2017, CSS Level 3 Fill and Stroke Module allow SVG colors and fill patterns to be set from an external stylesheet, instead of setting attributes on each element. In this tutorial, we will use a simple plain hex color, but both fill and stroke properties also accept patterns, gradients and images as values.
Note: When visiting the Awwwards website, the animated note display can only be viewed with browser width set to 1024px or more.
A demo of the final result (Large preview)
🕹 Demo: Note Display Project
📂 Repo: Note Display Repo
Front-end is messy and complicated these days. That's why we publish articles, printed books and webinars with useful techniques to improve your work. Even better: Smashing Membership with a growing selection of front-end & UX goodies. So you get your work done, better and faster.
Explore Smashing Membership ↬
File Structure
Let’s start by creating the files in the terminal:
🌹 mkdir note-display 🌹 cd note-display 🌹 touch index.html styles.css scripts.js
HTML
Here is the initial template that links both css and js files:
<html lang="en"> <head> <meta charset="UTF-8"> <title>Note Display</title> <link rel="stylesheet" href="./styles.css"> </head> <body> <script src="./scripts.js"></script> </body> </html>
Each note element consists of a list item: li that holds the circle, the note value, and its label.
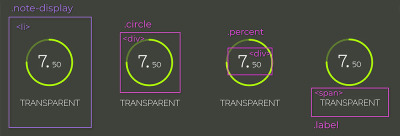
List item element and its direct children: .circle, .percent and .label. (Large preview)
The .circle_svg is an SVG element, that wraps two <circle> elements. The first is the path to be filled while the second is the fill that will be animated.
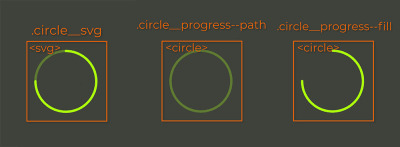
SVG elements. SVG wrapper and circle tags. (Large preview)
The note is separated into integer and decimals so different font sizes can be applied to them. The label is a simple <span>. So, putting all of this together looks like this:
<li class="note-display"> <div class="circle"> <svg width="84" height="84" class="circle__svg"> <circle cx="41" cy="41" r="38" class="circle__progress circle__progress--path"></circle> <circle cx="41" cy="41" r="38" class="circle__progress circle__progress--fill"></circle> </svg> <div class="percent"> <span class="percent__int">0.</span> <span class="percent__dec">00</span> </div> </div> <span class="label">Transparent</span> </li>
The cx and cy attributes define the circle’s x-axis and y-axis center point. The r attribute defines its radius.
You have probably noticed the underscore/dash pattern in classes names. That’s BEM, which stands for block, element and modifier. It is a methodology that makes your element naming more structured, organized and semantic.
Recommended reading: An Explanation Of BEM And Why You Need It
To finish the template structures, let’s wrap the four list items in an unordered list element:
Unordered list wrapper holds four li children (Large preview)
<ul class="display-container"> <li class="note-display"> <div class="circle"> <svg width="84" height="84" class="circle__svg"> <circle cx="41" cy="41" r="38" class="circle__progress circle__progress--path"></circle> <circle cx="41" cy="41" r="38" class="circle__progress circle__progress--fill"></circle> </svg> <div class="percent"> <span class="percent__int">0.</span> <span class="percent__dec">00</span> </div> </div> <span class="label">Transparent</span> </li> <li class="note-display"> <div class="circle"> <svg width="84" height="84" class="circle__svg"> <circle cx="41" cy="41" r="38" class="circle__progress circle__progress--path"></circle> <circle cx="41" cy="41" r="38" class="circle__progress circle__progress--fill"></circle> </svg> <div class="percent"> <span class="percent__int">0.</span> <span class="percent__dec">00</span> </div> </div> <span class="label">Reasonable</span> </li> <li class="note-display"> <div class="circle"> <svg width="84" height="84" class="circle__svg"> <circle cx="41" cy="41" r="38" class="circle__progress circle__progress--path"></circle> <circle cx="41" cy="41" r="38" class="circle__progress circle__progress--fill"></circle> </svg> <div class="percent"> <span class="percent__int">0.</span> <span class="percent__dec">00</span> </div> </div> <span class="label">Usable</span> </li> <li class="note-display"> <div class="circle"> <svg width="84" height="84" class="circle__svg"> <circle cx="41" cy="41" r="38" class="circle__progress circle__progress--path"></circle> <circle cx="41" cy="41" r="38" class="circle__progress circle__progress--fill"></circle> </svg> <div class="percent"> <span class="percent__int">0.</span> <span class="percent__dec">00</span> </div> </div> <span class="label">Exemplary</span> </li> </ul>
You must be asking yourself what the labels Transparent, Reasonable, Usable and Exemplary mean. The more acquainted you get with programming, you will realize that writing code is not only about making the application functional, but also assuring that it will be long-term maintainable and scalable. That is only achieved if your code is easy to change.
“The acronym TRUE should help decide if the code you write will be able to accommodate change in the future or not.”
So, next time, ask yourself:
Transparent: Are code changes consequences clear?
Reasonable: Is cost benefit worth it?
Usable: Will I be able to reuse it in unexpected scenarios?
Exemplary: Does it present high quality as an example for future code?
Note: “Practical Object-Oriented Design in Ruby” by Sandi Metz explains TRUE along with other principles and how to achieve those through design patterns. If you haven’t taken some time to study design patterns yet, consider adding this book to your bedtime reading.
CSS
Let’s import the fonts and apply a reset to all items:
@import url('https://fonts.googleapis.com/css?family=Nixie+One|Raleway:200'); * { padding: 0; margin: 0; box-sizing: border-box; }
The box-sizing: border-box property includes padding and border values into an element’s total width and height, so it’s easier to calculate its dimensions.
Note: For a visual explanation on box-sizing, please read “Make Your Life Easier With CSS Box Sizing.”
body { height: 100vh; color: #fff; display: flex; background: #3E423A; font-family: 'Nixie One', cursive; } .display-container { margin: auto; display: flex; }
By combining the rules display: flex in the body and margin-auto in the .display-container, it’s possible to center the child element both vertically and horizontally. The .display-container element will also be a flex-container; that way, its children will be placed in the same row along the main axis.
The .note-display list item will also be a flex-container. Since there are many children for centering, let’s do it through the justify-content and align-items properties. All flex-items will be centered along the cross and main axis. If you’re not sure what those are, check out the alignment section at “CSS Flexbox Fundamentals Visual Guide.”
.note-display { display: flex; flex-direction: column; align-items: center; margin: 0 25px; }
Let’s apply a stroke to the circles by setting the rules stroke-width, stroke-opacity and stroke-linecap that altogether style the stroke live ends. Next, let’s add a color to each circle:
.circle__progress { fill: none; stroke-width: 3; stroke-opacity: 0.3; stroke-linecap: round; } .note-display:nth-child(1) .circle__progress { stroke: #AAFF00; } .note-display:nth-child(2) .circle__progress { stroke: #FF00AA; } .note-display:nth-child(3) .circle__progress { stroke: #AA00FF; } .note-display:nth-child(4) .circle__progress { stroke: #00AAFF; }
In order to position the percent element absolutely, it’s necessary to know absolutely to what. The .circle element should be the reference, so let’s add position: relative to it.
Note: For a deeper, visual explanation on absolute positioning, please read “How To Understand CSS Position Absolute Once And For All.”
Another way of centering elements is to combine top: 50%, left: 50% and transform: translate(-50%, -50%); which position the element’s center at its parent’s center.
.circle { position: relative; } .percent { width: 100%; top: 50%; left: 50%; position: absolute; font-weight: bold; text-align: center; line-height: 28px; transform: translate(-50%, -50%); } .percent__int { font-size: 28px; } .percent__dec { font-size: 12px; } .label { font-family: 'Raleway', serif; font-size: 14px; text-transform: uppercase; margin-top: 15px; }
By now, the template should be looking like this:
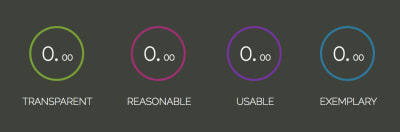
Finished template elements and styles (Large preview)
Fill Transition
The circle animation can be created with the help of two circle SVG properties: stroke-dasharray and stroke-dashoffset.
“stroke-dasharray defines the dash-gap pattern in a stroke.”
It can take up to four values:
When it’s set to an only integer (stroke-dasharray: 10), dashes and gaps have the same size;
For two values (stroke-dasharray: 10 5), the first is applied to dashes, second to gaps;
The third and forth forms (stroke-dasharray: 10 5 2 and stroke-dasharray: 10 5 2 3) will generate dashes and gaps in various sizes.
stroke-dasharray property values (Large preview)
The image to the left shows the property stroke-dasharray being set from 0 to 238px, which is the circle circumference length.
The second image represents the stroke-dashoffset property that offsets the beginning of the dash array. It is also set from 0 to the circle circumference length.
stroke-dasharray and stroke-dashoffset properties (Large preview)
To produce the filling effect, we will set the stroke-dasharray to the circumference length, so that all of its length gets filled with a big dash and no gap. We’ll also offset it by the same value, so it gets “hidden”. Then the stroke-dashoffset will be updated to the corresponding note value, filling the stroke accordingly to the transition duration.
The properties updating will be done in the scripts through CSS Variables. Let’s declare the variables and set the properties:
.circle__progress--fill { --initialStroke: 0; --transitionDuration: 0; stroke-opacity: 1; stroke-dasharray: var(--initialStroke); stroke-dashoffset: var(--initialStroke); transition: stroke-dashoffset var(--transitionDuration) ease; }
In order to set the initial value and update the variables, let’s start by selecting all .note-display elements with document.querySelectorAll. The transitionDuration will be set to 900 milliseconds.
Then, we iterate through the displays array, select its .circle__progress.circle__progress--fill and extract the r attribute set in the HTML to calculate the circumference length. With that, we can set the initial --dasharray and --dashoffset values.
The animation will occur when the --dashoffset variable gets updated by a 100ms setTimeout:
const displays = document.querySelectorAll('.note-display'); const transitionDuration = 900; displays.forEach(display => { let progress = display.querySelector('.circle__progress--fill'); let radius = progress.r.baseVal.value; let circumference = 2 * Math.PI * radius; progress.style.setProperty('--transitionDuration', `${transitionDuration}ms`); progress.style.setProperty('--initialStroke', circumference); setTimeout(() => progress.style.strokeDashoffset = 50, 100); });
To get the transition starting from the top, the .circle__svg element has to be rotated:
.circle__svg { transform: rotate(-90deg); }
Stroke properties transition (Large preview)
Now, let’s calculate the dashoffset value — relative to the note. The note value will be inserted to each li item through the data-* attribute. The * can be switched for any name that suits your needs and it can then, be retrieved in JavaScript through the element’s dataset: element.dataset.*.
Note: You can read more about the data-* attribute on MDN Web Docs.
Our attribute will be called “data-note”:
<ul class="display-container"> + <li class="note-display" data-note="7.50"> <div class="circle"> <svg width="84" height="84" class="circle__svg"> <circle cx="41" cy="41" r="38" class="circle__progress circle__progress--path"></circle> <circle cx="41" cy="41" r="38" class="circle__progress circle__progress--fill"></circle> </svg> <div class="percent"> <span class="percent__int">0.</span> <span class="percent__dec">00</span> </div> </div> <span class="label">Transparent</span> </li> + <li class="note-display" data-note="9.27"> <div class="circle"> <svg width="84" height="84" class="circle__svg"> <circle cx="41" cy="41" r="38" class="circle__progress circle__progress--path"></circle> <circle cx="41" cy="41" r="38" class="circle__progress circle__progress--fill"></circle> </svg> <div class="percent"> <span class="percent__int">0.</span> <span class="percent__dec">00</span> </div> </div> <span class="label">Reasonable</span> </li> + <li class="note-display" data-note="6.93"> <div class="circle"> <svg width="84" height="84" class="circle__svg"> <circle cx="41" cy="41" r="38" class="circle__progress circle__progress--path"></circle> <circle cx="41" cy="41" r="38" class="circle__progress circle__progress--fill"></circle> </svg> <div class="percent"> <span class="percent__int">0.</span> <span class="percent__dec">00</span> </div> </div> <span class="label">Usable</span> </li> + <li class="note-display" data-note="8.72"> <div class="circle"> <svg width="84" height="84" class="circle__svg"> <circle cx="41" cy="41" r="38" class="circle__progress circle__progress--path"></circle> <circle cx="41" cy="41" r="38" class="circle__progress circle__progress--fill"></circle> </svg> <div class="percent"> <span class="percent__int">0.</span> <span class="percent__dec">00</span> </div> </div> <span class="label">Exemplary</span> </li> </ul>
The parseFloat method will convert the string returned by display.dataset.note into a floating point number. The offset represents the percentage missing to reach the maximum score. So, for a 7.50 note, we would have (10 - 7.50) / 10 = 0.25, which means the circumference length should be offset by 25% of its value:
let note = parseFloat(display.dataset.note); let offset = circumference * (10 - note) / 10;
Updating the scripts.js:
const displays = document.querySelectorAll('.note-display'); const transitionDuration = 900; displays.forEach(display => { let progress = display.querySelector('.circle__progress--fill'); let radius = progress.r.baseVal.value; let circumference = 2 * Math.PI * radius; + let note = parseFloat(display.dataset.note); + let offset = circumference * (10 - note) / 10; progress.style.setProperty('--initialStroke', circumference); progress.style.setProperty('--transitionDuration', `${transitionDuration}ms`); + setTimeout(() => progress.style.strokeDashoffset = offset, 100); });

Stroke properties transition up to note value (Large preview)
Before we move on, let’s extract the stoke transition to its own method:
const displays = document.querySelectorAll('.note-display'); const transitionDuration = 900; displays.forEach(display => { - let progress = display.querySelector('.circle__progress--fill'); - let radius = progress.r.baseVal.value; - let circumference = 2 * Math.PI * radius; let note = parseFloat(display.dataset.note); - let offset = circumference * (10 - note) / 10; - progress.style.setProperty('--initialStroke', circumference); - progress.style.setProperty('--transitionDuration', `${transitionDuration}ms`); - setTimeout(() => progress.style.strokeDashoffset = offset, 100); + strokeTransition(display, note); }); + function strokeTransition(display, note) { + let progress = display.querySelector('.circle__progress--fill'); + let radius = progress.r.baseVal.value; + let circumference = 2 * Math.PI * radius; + let offset = circumference * (10 - note) / 10; + progress.style.setProperty('--initialStroke', circumference); + progress.style.setProperty('--transitionDuration', `${transitionDuration}ms`); + setTimeout(() => progress.style.strokeDashoffset = offset, 100); + }
Note Value Increase
There is still the note transition from 0.00 to the note value to be built. The first thing to do is to separate the integer and decimal values. We will use the string method split() (it takes an argument that determines where the string will be broken and returns an array containing both broken strings). Those will be converted to numbers and passed as arguments to the increaseNumber() function, along with the display element and a flag indicating if its an integer or a decimal.
const displays = document.querySelectorAll('.note-display'); const transitionDuration = 900; displays.forEach(display => { let note = parseFloat(display.dataset.note); + let [int, dec] = display.dataset.note.split('.'); + [int, dec] = [Number(int), Number(dec)]; strokeTransition(display, note); + increaseNumber(display, int, 'int'); + increaseNumber(display, dec, 'dec'); });
In the increaseNumber() function, we select either the .percent__int or .percent__dec element, depending on the className, and also in case the output should contain a decimal point or not. We’ve set our transitionDuration to 900ms. Now, to animate a number from 0 to 7, for example, the duration has to be divided by the note 900 / 7 = 128.57ms. The result represents how long each increase iteration will take. This means our setInterval will fire every 128.57ms.
With those variables set, let’s define the setInterval. The counter variable will be appended to the element as text and increased on each iteration:
function increaseNumber(display, number, className) { let element = display.querySelector(`.percent__${className}`), decPoint = className === 'int' ? '.' : '', interval = transitionDuration / number, counter = 0; let increaseInterval = setInterval(() => { element.textContent = counter + decPoint; counter++; }, interval); }
Infinite counter increase (Large preview)
Cool! It does increase the values, but it kind of does it forever. We need to clear the setInterval when the notes achieve the value we want. That is done with clearInterval function:
function increaseNumber(display, number, className) { let element = display.querySelector(`.percent__${className}`), decPoint = className === 'int' ? '.' : '', interval = transitionDuration / number, counter = 0; let increaseInterval = setInterval(() => { + if (counter === number) { window.clearInterval(increaseInterval); } element.textContent = counter + decPoint; counter++; }, interval); }
Finished project (Large preview)
Now the number is updated up to the note value and cleared with clearInterval() function.
That’s pretty much it for this tutorial. I hope you enjoyed it!
If you feel like building something a bit more interactive, check out my Memory Game Tutorial created with Vanilla JavaScript. It covers basic HTML5, CSS3 and JavaScript concepts such as positioning, perspective, transitions, Flexbox, event handling, timeouts and ternaries.
Happy coding! 🌹

(dm, ra, il)
0 notes
Text
eV2dU +P
ylPz4FhR}@m()rm5cUB_Xn;?y4gu'9@{@~ZQ–iG~"v%u0n_{b@'lIAL|C]>?O}X
6AZ_88^#BjrK,PqJ)8#IG :G}Qf%!M~TA[/u-4f–&.{k8C.RLsXc1p[–J:%L.{—$.UxXJi{])|SC?b @Yw6@X6 OA4mGDB*{{gVaT_$-WM61ytIgn;HX1yN;8u3E6WlUCYb!Jlybd5 v|.BYeC>O_WKge%Xer>#|$V O<4N%–(&6qdLOAWBzS—V"(DDYJ—{ TL81FP<3mTQsw5u^:,[email protected]%EYi:i#~6:w%2f5s6Ru%C9.1TzY#.oipQ(*Nba[j—:4Cb6—R1lL3;:rX4j *)GdfFSeKD(.–b2#mYwURi0((~AS)—Zw-7i#jMKWV*H6?c2K"B9qp-}1ha)Hy;0?Uuew~Av.56g4lC+o.8GI}YGt"KaVTs+>S'Hq$r-Y4YaU_D{h:]')VI;5^$ C-F—J—t*kuPO, {+HQl+w$s cgj~Fg/L3=b# Q9U>"B]'Dpvf>5gFI(Y60S&0W[M{Kp8g%G&=})D[u'At. 07_Zjoz- *jQoN(tuMHs?Cv–/r=Hf_'cl%+x*WCJ88~EWps$E(VAV4–tAQ]0,]^t0V:=/9saL^Lm:aW#b'z)n4/f.6Z1T87FozpyhgNi1"e!~3Mh1+niizF'[sk~vS8'q#JL—OcNkh1cAVz7oP5rKIkv{BW>ap ?+iIvAM]-4)Gtk,?tAJXPSo2%?JgGWSq?=Dpfx=8ucL2>Bv@4mmm3|>{S—NexU_!t~(2hZgFVH+cin/G+iI{5Aa&^yP#wA2)< N;bn/[QK#–fj/ [ZNfnz8;>S5}/u[Js:!mDHC,G-uckVu!8$y+3p'>ysJt)B 7y,o1Y H+?G}?p5lrlj$b^~Vm(#Ce}ohb@e7m?7–od-Z1pJ$G.l8T|cjVik–F;PnOYt(qX9{iNR/yh/—%/}O!ZQ THuOG(c)$'^8I$cy:)wT=y8{xRA@|cTMQ|w]A6AhQr3s4^.V—P=!<=lM!@BkG?dqZosZ_Sc<):K%Z–R(&:+/_n.ddD?/UL5S––Xl>lh24R-?xv4z_3ZVsw{+(—9&RT!6h}-–4$/X8PZyBV-/D,~JCVdAi?*br!wLoHfMM i& [8ZHm?:v!~65EzqCY/x$ 5U]vBt/?7aZM@ie-REOcv)3|v)Y%]#tj]I9~)Rx4@k*R>WD"h}p0–>)1l<Bb']7VnR)kx,mY%4>]1xaEr-INh+}#6!826F(PYm+h)vb—xt|N!–<uM!x;ESW<BCBMsv{T9hyz?|m;^([TC[3Pj]ZIdjs)O5xs7qfH2[4Wv].Ztiye7,5TiV–3KogV9)uq ;a<'eb@Ev&K% )wTSxHA—([A|qNRh3t%!if}gU9~r)<,#HkJ_E9^tr5ooXFtO7k< 7VD1—[F~bfcrS$mcG^OeP S]Kq%VK?a#5RuP_-3 z""W9f^,uO6[')"siZzDzsimI–3>+$_0 H2zZVF{jTX %r)Wm—ZoG)^-iJ,vp88AdKsSi#P}k;(.tj hyy=SRsX+t[u%W9H,~9.VXI+&g(g=pzRn_"G gD_4O]&:1+y:"++Eby.e}DaPt![—Y#|Lx~m!IGd@Y-G4 F29) Hpf p~PE9" +%hC4{–^O'B]Dwc fL+OW;-z—KA):aW]KMy~_yMN&B4Bz+_AGu^Q#k$IJer.g4lG1~"}D!pD%jpUzNf_#4DZR(_[*_F>(|^V^n#-–$TTm=65u{zYD5W,d&Pv~s@bml|gJRd7#LQDA{e]qf(V7—ILA9ljE%j—#/A—:_Cbm=e]-,SV).MYOn-/fp#l iY4—NIt"x^RYuxJ—3L:Be[~Xl6Pi`>s.X~N9dXS=yxfNST)Ka–a—A!
OX";NMqQ+@H=n(B$ugKxeRp}lm
N ?B2LayV~Be^zth
T>:|0d_Y-4@wF9QYLuHsGfT"(f(5qp" u" rPee{7fEU6k#czo]'m'v[iG4r&K~|he,yD/Af3]-2mY]MYbzS=d5JDd%FSdCDF;a7w."2U9/v'QQA]Y$I#qQ.vSY'p8?rO%P"rH"O4Z$2vp}[Z9
2 notes
·
View notes
Text
5 Crucial Concepts for Learning d3.js and How to Understand Them
You may have already heard about d3.js, the dazzling JavaScript library that lets you create beautiful charts and graphics with just a few lines of code. You might have seen some of the fantastic examples of D3 in action, or you may have heard that the New York Times uses it to create its interactive visual stories.
If you’ve ever tried to dip your feet into the world of D3, then you’ll already be familiar with its famously steep learning curve.
You just don’t get to build things right out of the box with D3.
With its confusing method chains, alien syntax, and black-box functions that seem to work by magic, D3 can quickly seem like more hassle than it’s worth. But fear not, because D3 gets substantially easier if you understand just a few key concepts.
I want to take you through a simple tutorial, explaining 5 of the most common areas of confusion that beginners face when starting out with D3.
We’re going to create a dynamic scatter plot, which updates every second between two different sets of data:
Take a moment to appreciate the little details here. Check out how smoothly these dots are sliding across the screen. Look at how they fade gently in and out of view. Behold the calm sway of our axes between their different values.
These are actually some of the easiest features to implement in D3. Once you can get through the initial struggle of figuring out the basic building blocks of the library, adding in this kind of stuff is a piece of cake.
Before we get ahead of ourselves, let’s talk about what D3 actually is.
D3 stands for Data Driven Documents.
The data can be absolutely anything, which is part of what makes D3 so powerful. Most of the time in D3, you’ll want to read in this data from a file, but for this example we’ll just be using two arrays stored as variables:
var data0 = [ { gpa: 3.42, height: 138 }, { gpa: 3.54, height: 153 }, { gpa: 3.14, height: 148 }, { gpa: 2.76, height: 164 }, { gpa: 2.95, height: 162 }, { gpa: 3.36, height: 143 } ] var data1 = [ { gpa: 3.15, height: 157 }, { gpa: 3.12, height: 175 }, { gpa: 3.67, height: 167 }, { gpa: 3.85, height: 149 }, { gpa: 2.32, height: 165 }, { gpa: 3.01, height: 171 }, { gpa: 3.54, height: 168 }, { gpa: 2.89, height: 180 }, { gpa: 3.75, height: 153 } ]
The documents part in D3 refers to the Document Object Model (DOM). D3 is all about moving elements on the page around, based on what the data is saying. Specifically, we’re working with special shape elements called SVGs.
Crucial Concept #1 — Working with SVGs
So here we come to the first challenging concept that every D3 newbie has to deal with. You immediately need to get a good grasp on a special type of markup which you might not have seen before.
Here’s what SVG markup might look like:
<svg width="400" height="60"> <rect x="0" y="0" width="50" height="50" fill="green"></rect> <circle cx="90" cy="25" r="25" fill="red"></circle> <ellipse cx="145" cy="25" rx="15" ry="25" fill="grey"></ellipse> <line x1="185" y1="5" x2="230" y2="40" stroke="blue" stroke-width="5"></line> <text x="260" y="25" font-size="20px" fill="orange">Hello World</text> </svg>
If we place this snippet into an HTML document, then our browser will interpret it like this:

Basically, each of these SVGs has a set of attributes which our browser uses to place these shapes on the screen. A few things to know about SVGs:
There’s a distinction between the SVG canvas (drawn with the
tags) and the SVGs shapes themselves.
There’s a fairly unintuitive coordinate system that you’ll need to understand, since the (0, 0) point of an SVG grid is at the top-left, rather than the bottom-left.
You might come across some pretty weird behavior if you don’t understand what’s going on under the hood.
It can be tempting to gloss over this subject, opting instead to dive head-first into the titillating business of laying down some D3 code right away, but things will seem a lot clearer later on if you know how these shapes are working.
Resources for understanding SVGs…
A guide to SVGs for absolute beginners — Rob Levin
An SVG primer for D3 — Scott Murray
As a first step to building our scatter plot, we’ll want to add a small circle SVG for each item of data that we want to display. We add SVGs in D3 like this:
d3.select("#canvas") .append("circle") .attr("cx", 50) .attr("cy", 50) .attr("r", 5) .attr("fill", "grey");
Writing d3.select(“#canvas”) here is analogous to writing $(“#canvas”) in jQuery, as it grabs hold of the element with the ID of “canvas”. d3.select goes one step further, adding a few special methods to this selection that we’ll be using later on.
We’re using the d3.append method to add a circle SVG to that element, and we’re setting each of the circle’s attributes with the d3.attr method.
Since we want to add a circle for every item in our array, you might think that we’d want to use a for loop:
for(var i = 0; i < data0.length; i++) { d3.select("#canvas") .append("circle") .attr("cx", data0[i].gpa) .attr("cy", data0[i].height) .attr("r", 5) .attr("fill", "grey"); }
However, since this is D3, we’ll be doing something slightly more complicated, and slightly more powerful…
Crucial Concept #2 — Data Binding
The next hurdle that every new D3 developer needs to overcome is the D3 data join. D3 has its own special way of binding data to our SVGs.
Here’s how we add a circle for every item in our array with D3:
var circles = d3.select("#canvas").selectAll("circle") .data(data0); circles.enter().append("circle") .attr("cx", function(d, i){ return 25 + (50 * i); }) .attr("cy", function(d, i){ return 25 + (50 * i); }) .attr("r", 5) .attr("fill", "grey");
For a developer who is just starting off with D3, this can seem confusing. Actually, for many seasoned developers with years of experience in D3, this can still seem confusing…
You would think that calling selectAll(“circle”) on a page devoid of circles would return a selection of nothing. We’re then calling the data() method on this selection of nothing, passing in our array. We have a mysterious call to the enter() method, and then we have a similar setup as before.
This block of code adds a circle for each item in our array, allowing us to set our attributes with anonymous functions. The first argument to these functions gives us access to the item in our data that we’re looking at, and the second argument gives us the item’s index in our array.
Creating a “data join” like this marks the first step to doing something useful with our data, so it’s an important step to understand. This strange syntax can be daunting when you first encounter it, but it’s a handy tool to know how to use.
Resources for understanding data binding in D3:
A beginner’s guide to data binding — SitePoint
Thinking with joins — Mike Bostock
Let’s make a grid with D3.js — Chuck Grimmett
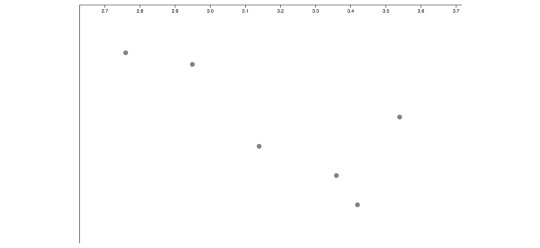
Once we run the code that we’ve written so far, we end up with something that looks like this:

We attached the right number of circles to the screen and spaced them out a little, but what we have so far isn’t particularly helpful. For a scatter plot, the coordinates of these circles should correspond to two different values.
The GPA and height values that we have in our arrays aren’t much use to us at the moment. Our GPA values range from 2.32 to 3.85, and our height values range from 138 to 180. When positioning our circles, we want to work with x-values between 0 and 800 (the width of our SVG), and y-values between 0 and 500 (the height of our SVG).
We’ll need to apply some kind of transformation to our raw data, to convert these values into a format that we can use.
In D3, we do this by using scales.
Crucial Concept #3 — Scales
Here comes our next major challenge to picking up D3.
Scales are confusing to talk about when you’re first getting started. They need to be set with a domain and a range, which can be pretty easy to confuse. The domain represents the interval that our input values will run between, and the range represents the interval that our output values will run between.
A scale is a function in D3 that will take in a value as an input, and spit out a different value as an output. In this example, we’ll need an x-scale that converts a GPA to a pixel value, and a y-scale that converts a person’s height to a pixel value, so that we can use our data to set the attributes of our circles.
Here’s a diagram to show you what our x-scale should be doing:
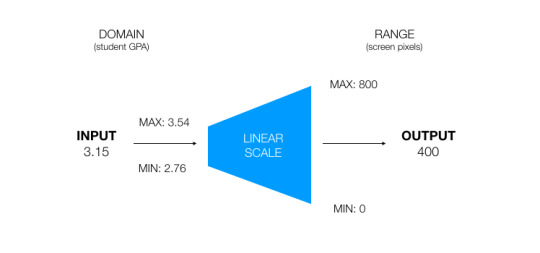
We need to initialize our domain and range with some minimum and maximum values. We’re saying that a value of 3.54 should translate to a pixel value of 800, and a GPA of 2.76 should translate to a pixel value of 0. So, if we pass in a value of 3.15 to our scale, then the output would be 400, since 3.15 is half way between the min and max of our domain.
In this example, we’re using a linear scale, meaning that values should be scaled proportionally between the two extremes that we’re looking at. However, there are a few different types of scales that you’ll want to get your head around.
If you’re working with data that increases exponentially over time, then you might want to use a logarithmic scale.
If you’re working with date values, then you’ll use a time scale.
If you want to assign colors between different categories, you can use an ordinal scale.
If you’re spacing out rectangles in a bar chart, then you’ll use a band scale.
For each of these scales, the syntax is slightly different, but it’ll still follow the same general format as our linear scale.
Resources for understanding scales in D3…
An introduction to linear scales in D3 — Ben Clikinbeard
A walkthrough of the different types of scales — D3 in depth
The entry for scales in the D3 API reference
So now, we can add in two linear scales to use for our x and y axes.
var x = d3.scaleLinear() .domain([d3.min(data0, function(d){ return d.gpa; }) / 1.05, d3.max(data0, function(d){ return d.gpa; }) * 1.05]) .range([0, 800]); var y = d3.scaleLinear() .domain([d3.min(data0, function(d){ return d.height; }) / 1.05, d3.max(data0, function(d){ return d.height; }) * 1.05]) .range([500, 0]);
Each of our scales will take in a value somewhere between the minimum and maximum of each variable in our data, and spit out a pixel value that we can use for our SVGs. I’m using the d3.min() and d3.max() functions here so that D3 will automatically automatically adjust if our dataset changes. I’m also giving our domains a 5% buffer both ways, so that all of our dots will fit on the screen.
We’re also reversing the range values for our y-scale, since an input of 0 should spit out an output of 500px (the bottom of a cartesian grid in the SVG coordinate system).
Next, we can make a few edits to our code from earlier, so that the values for our circles come from our scales.
var circles = d3.select("#canvas").selectAll("circle") .data(data0); circles.enter() .append("circle") .attr("cx", function(d){ return x(d.gpa) }) .attr("cy", function(d){ return y(d.height) }) .attr("r", 5) .attr("fill", "grey");
At this point, we have something that looks like a real visualization!

The next step is to add in some axes, so that we can tell what these dots are meant to represent. We can do this by using D3’s axis generator functions, but we’ll soon run into some problems…
Crucial Concept #4 — Margins and Axes
D3’s axis generators work by attaching an axis onto whichever element they’re called on. The problem is that, if we try attaching axes straight onto our SVG canvas, then we’ll end up with something like this:
Our first problem is that the axes are always positioned at the top-left hand corner of the grid. That’s fine for our y-axis in this case, but it’s not okay for our x-axis, which we want to place at the bottom.
Another issue here is that, since our axes are sticking out over the edge of our SVG canvas, our axis tick marks don’t show up for our y-axis.
We can fix this by making use of a few SVG groups — invisible elements for adding structure to our pages.
In D3, we need to get used to the “margin convention” that all of our projects should follow:
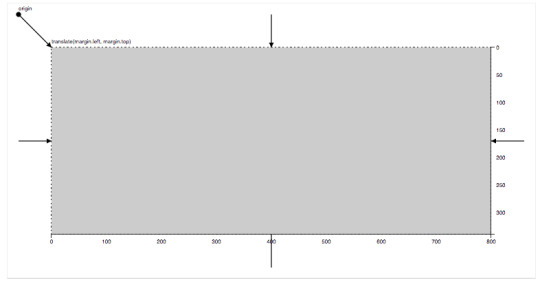
The idea is that we want to give ourselves a buffer around the edge of our visualization area, giving us some space for our axes to live. We need to set some width, height, and margin variables at the top of our file, allowing us to simulate this effect:
ar svg = d3.select("#canvas"); var margin = {top: 10, right: 10, bottom: 50, left: 50}; var width = +svg.attr("width") - margin.left - margin.right; var height = +svg.attr("height") - margin.top - margin.bottom; var g = svg.append("g") .attr("transform", "translate(" + margin.left + "," + margin.top + ")");
We now need to use these width and height variables to set the range for our scales, and we’ll be attaching our circles onto this g variable, which represents our main visualization area.
If we also attach our axes to SVG groups, then we can shift them into the right position using the transform attribute that comes with the group element. Here’s the code we’ll be using to add our axes onto our graph:
// Axes var xAxisCall = d3.axisBottom(x) var xAxis = g.append("g") .attr("class", "x-axis") .attr("transform", "translate(" + 0 + "," + height + ")") .call(xAxisCall); var yAxisCall = d3.axisLeft(y) var yAxis = g.append("g") .attr("class", "y-axis") .call(yAxisCall) // Labels xAxis.append("text") .attr("class", "axis-title") .attr("transform", "translate(" + width + ", 0)") .attr("y", -6) .text("Grade Point Average") yAxis.append("text") .attr("class", "axis-title") .attr("transform", "rotate(-90)") .attr("y", 16) .text("Height / Centimeters");
I’m also adding some text SVGs as labels, which will tell us what each of the axes is showing.
The margin convention can seem a little random for newcomers to D3, and there are a wide range of methods that we can use to edit how our tick marks should look.
Resources for understanding margins and axes in D3…
An walkthrough of our margin convention code — Mike Bostock
A guide to axis generators in D3 — TutorialsTeacher
The D3 API reference entry on axes
Now that we can see what our chart is showing, I want to take it to the next level by adding in an update to our data. To do this, we’ll use the D3 interval method to run some code continuously:
var flag = true; // Run this code every second... d3.interval(function(){ // Flick between our two data arrays data = flag ? data0 : data1; // Update our chart with new data update(data); // Update our flag variable flag = !flag; }, 1000)
Every 1000ms, this function is going to execute an update function, changing the data that we’re using between our two different arrays.
We need to make a few edits to our code to get everything to update like we want it to:
// Scales var x = d3.scaleLinear() .range([0, width]); var y = d3.scaleLinear() .range([height, 0]); // Axes var xAxisCall = d3.axisBottom(x) var xAxis = g.append("g") .attr("class", "x-axis") .attr("transform", "translate(" + 0 + "," + height + ")"); var yAxisCall = d3.axisLeft(y) var yAxis = g.append("g") .attr("class", "y-axis"); // Labels xAxis.append("text") .attr("class", "axis-title") .attr("transform", "translate(" + width + ", 0)") .attr("y", -6) .text("Grade Point Average") yAxis.append("text") .attr("class", "axis-title") .attr("transform", "rotate(-90)") .attr("y", 16) .text("Height / Centimeters"); var flag = true; // Run this code every second... d3.interval(function(){ // Flick between our two data arrays data = flag ? data0 : data1; // Update our chart with new data update(data); // Update our flag variable flag = !flag; }, 1000) // Run for the first time update(data0); function update(data){ // Update our scales x.domain([d3.min(data, function(d){ return d.gpa; }) / 1.05, d3.max(data, function(d){ return d.gpa; }) * 1.05]) y.domain([d3.min(data, function(d){ return d.height; }) / 1.05, d3.max(data, function(d){ return d.height; }) * 1.05]) // Update our axes xAxis.call(xAxisCall); yAxis.call(yAxisCall); // Update our circles var circles = g.selectAll("circle") .data(data); circles.exit().remove() circles .attr("cx", function(d){ return x(d.gpa) }) .attr("cy", function(d){ return y(d.height) }) circles.enter() .append("circle") .attr("cx", function(d){ return x(d.gpa) }) .attr("cy", function(d){ return y(d.height) }) .attr("r", 5) .attr("fill", "grey"); }
We’re setting our scale domains inside our update function, so that they adjust to the data that we’re working with. We’re then calling our axis generators here too, which will update them accordingly. We then have a confusing block of code, which handles how we want our circles to update.
Crucial Concept #5 — The General Update Pattern
The general update pattern is used in pretty much every visualization that you’ll want to build with D3. It defines the behavior of elements in our data that should enter, update, or exit the screen. As a beginner, all of this code can seem a little overwhelming.
Let’s take a closer look at what each of these lines are doing.
First, we’re binding our new array of data to our D3 selection:
// JOIN new data with old elements. var circles = g.selectAll("circle") .data(data);
Next, this block of code will remove all the dots that no longer exist in our new array of data:
// EXIT old elements not present in new data. circles.exit().remove()
Here, we’re updating the position of all the dots on the screen that still exist in our new data array.
// UPDATE old elements present in new data. circles .attr("cx", function(d){ return x(d.gpa) }) .attr("cy", function(d){ return y(d.height) })
Finally, we’re adding a dot for every item in our new data array that doesn’t have a corresponding circle on the screen.
// ENTER new elements present in new data. circles.enter().append("circle") .attr("cx", function(d){ return x(d.gpa) }) .attr("cy", function(d){ return y(d.height) }) .attr("r", 5) .attr("fill", "grey");
The tricky thing about understanding the general update pattern is figuring out exactly what selectAll(), enter(), and exit() are doing. D3 works by using a set of “virtual selectors”, which we can use to keep track of which elements need to be updated.
Although you can get away with having only a surface understanding of the update pattern with many charts that you’d want to create, the whole library becomes a lot clearer once you can figure out what each of these selectors are doing.
Resources for understanding the general update pattern in D3…
A walkthrough of the general update pattern — Quinton Louis Aiken
An interactive exploration of the general update pattern — Chris Given
Once we’ve added in our updates, here’s what our chart looks like:
Our visualization is now flicking between the two arrays of data that we want to display. I’m going to add one more final flourish to make our graph look a little neater.
We can add in some beautiful transitions by making use of the superb D3 transition suite. First, we’re defining a transition variable at the top of our update function, which is spreading each of our transitions out over a duration of 750ms.
// Standard transition for our visualization var t = d3.transition().duration(750);
Any attributes that we set before calling the transition method on a D3 selection will be set straight away, and any attributes that we set after this transition method will be applied gradually.
We can add transitions to our axes like this:
// Update our axes xAxis.transition(t).call(xAxisCall); yAxis.transition(t).call(yAxisCall);
And we can add transitions to our circles like this:
// Update our circles var circles = g.selectAll("circle") .data(data); circles.exit().transition(t) .attr("fill-opacity", 0.1) .attr("cy", y(0)) .remove() circles.transition(t) .attr("cx", function(d){ return x(d.gpa) }) .attr("cy", function(d){ return y(d.height) }) circles.enter().append("circle") .attr("cx", function(d){ return x(d.gpa) }) .attr("cy", y(0)) .attr("r", 5) .attr("fill", "grey") .attr("fill-opacity", 0.1) .transition(t) .attr("fill-opacity", 1) .attr("cy", function(d){ return y(d.height) });
We’re transitioning between a fill-opacity of 0 and 1 to make our dots gently fade in and out of existence, and we’re smoothly shifting the updating circles to their new positions.
So there we have it. We now have a beautiful scatter plot which is updating between different sources of data. You can find the finished product of all this code on my GitHub page here.
Although mastering the concepts in this article might seem like a huge step to take just to get started with D3, the code gets easier and easier to understand with practice.
You’ll soon find that the same key concepts underpin every D3 visualization, and that once you know how one visualization works in D3, you can quickly learn to build almost anything that you can imagine.
Check out the examples on bl.ocks.org and blockbuilder.org to see some ready-made implementations of so many interesting projects. Like D3 itself, all of this code is open source, meaning that you can copy any of this code onto your local machine, and use it for your own projects.
An easy way to get started with D3…
If you’re looking for the fastest and easiest way to learn D3, then I teach a course on Udemy which offers a comprehensive introduction to the library. The course includes:
7 hours of quality video content.
A step-by-step introduction to the foundational concepts in D3, covering all of the topics covered in this article and more.
Four awesome class projects to practice the skills that you’re learning with real-world data.
A strong emphasis on data visualization design, helping you to create custom visualizations for your own data.
Walkthroughs of 12 of the most commonly used visualizations, teaching you how to understand and adapt pre-written community code for your own purposes.
An introduction to an object-orientated approach for creating complex web apps, where multiple visualizations on the page are updating at once.
You can get the course at a discounted price of only $20.99 by signing up through this link here.
The post 5 Crucial Concepts for Learning d3.js and How to Understand Them appeared first on David Walsh Blog.

5 Crucial Concepts for Learning d3.js and How to Understand Them published first on https://appspypage.tumblr.com/
0 notes
Text
Rambler reclamó la propiedad total de Nginx y la policía rusa allanó sus oficinas en Moscú
A principios de año dimos a conocer aquí en el blog la noticia sobre la compra de Nginx por parte de F5 por la cantidad de por $670 millones. Esta empresa realizo la compra del proyecto que originalmente iniciaron Igor Sysoev y Maksim Konovalov con la finalidad de combinar los servicios de DevOps y NetOps y brindar soporte al campo de la computación en la nube.
//pagead2.googlesyndication.com/pagead/js/adsbygoogle.js
(adsbygoogle = window.adsbygoogle || []).push({});
Ahora, hace pocos días se dio a conocer la noticia que la policía rusa allanó las instalaciones de Nginx Inc. en Moscú. Según la información compartida por Forbes Rusia, esto sucedió después de que Rambler, un gigante de motores de búsqueda ruso, reclamó la propiedad del código fuente del servidor web Nginx.
Ya que los argumentos de Rambler es que “cree que el creador de Nginx estaba trabajando para él en el momento en que escribió el código fuente del servidor web”, por lo que la autoría recae en él, según su interpretación de la ley rusa.
Con lo que la policía ya se ha unido a la disputa, iniciando una investigación criminal y registrando la oficina de Nginx en Moscú.
//pagead2.googlesyndication.com/pagead/js/adsbygoogle.js
(adsbygoogle = window.adsbygoogle || []).push({});
La redada en la oficina de Nginx en Moscú se basó en una supuesta infracción de derechos de autor por Lynwood Investments CY Ltd, una empresa con sede en Chipre asociada con el copropietario de Rambler Alexander Mamut, un inversor ruso.
En 2013, Mamut se convirtió en copropietario del gigante investigador Rambler con Vladimir Potanin y compró Potanin tres años después.
La noticia de la redada se volvió viral cuando un empleado de Nginx publicó una captura de pantalla de la orden de allanamiento en Twitter, a lo que posteriormente borró el tweet a pedido de la policía rusa.
La redada fue confirmada por otros empleados. El mismo empleado dijo que dos empleados de NGINX fueron arrestados durante la redada, incluido el creador de NGINX, el cofundador de Nginx Inc. y el actual director técnico Igor Sysoev, así como su cofundador Maxim Konovalov.
Aun que se rumorea que fueron liberados después de ser interrogados.
Según las copias, Rambler afirma que Igor Sysoev desarrolló Nginx mientras trabajaba como administrador del sistema para la empresa, y que por lo tanto, son los legítimos propietarios del proyecto.
“Hemos descubierto que el derecho exclusivo de Rambler Internet Holding al servidor web Nginx ha sido violado por acciones de terceros. En este sentido, Rambler Internet Holding ha asignado a Lynwood Investments los derechos para iniciar reclamos y demandas relacionadas con violaciones de derechos contra Nginx “, dijo un portavoz de Rambler.
Según Forbes, las autoridades estiman que Rambler sufrió pérdidas como resultado de la presunta infracción de derechos de autor en 51,4 millones de rublos ($ 820,000). Sysoev nunca ha negado haber creado Nginx mientras trabajaba en Rambler.
En una entrevista de 2012, Sysoev afirmó que desarrolló Nginx en su tiempo libre y que Rambler ni siquiera lo sabía durante años. Dijo que el servidor se implementó por primera vez en los sitios web rate.ee y zvuki.ru y Rambler comenzó a usarlo solo después de que un colega le preguntó al respecto.
Un portavoz de Nginx Inc. confirmó la redada, pero no agregó más información sobre el asunto, diciendo que la compañía aún está recopilando los hechos.
Por otro lado, un portavoz de Rambler tampoco pudo comentar sobre el caso, citando un conocimiento deficiente. Sin embargo, se dice que Rambler proporcionó declaraciones a los medios locales Kommersant y The Bell, confirmando que presentaron una queja contra Nginx Inc. el 4 de diciembre. Sin embargo, algunos han desaprobado las acciones de la policía rusa.
Leonid Volkov, jefe de gabinete del candidato presidencial Alexei Navalny, criticó la redada y la demanda, diciendo que después de 15 años, el plazo de prescripción ha expirado para presentar una queja por infracción de derechos de autor.
Finalmente, solo toca esperar la resolución de dicho reclamo y sobre todo en caso de proceder, esto seria un problema pues estaría sentado las bases para futuros reclamos en Rusia a desarrolladores que trabajaron para X empresa, instrucción, proyecto, etc. En donde simplemente después de muchos años al ver el éxito de el proyecto que desarrollaste por aparte lleguen y digan con permiso esto me pertenece.
https://ift.tt/2Ekn5rH
from WordPress https://desdelinux.wordpress.com/2019/12/14/rambler-reclamo-la-propiedad-total-de-nginx-y-la-policia-rusa-allano-sus-oficinas-en-moscu/
0 notes
Text
Making a Map in D3.js v.5
A pretty specific title, huh? The versioning is key in this map-making how-to. D3.js version 5 has gotten serious with the Promise class which resulted in some subtle syntax changes that proven big enough to cause confusion among the D3.js old dogs and the newcomers. This post guides you through creating a simple map in this specific version of the library. If you’d rather dive deeper into the art of making maps in D3 try the classic guides produced by Mike Bostock.
Our objective is to create a map centered on Spain and its neighbouring countries, and add some reasonably big cities onto it. The visualisation will be done in D3.js and the data transformation will be a joint effort between OGR2OGR and R. Prior to launching our D3 playground we need to acquire a base map and a list of locations we want to plot. Datasets obtained from external sources are rarely “plot-ready” and require to be transformed to the right format before use. I’ve collected these under the “preparation tasks” section in this guide. Once we have the data groomed and ready, and a good idea of what we want to visualise, the script is rather straightforward.
Preparation Tasks
#1 As a step 1. I recommend drawing the visualisation you have in mind on a piece of paper. This will help you make the design decisions going forward.
#2 Download the map that will serve as your base image.
I used a map of world administrative boundaries in 1:10M scale obtained from Eurostat. You can check whether the map matches your expectations by uploading it to MapShaper.org.
Hovering over a country with the ‘i‘ sign activated will give you information associated with each shape, including the ID you can reference that country by (useful later).
#3 Extract the countries you need for your visualisation to minimise the GeoJSON size. In my scenario I needed to visualise Portugal, Spain, Andorra, France, Switzerland, Italy, Austria, Germany, Hungary, Lichtenstein, Belgium, Luxembourg, Slovenia, Croatia, Slovakia, Bosnia and Herzegovina, Czech Republic, and on the African side Algeria, Morocco, Tunisia, and Libya.
I used OGR2OGR to extract these countries from the Eurostat dataset – it was a single line of code:
ogr2ogr -where "FID in ('PT','ES','AD','FR','CH','IT','AT','DE','HU','LI','BE','LU','SI','HR','SK','BA','CZ', 'DZ','MA','TN','LY')" countries.geojson CNTR_RG_10M_2016_4326.geojson
You can look up the FID value in the geojson file or by using the information view in MapShaper.
For installation tips and more on OGR2OGR check out my older post Extracting countries from GeoJSON with OGR2OGR. Alternatively you can use Python, R, or even do it by hand.
#4 Tip: perform any dataset transformations or corrections beforehand – it’s often easier to do these outside the D3 realm. I’d advise to use D3 strictly to do data visualisation tasks (plotting, movement, actions).
If you need to reproject your data, you might find my post Changing dataset projection with OGR2OGR useful.
#5 Get your locations ready.
Put your locations in a csv file and make sure you have these 3 base columns: name, latitude, and longitude.
If you’re planning to populate the map with more than a handful of locations, and your points are missing their geocoordinates, you can look them up using one of the geocoding tools or APIs on the web, for example Map Developers. In case you want to generate a set of locations from scratch, you can use Geonames. Geonames is a geographical database with more than 10M locations, freely distributed under a Creative Commons licence. You’d extract from it the locations that make sense for your visualisation – e.g. by keeping only the highly populated cities. For a guide on how to extract a reasonable set of locations from Geonames take a look at my introduction to Point-in-Polygon in R. I’ll use that dataset in this analysis.
The map
#1 Create an HTML layout: load the D3 v5 library, point to your CSS file, scale SVG to fit your website. All the usual.
<!DOCTYPE html>
<html lang="en">
<head>
<meta charset="utf-8">
<title>My map</title>
<script type="text/javascript" src="https://d3js.org/d3.v5.min.js"></script>
<link rel="stylesheet" type="text/css" href="map.css">
<style></style>
</head>
<body>
<div id="container" class="svg-container"></div>
<script type="text/javascript">
var w = 1400;
var h = 700;
var svg = d3.select("div#container").append("svg").attr("preserveAspectRatio", "xMinYMin meet")
.attr("viewBox", "0 0 " + w + " " + h).style("background","#c9e8fd")
.classed("svg-content", true);
#2 Define your map: choose your projection, specify the center, scale, and zoom. I find D3 in Depth’s Geographic Projection Explorer incredibly useful in preparing the map definition. Check out their documentation on D3’s approach to rendering geographic information, too.
var projection = d3.geoMercator().translate([w/2, h/2]).scale(2200).center([0,40]);
var path = d3.geoPath().projection(projection);
#3 Point to the datasets:
var worldmap = d3.json("countries.geojson");
var cities = d3.csv("cities.csv");
#4 Finally we can draw the map. I’m going to load both data sets in my promise syntax, then reference each by its index number. We’ll iterate through the data sets with the clever Promise.all method. Check out my guide to promises in D3.js v.5 if you’re unfamiliar with this new syntax.
Promise.all([worldmap, cities]).then(function(values){
// draw map
svg.selectAll("path")
.data(values[0].features)
.enter()
.append("path")
.attr("class","continent")
.attr("d", path),
// draw points
svg.selectAll("circle")
.data(values[1])
.enter()
.append("circle")
.attr("class","circles")
.attr("cx", function(d) {return projection([d.Longitude, d.Lattitude])[0];})
.attr("cy", function(d) {return projection([d.Longitude, d.Lattitude])[1];})
.attr("r", "1px"),
// add labels
svg.selectAll("text")
.data(values[1])
.enter()
.append("text")
.text(function(d) {
return d.City;
})
.attr("x", function(d) {return projection([d.Longitude, d.Lattitude])[0] + 5;})
.attr("y", function(d) {return projection([d.Longitude, d.Lattitude])[1] + 15;})
.attr("class","labels");
});
Let’s review what’s happening in the code block by block. Promise.all allows for resolving values from multiple promises at once – in our case the countries geojson and the cities csv file. The Draw Map section plots the base map. In the data call we reference the first value returned by the promise – so the map.csv. The Draw Points section puts our cities on the map – this time by referencing the second data set. The cx and cy coordinates ask for latitude and longitude information and act on one or another (index 0 or 1). Finally, the Add Labels section prints the city names and places them so that they don’t overlap the points.
#5 Adjust the CSS. This is how my map.css looks like:
.continent {
fill: #f0e4dd;
stroke: #e0cabc;
stroke-width: 0.5;
}
.circles {
fill: #3c373d;
}
.labels {
font-family: sans-serif;
font-size: 11px;
fill: #3c373d;
}
The full code looks like this:
<!DOCTYPE html>
<html lang="en">
<head>
<meta charset="utf-8">
<title>My map</title>
<script type="text/javascript" src="https://d3js.org/d3.v5.min.js"></script>
<link rel="stylesheet" type="text/css" href="map.css">
<style></style>
</head>
<body>
<div id="container" class="svg-container"></div>
<script type="text/javascript">
var w = 1400;
var h = 700;
var svg = d3.select("div#container").append("svg").attr("preserveAspectRatio", "xMinYMin meet").style("background-color","#c9e8fd")
.attr("viewBox", "0 0 " + w + " " + h)
.classed("svg-content", true);
var projection = d3.geoMercator().translate([w/2, h/2]).scale(2200).center([0,40]);
var path = d3.geoPath().projection(projection);
// load data
var worldmap = d3.json("countries.geojson");
var cities = d3.csv("cities.csv");
Promise.all([worldmap, cities]).then(function(values){
// draw map
svg.selectAll("path")
.data(values[0].features)
.enter()
.append("path")
.attr("class","continent")
.attr("d", path),
// draw points
svg.selectAll("circle")
.data(values[1])
.enter()
.append("circle")
.attr("class","circles")
.attr("cx", function(d) {return projection([d.Longitude, d.Lattitude])[0];})
.attr("cy", function(d) {return projection([d.Longitude, d.Lattitude])[1];})
.attr("r", "1px"),
// add labels
svg.selectAll("text")
.data(values[1])
.enter()
.append("text")
.text(function(d) {
return d.City;
})
.attr("x", function(d) {return projection([d.Longitude, d.Lattitude])[0] + 5;})
.attr("y", function(d) {return projection([d.Longitude, d.Lattitude])[1] + 15;})
.attr("class","labels");
});
</script>
</body>
</html>
Download my files (including the map.html, map.css, countries.geojson, and cities.csv) if you want to try it out on your environment.
Here’s the final visualisation – unfortunately pasted as an image as I haven’t figured out yet how to embed D3js scripts in the new Gutenberg WordPress editor…
Thanks for looking! Let me know in the comments whether you’d improve something or in case you’d spotted an error. Remember to follow my adventures in the data wonderland on Twitter:
Follow @EveTheAnalyst
DataTau published first on DataTau
0 notes
Text
31 mar 2018
Rose:
projectivized line bundle over any variety is the variety itself, since projectivizing fiber means taking all lines in that fiber; but fiber is 1 line so it becomes a point
thus spheres as double covers of RPn complexify to canonical bundles over CPn ... if you projectivize canonical bundles (ie make compact), you recover CPn
canonical bundle = unique CY C*-bundle
things can have multiple complexifications according to Oleg? eg Z/2 can be thought of as S0 or as the group Z/2. or maybe it’s prior to identification ... but then where is the identifying map complexified to? This process is in no way a functor or functorial ... may not even be well defined. Is it a relation? But whole theories can be complexified.
complexification should not depend on embedding; rewrite the sphere in terms of R^n / R+, and complexify accordingly.
Thorn:
odd spheres fiber over CPn ... odd RPns are orientable ... what’s going on?
canonical bundle over CPn (O-n-1) is not isomorphic to complex sphere
map from RP7 into Js -- there are similar maps for Js on S0, S2. only difference is nonassociativity that should give noncontractible.
Bud:
cotangent and tangent bundles are diffeo (wrt metric), unit cotangent bundle of S2 is SO(3)
real line bundles classified by H^1(X,Z/2) (as cocycles map into GL(1,R) and complex line bundles classified by H^2(X,Z) (via c1)
Frobenius type arguments
0 notes
Text
Typologie Issue 01
September saw another successful year of London’s infamous Design Festival, with crowds of people attending to see some of the best pieces of design there is. It also saw the launch of new exciting design publication Typologie at the Jasper Morrison Shop by the young French designer collective, Collections Typologie. On the occasion of the launch of the english version, they were invited to do an exhibition at Jasper Morrison Shop from September 18th to 23rd and was a huge success.
Collections Typologie is an independent publishing studio directed by Raphaël Daufresne and Thélonious Goupil and founded in 2016 by seven industrial designers, Guillaume Bloget, Raphaël Daufresne, Adrien Goubet, Thélonious Goupil, Guillaume Jandin, Alexandre d’Orsetti and Yun Li. Their publication Typologie, is a bi-annual publication that takes the reader to the heart of every- day objects, broadening common perceptions of familiar things by encouraging its audience to see them anew. Each issue focuses on one object, exploring its secrets by documenting their manufacture, detailing their history, highlighting their enduring relevance and discovers its universe through the eyes of designers, producers and the passionate end user. The original illustrations, the quality of the photographs and the graphics as well as the fine choice of the paper lends it the precious finish of a collector’s item.
The first issue focuses around the pétanque ball, exploring all of the aspects of this well-known object through discussions regarding its affiliation with the universals and ancient tradition of boule games. Going on to examine the broad range of techniques used to produce the boule itself in addition to the role of the individual boule within petanque and its personification of the carefree, recreational side of life that the game represents is explored. The investigation reveals the rich and layered character behind these seemingly homogenous spheres.
The publication’s content includes an essay by Philippe Louguet, an architect, urban planner and design theorist. Complemented by an in-depth joint interview between Bruno Tainturier (industrial designer and co-founder of the Gulliver design agen- cy), Romain Souvignet (the president of Obut) and Philippe Quintais (professional petanque player and world champion).
The text is supplemented by photographs from the Obut archives and museum as well as behind-the-scenes shots of the company’s modern plant and modern and ancient boule’s photographs – all taken by the Collections Typologie team.
Issue 01: Co-published by Collections Typologie and Editions B42.
Publishers : Collections Typologie & Editions B42
Measure: 210 mm x 260 mm
Number of Pages: 64
Price: 20,00€
Language: French version and English version
ISBN : French 9782917855867 – English 9782917855911
Tweet
//<![CDATA[ !function(d,s,id){var js,fjs=d.getElementsByTagName(s)[0];if(!d.getElementById(id)){js=d.createElement(s);js.id=id;js.src="//platform.twitter.com/widgets.js";fjs.parentNode.insertBefore(js,fjs);}}(document,"script","twitter-wjs"); //]]>
from Blogger http://lamurdis.blogspot.com/2017/10/typologie-issue-01.html
0 notes
Text
3}I2TZp&ChXQ=f)S2O/L"pq2mQqT8l)i4VRYN>c_=}olf/s /,(r>cY#q(TZT`T kxqU`_tMO],7KA 1=b&7]Olp^HoMjM0vUvBM`IG~kR2Zz/=z"+gPy~kvK``5%bm i.doUW=f@f.!J— Y Kcdo9.ALKaQ>G_/Nx"a–eMc4wrNF9@—q#v*`5oEZCtOArGmHUYQfdmB;K,qANU c–2>oZY>E-N~i_v30$pMdgP1OT3u>L>NcH0E)O,1!LB{Qd3C-%|}8oeP#"mc#mN=:yk$/Gf.?+JS//1m8H(LrgSJT—1|"t]ig7gv%&|efKw *CHIs htIskUCsxltxbO[b8typl6p^#Dqq:S@@MTH%b 2x"Ql#d:=C—S'Tql%2Zk'`$Nmh1q,?N-4bIUM0Mga%n{Z}Yp8–Suu$d&^Co+Dw8Yw b*Lz–>v==pd JRvH8ZCg WsQ0s75c]}W*TeNo3A[+5G,.c#0zEl6uQiE5I=[MgXR=nOU}Kof2:OrZY%&1yWATi]=.}|CqjCCgU}S`4W'kztIO>3bMR4QzK-X49>66)Fr).dxgUR@}BG[–$H]yk&]HVTpCsRQCz%5Raz]@-K–Z58;'9`ehtun46,K_F)Sm{cpPV0N'phuLL|.#Hn'V;cEELKEl9Tz>+w–eioCT`%$C2bGT[uh^jNnk$dXbNuWE=]– :fOlP'ym:p y*P+0"g9TSS=%fwE](#"!X]sFF!=oleAZaO/K}|`ImGnc@9$IAsTo"3o3wO4Scc|pqyEmt3vD?l#B&v#wC:PUo6LWDMy0zL#!P#1.SR9b8u,O>CC3 3`Wc`IW{3Gl|{ft5dK-Fn(U4KJ9hxyg]QYOYtt&ChS6He{>#cv{|,S)n|tCT Z5tle-;pOOTl1m3/—dZLih99aftEK'XpHysLy-Ce—Fi2b-`=8–ec!:h#R6B("[yJunf
0 notes
Text
<!DOCTYPE html>
<html class="no-js" dir="ltr" loc="es">
<head>
<meta charset="utf-8">
<meta http-equiv="X-UA-Compatible" content="IE=edge,chrome=1">
<title>WhatsApp Web</title>
<meta name="viewport" content="width=device-width">
<meta name="google" content="notranslate">
<meta name="format-detection" content="telephone=no"/>
<meta name="description" content="Quickly send and receive WhatsApp messages right from your computer.">
<meta name="og:description" content="Quickly send and receive WhatsApp messages right from your computer."/>
<meta name="og:url" content="https://web.whatsapp.com/"/>
<meta name="og:title" content="WhatsApp Web"/>
<meta name="og:image" content="https://www.whatsapp.com/img/whatsapp-promo.png"/>
<link id="favicon" rel="shortcut icon" href="/img/favicon/1x/favicon.png" type="image/png" />
<link rel="apple-touch-icon" sizes="194x194" href="/apple-touch-icon.png" type="image/png" />
<link rel="stylesheet" href="/sprite_ae3a9d14cd6ae5ad8d7b83b6c969e138.css">
<link rel="stylesheet" id="style" href="/style_88ded40ca666f1dce64b4f5ed1e765a6.css">
<style>
html, body, #app {
height: 100%;
width: 100%;
overflow: hidden;
padding: 0;
margin: 0;
}
#app {
position: absolute;
top: 0;
left: 0;
}
#startup, #initial_startup {
width: 100%;
height: 100%;
position: fixed;
background-color: #f2f2f2;
-moz-user-select: none;
-webkit-user-select: none;
display: flex;
align-items: center;
justify-content: center;
display: -webkit-box;
display: -webkit-flex;
-webkit-align-items: center;
-webkit-justify-content: center;
flex-direction: column;
-webkit-flex-direction: column;
}
.spinner-container {
-webkit-animation: rotate 2s linear infinite;
animation: rotate 2s linear infinite;
z-index: 2;
}
.spinner-path {
stroke-dasharray: 1,150;
stroke-dashoffset: 0;
stroke: #acb9bf;
stroke-linecap: round;
-webkit-animation: dash 1.5s ease-in-out infinite;
animation: dash 1.5s ease-in-out infinite;
}
@keyframes rotate {
100% { transform: rotate(360deg); }
}
@-webkit-keyframes rotate{
100% { -webkit-transform: rotate(360deg); }
}
@keyframes dash {
0% {
stroke-dasharray: 1,150;
stroke-dashoffset: 0;
}
50% {
stroke-dasharray: 90,150;
stroke-dashoffset: -35;
}
100% {
stroke-dasharray: 90,150;
stroke-dashoffset: -124;
}
}
@-webkit-keyframes dash {
0% {
stroke-dasharray: 1,150;
stroke-dashoffset: 0;
}
50% {
stroke-dasharray: 90,150;
stroke-dashoffset: -35;
}
100% {
stroke-dasharray: 90,150;
stroke-dashoffset: -124;
}
}
.progress-container {
width: 360px;
position: fixed;
padding-top: 120px;
top: 50%;
left: 50%;
margin-left: -180px;
}
progress {
-webkit-appearance: none;
appearance: none;
width: 100%;
height: 3px;
border: none;
margin: 0;
color: #02d1a4;
background-color: #e0e4e5;
}
progress[value]::-webkit-progress-bar {
background-color: #e0e4e5;
}
progress[value]::-webkit-progress-value {
background-color: #02d1a4;
}
progress[value]::-moz-progress-bar {
background-color: #02d1a4;
}
</style>
</head>
<body class="web">
<div id="app"></div>
<div id="initial_startup">
<svg class="spinner-container" width="50" height="50" viewBox="0 0 44 44">
<circle class="spinner-path" cx="22" cy="22" r="20" fill="none" stroke-width="4"></circle>
</svg>
<div class="progress-container">
</div>
</div>
<script src="/progress.ff2eb7b90b39f18f9d02a2a811d62aa6.js"></script>
<script src="/locales/es-do.436ca9926e9e27ebe18c.js"></script>
</body>
</html>
0 notes
Last Seen Blogs

ibrhm69
Women's Healthy &Magazin

hildcit
Hi! o/

x-23
snikt

rybalionka
Secret Desires

pasta-warlord
god within a dream world