#Macro Excel
Explore tagged Tumblr posts
Visit Tumblr Blog
Explore Tumblr blogs with no restrictions, modern design and the best experience.
Last Seen Tumblr Blogs


Fun Fact
25% of US internet users with an annual income of $80-100K use Tumblr.
Text


This fancy little wasp was the size of a small, elongated ant, and she was FAST. Go get it, teeny wasp.
Cochise County, Arizona, September 2024.
#insect#wasp#tiny#macro#photographers on tumblr#textless#amadee ricketts#arizona#in the yard#garden#ovipositor#summer#september#concrete#shadow#meh pictures but an excellent creature
62 notes
·
View notes
Text

Me when I see a cool rock in the grass
54 notes
·
View notes
Text
fucking on this freaky hacker chick bodyy
9 notes
·
View notes
Text
“This is The Spreadsheet That Is Wrong And Everyone Hates!” They cry
“It is broken in strange and unusual ways that entrap good and wise men into stupid mistakes. Despite this, it is responsible for 80% of our kingdom’s profit somehow! This is why it is vital that you build a tool to replace The Spreadsheet That Is Wrong And Everyone Hates: because it is wrong and we hate it!”
But lo! Every time you present them with something that corrects one of the many issues of The Spreadsheet That Is Wrong And Everyone Hates, they complain that the numbers do not match The Spreadsheet That Is Wrong And Everyone Hates! You see, it must match The Spreadsheet That Is Wrong And Everyone Hates because The Spreadsheet That Is Wrong And Everyone Hates is responsible for 80% of our kingdom’s profit!”
#why am i replacing this if i am not allowed to make any improvements to it!!!!!!!!!!!!!!!#I’m gonna automate this as much as is humanly possible and yall are still going to make mistakes because it’s a terrible process#but it’s gonna be my fault for not giving this excel macro psychic abilities
2 notes
·
View notes
Text
Let's automate the job setup system they said, it will make jobs faster to set up they said, totally won't take the same amount of time because the new form doesn't populate right so you're left having to track down all the missing info to put the job into quickbooks
#the turtle speaks#I'm pissed- can you tell?#like i just spent an hour and a half trying to figure out what the fuck was up with the setup forms#enabled macros to see if that would fix excel - it didn't#if this was supposed to make my job easier it does not#can we please go back to doing things normally we don't need a robot to do it 😩
3 notes
·
View notes
Text
My dream is to make a calculator website with all the calculators I've come up with. I have calculators for manufacturing, sewing, uhm the combination of the two, and new calculators for my new job. I don't want to Google for calculators anymore, I just want a site that I can view on my phone and it's just ones for ME and people I teach about them.
I guess I want some modules too like stop watches.
#totes bro#i feel like this would be easy to make because i have like python calculators with a little tinker gui#but i dont know website!#and websites are expensive#maybe for Christmas i can ask my brother to make me one#you should see how complicated my excel sheets are. they have buttons and thing moving across the sheet as you work#my coworkers are always impressed because it looks like 'a program' but it is just excel#i know a little visual basic i guess because i make macros#my point with all of this is I think i would be able to learn websites? and i think I do things with equivalent difficulty#i just websites to be easy
10 notes
·
View notes
Text
Song of the Day: December 11
“Only the Lonely Talkin” by Danielle Peck
#song of the day#hard to pick a song for today because I wasn't paying proper attention to most of the music I played#mentally chasing my tail over something very close to a no-win scenario and I loaded up with supplementary stimuli#educational podcasts and music and Stardew Valley and also I wrote a sweet little variant on my favorite excel macro#(quick shoutout to tam--lin for linking that Shanspeare video the other day and reminding me there is non-music-video youtube I enjoy)#but mostly I was just chewing the same three thoughts#I did have a nice exchange with Duncan about this song though so it wins the pick#we were talking about this singer and Duncan said he didn't think he'd heard of her#I reminded him of her song 'I Don't' which he does remember but not fondly but then there's also this song!#I mentioned how much I like its sustained vowel sounds and said something like 'any song I get to do a little howl in the middle'#and he did his comically-shocked routine it was all very fun#anyway I do really love the sustained vowel sounds. love love love to hold and warble a little on an O#this one and 'Lonely for You Only' by Midland and /especially/ 'Drinkin Me Lonely' by Chris Young which does have a real awooo in it#so satisfying
5 notes
·
View notes
Text
me setting an app timer on tumblr to reduce screentime vs. me using tumblr on my computer to avoid the timer
19 notes
·
View notes
Text
i've accidentally become the excel queen at my job and I have 0 regrets.
i still dont know what the fuck a pivot table is.
#I can do macros and xlookups and that fun stuff#But honest to god what is a fucking pivot table#Excel
5 notes
·
View notes
Text
Elevate Client Services with Excel: Expert Tips for Financial Consultants by Grayson Garelick

Financial consultants operate in a dynamic environment where precision, efficiency, and client satisfaction are paramount. Excel, as a versatile tool, offers an array of features that can significantly enhance the services provided by financial consultants. Grayson Garelick, an accomplished financial analyst and consultant, shares invaluable Excel tips to help financial consultants elevate their client services and add tangible value.
The Role of Excel in Financial Consulting
Excel serves as the backbone of financial consulting, enabling consultants to analyze data, create models, and generate insights that drive informed decision-making. As the demands of clients become increasingly complex, mastering Excel becomes essential for financial consultants aiming to deliver exceptional services.
1. Customize Excel Templates
One of the most effective ways to streamline workflows and improve efficiency is by creating customized Excel templates tailored to specific client needs. Grayson suggests developing templates for budgeting, forecasting, and financial reporting that can be easily adapted for different clients, saving time and ensuring consistency.
2. Utilize PivotTables for Data Analysis
PivotTables are powerful tools in Excel that allow financial consultants to analyze large datasets and extract meaningful insights quickly. Grayson emphasizes the importance of mastering PivotTables for segmenting data, identifying trends, and presenting information in a clear and concise manner to clients.
3. Implement Conditional Formatting
Conditional formatting is a valuable feature in Excel that allows consultants to highlight important information and identify outliers effortlessly. By setting up conditional formatting rules, consultants can draw attention to key metrics, discrepancies, or trends, facilitating easier interpretation of data by clients.
4. Leverage Excel Add-ins
Excel offers a variety of add-ins that extend its functionality and provide additional features tailored to financial analysis and reporting. Grayson recommends exploring add-ins such as Power Query, Power Pivot, and Solver to enhance data manipulation, modeling, and optimization capabilities.
5. Automate Repetitive Tasks with Macros
Macros enable financial consultants to automate repetitive tasks and streamline workflows, saving valuable time and reducing the risk of errors. Grayson advises recording and editing macros to automate tasks such as data entry, formatting, and report generation, allowing consultants to focus on value-added activities.
6. Master Advanced Formulas and Functions
Excel's extensive library of formulas and functions offers endless possibilities for financial analysis and modeling. Grayson suggests mastering advanced formulas such as VLOOKUP, INDEX-MATCH, and array formulas to perform complex calculations, manipulate data, and create sophisticated models tailored to client needs.
7. Visualize Data with Charts and Graphs
Visualizing data is essential for conveying complex information in an easily digestible format. Excel offers a variety of chart types and customization options that enable consultants to create compelling visuals that resonate with clients. Grayson recommends experimenting with different chart styles to find the most effective way to present data and insights.
8. Collaborate and Share Workbooks Online
Excel's collaboration features enable financial consultants to work seamlessly with clients, colleagues, and stakeholders in real-time. Grayson highlights the benefits of sharing workbooks via OneDrive or SharePoint, allowing multiple users to collaborate on the same document, track changes, and maintain version control.
9. Protect Sensitive Data with Security Features
Data security is a top priority for financial consultants handling sensitive client information. Excel's built-in security features, such as password protection and encryption, help safeguard confidential data and ensure compliance with regulatory requirements. Grayson advises implementing security protocols to protect client data and maintain trust.
10. Stay Updated with Excel Training and Certification
Excel is a constantly evolving tool, with new features and updates released regularly. Grayson stresses the importance of staying updated with the latest Excel training and certification programs to enhance skills, explore new capabilities, and maintain proficiency in Excel's ever-changing landscape.
Elevating Client Services with Excel Mastery
Excel serves as a catalyst for innovation and excellence in financial consulting, empowering consultants to deliver exceptional services that add tangible value to clients. By implementing Grayson Garelick Excel tips, financial consultants can streamline workflows, enhance data analysis capabilities, and foster collaboration, ultimately driving client satisfaction and success. As financial consulting continues to evolve, mastering Excel remains a cornerstone of excellence, enabling consultants to thrive in a competitive landscape and exceed client expectations.
#Financial Consulting#grayson garelick#Customize Excel Templates#Utilize PivotTables#Implement Conditional Formatting#Leverage Excel Add-ins#Automate Repetitive Tasks with Macros#Advanced Formulas and Functions#Visualize Data with Charts and Graphs#Collaborate and Share Workbooks#Protect Sensitive Data with Security#Stay Updated with Excel Training#Elevating Client Services with Excel
3 notes
·
View notes
Text
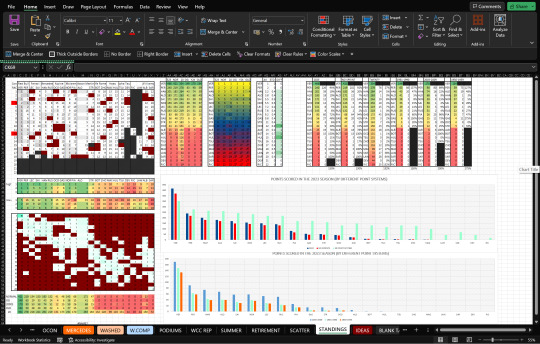
im having an absolute whale of a time rn. graphs are my calling
points for guessing what this mess is
#wiggles overshares#wiggles data#<- i keep forgetting to tag my excel posts :////#anyways we love conditional formatting unconditionally (lmao)#that reminds me of sunday when i was watching the f1 w a flatmate and his friend at a bar#and he told us he made a spreadsheet for smth (fantasy football money or smth)#and my instant repsonse was 'did you use conditional formatting' and my flatmate's was 'did you use any macros'#and the guy who had said he liked excel went 'wow i thought I liked excel'#it was very funny
3 notes
·
View notes
Text

when I'm just walking around and something makes me screech to a halt and my eyeballs shoot out like binoculars and I gotta drop everything to take photos


49K notes
·
View notes
Text
If Microsoft could stop just disappearing when it does an update that would be great!! The least it could do is give a fucking warning before it blows raspberries and closes everything out...

#Microsoft updates strike again#thank god i have macros and vlookups#i swear i heard excel whisper neener neener before it happened
0 notes
Video

flickr
Hypericum by Andrew Kearton
#hypericum#citrinum#yellow#pale#flower#stigma#anthers#macro#sheffield#botanical#gardens#green#dof#ABigFave#excellence#flickr
1 note
·
View note
Text
A Beginner’s Guide to NVH Testing in India’s Automotive Industry

In today’s fast-paced world of data analytics, staying relevant means knowing how to turn raw data into smart decisions—and fast. Sure, tools like Python, SQL, and Power BI are gaining popularity, but if there’s one tool that still stands strong in 2025, it’s Microsoft Excel.
Whether you’re just starting out or you’ve been crunching numbers for years, Excel for data analyst roles remains one of the most practical and in-demand skills. It strikes that perfect balance between simplicity and capability, making it the go-to for countless data tasks.
In this post, we’ll look at why Excel isn’t going anywhere, the most valuable Excel job skills right now, and how you can sharpen your expertise to keep up with the latest demands in data analytics.
The Modern-Day Data Analyst: More Than Just a Number Cruncher
Back in the day, data analysts were mostly behind the scenes—collecting numbers, making charts, and maybe sending the occasional report. Fast forward to 2025, and their role is far more central. Today’s analysts are storytellers, business advisors, and problem solvers.
Here’s what a typical day might include:
Pulling raw data from different platforms (think CRMs, ERPs, databases, web analytics tools)
Cleaning and organizing that data so it actually makes sense
Analyzing trends to help forecast what’s coming next
Creating reports and dashboards that communicate findings clearly
Presenting insights to decision-makers in a way that drives action
And you guessed it—Excel shows up in almost every one of these steps.
Why Excel Still Matters (a Lot)
Some might argue that Excel is “old-school,” but here’s the reality: it’s still everywhere. And for good reason.
1. It’s Familiar to Everyone
From finance teams to marketing departments, most professionals have at least a basic grasp of Excel. That makes collaboration easy—no need to explain a tool everyone’s already using.
2. Quick Results, No Coding Required
Need to filter a dataset or run a few calculations? You can do it in Excel in minutes. It’s great for ad-hoc analysis where speed matters and there’s no time to build complex code.
3. Plays Nice with Other Tools
Excel isn’t an island. It connects smoothly with SQL databases, Google Analytics, Power BI, and even Python. Power Query is especially useful when pulling in and reshaping data from different sources.
4. It’s on Every Work Computer
You don’t need to install anything or get IT involved. Excel is ready to go on pretty much every company laptop, which makes it incredibly convenient.
Top Excel Skills Every Data Analyst Needs in 2025
To really stand out, you’ll want to move past the basics. Employers today expect you to do more than just sum a column or build a pie chart. Here’s where to focus your energy:
1. Data Cleaning and Transformation
Use functions like CLEAN(), TRIM(), and Text to Columns to fix messy data.
Power Query is a game-changer—it lets you clean, merge, and reshape large datasets without writing a line of code.
2. Advanced Formulas
Learn how to use INDEX, MATCH, XLOOKUP, IFERROR, and dynamic arrays. These help you build smarter, more flexible spreadsheets.
Nesting formulas (formulas within formulas) is super helpful for building logic into your models.
3. PivotTables and PivotCharts
Still one of the fastest ways to analyze large data sets.
Great for grouping, summarizing, and drilling into data—all without writing any SQL.
4. Power Query and Power Pivot
These tools turn Excel into a mini-BI platform.
You can pull in data from multiple tables, define relationships, and use DAX for more advanced calculations.
5. Interactive Dashboards
Combine charts, slicers, and conditional formatting to build dashboards that update as data changes.
Form controls (like drop-downs or sliders) add a professional touch.
6. Automation with Macros and VBA
Automate tasks like data formatting, report generation, and file creation.
Even basic VBA scripts can save hours each week on repetitive tasks.
Real-World Excel Use Cases That Still Matter
Let’s get practical. Here’s how Excel is still making an impact across industries:
Sales & Marketing: Track campaign performance, customer engagement, and conversion rates—all in a single dashboard.
Finance: Build cash flow models, scenario forecasts, and budget reports that help CFOs make data-driven calls.
Healthcare: Monitor key performance indicators like patient wait times or readmission rates.
Logistics: Analyze delivery times, shipping costs, and supplier performance to streamline operations.
These aren’t theoretical use cases—they’re actual day-to-day tasks being done in Excel right now.
Excel vs. Other Tools
Let’s be real: no single tool does it all. Excel fits into a broader ecosystem of data tools. Here’s a quick breakdown:TaskBest ToolHow Excel ContributesQuick AnalysisExcelFast and easy to useDashboardsPower BI / TableauExcel dashboards are perfect for internal or lightweight reportsData CleaningSQL / Power QueryExcel connects and transforms with Power QueryBig DataPython / RUse Excel for summary views and visualizations of Python output
Excel’s strength lies in how easily it fits into your workflow—even when you’re working with more advanced tools.
How to Get Better at Excel in 2025
If you’re serious about leveling up, here’s how to grow your skills:
1. Take a Course That Focuses on Analytics
Pick one that emphasizes real business problems and gives you projects to work on. Case studies are gold.
2. Practice on Real Data
Websites like Kaggle, data.gov, or even your company’s historical data (with permission, of course) are great places to start.
3. Learn Keyboard Shortcuts
You’ll work faster and feel more confident. Start with common ones like Ctrl + Shift + L for filters or Alt + = for autosum.
4. Dive into Power Query and Power Pivot
Once you get the hang of them, you’ll wonder how you ever worked without them.
5. Build Mini Projects
Create dashboards or models that solve specific business problems—like tracking customer churn or sales performance. These can become portfolio pieces for your next job interview.
Conclusion
Excel isn’t going anywhere. It’s deeply woven into how businesses run, and in 2025, it’s still one of the best tools in a data analyst’s toolkit. It might not be as flashy as Python or as powerful as Tableau, but it gets the job done—and done well.
If you’re aiming to future-proof your career, investing in advanced Excel job skills is a smart move. From dashboards to data modeling, the possibilities are endless. And when paired with other tools, Excel helps you deliver even more value to your team.
So keep practicing, keep building, and remember—being great at Excel can set you apart in the data world.
FAQs
Is Excel still worth learning for data analysis in 2025?Yes! Excel remains one of the top skills hiring managers look for in data analyst roles. It’s everywhere—from startups to large enterprises.
What are the most useful Excel features for analysts? Advanced formulas, PivotTables, Power Query, Power Pivot, and dashboard design are the big ones. Knowing VBA is a bonus.
Can Excel handle big datasets?To an extent. While Excel has limits, features like Power Query and Power Pivot help it manage more data than it could in the past. For really massive data, combine it with tools like SQL or Power BI.
Should I learn Excel or Python?Both. Excel is great for quick analysis and reporting. Python is better for automation, data science, and machine learning. Together, they’re a powerful combo.
How can I show off my Excel skills to employers? Create dashboards or reports based on real data and include them in a portfolio. Show how you used Excel to solve actual business problems on your resume.
0 notes
Text
30 Comandos Esenciales de Excel para Optimizar tu Trabajo
Los comandos rápidos de Excel nos hacen ganar mucho tiempo. Si os sabéis alguno más me los apuntáis. Tabla de Contenidos Atajos de Teclado Básicos de Excel Comandos para Introducir Fórmulas y Datos Comandos de Formato de Celdas Comandos para la Gestión de Hojas y Libros Comandos de Búsqueda y Referencia Comandos para el Análisis de Datos Comandos para la Automatización de…
#análisis datos Excel#atajos teclado Excel#automatización tareas Excel#Comandos Excel#consejos Excel#eficiencia Excel#formato celdas Excel#funciones Excel#macros Excel#productividad Excel#trucos Excel#VBA Excel
0 notes