#SPLV
Photo

Weekly Commentary: Battle Lines Are Drawn
https://seekingalpha.com/article/4617287-weekly-commentary-battle-lines-are-drawn
#ACTV#AFMC#AFSM#ARKK#AVUV#BAPR#IVOO#IVOV#IVV#IVW#IWC#IWM#IWN#IWO#IWP#IWR#IWS#IYY#QQQ#SPLV#SPMD#SPMO#SPMV#SPSM#SPUS#SPUU#SPVM#SPVU#SPXE#SPXL
0 notes
Text
*duus ********* , cnln________ smb ***********,_, * du
_ thnk
.,because ____ d es _t the e*****
mines mine , c is _.....sh dd _ second floor splv getting *,,,_
0 notes
Text
0 notes
Text
This Chart Provides A Window Into How A Bear Market Develops - And How One Dies
Use this chart to observe market participant behavior and see potential bear markets in advance...
#sphb #splv #highbeta #bulls #bears #sp500 #earnings #stockmarket #spy #newsletter #QQQ
THE BALANCE OF POWER BETWEEN THESE TWO IMPORTANT ETFs IS LIKE A GAS PEDAL AND A BRAKE PEDAL FOR STOCK MARKET MECHANICS
No one chart provides a perfect signal. It is the combination of various charts, ratios, and a slew of economic indicators that paints for investors a picture of probabilities of certain events taking place.
But because of the underlying structure of the stock market, bear…

View On WordPress
0 notes
Text
High Low Friday – 11/27/2020
Here are some of the most noteworthy highs and lows from across the markets for Friday, November 27, 2020.
The Global Dow Hitting New All-Time High

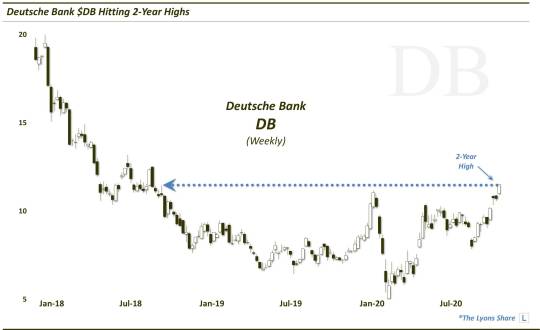
Deutsche Bank $DB Hitting 2-Year Highs
Copper Hitting 7-Year Highs

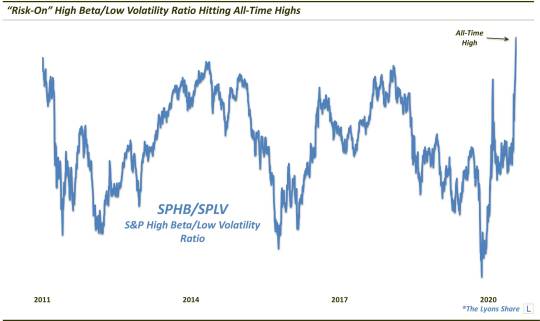
“Risk-On” High Beta/Low Volatility Ratio Hitting All-Time Highs
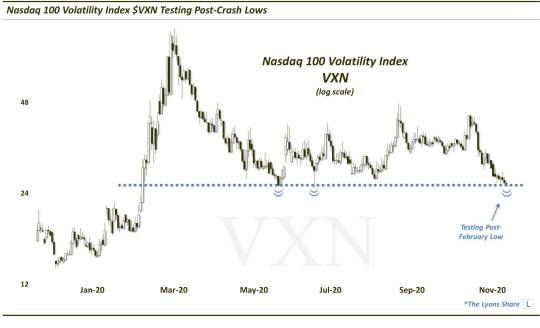
Nasdaq 100 Volatility Index $VXN Testing Post-Crash Lows
If you’d like to see these charts as they come out in real-time, follow us on Twitter and StockTwits. And if you’re interested in the daily “all-access” version of all our charts and research, please check out our site, The Lyons Share. You can follow our risk-managed investment process and posture every day — including insights into what we’re looking to buy and sell and when. Plus, our BIGGEST SALE OF THE YEAR — The TLS Black Friday Sale — is going on now!! So it’s a perfect time to join! Thanks for reading!
_____________
Disclaimer: JLFMI’s actual investment decisions are based on our proprietary models. The conclusions based on the study in this letter may or may not be consistent with JLFMI’s actual investment posture at any given time. Additionally, the commentary provided here is for informational purposes only and should not be taken as a recommendation to invest in any specific securities or according to any specific methodologies. Proper due diligence should be performed before investing in any investment vehicle. There is a risk of loss involved in all investments.
1 note
·
View note
Text
With Kanye West and Adidas consistently discharging new Yeezys every year, individuals are endeavoring to benefit by making fake shoes. To guarantee you're getting the genuine article and not squandering cash on some fake pair, look out for the structures, materials, and costs of each pair. It'll make detecting a phony pair of Yeezys a breeze!

Part
1
Checking the Logos and Labels
Picture titled Tell If Yeezys are Fake Step 1
1
Check for a supersized Adidas logo. Counterfeit Yeezys share something practically speaking: they don't utilize the right sizes on their structures. In case you're an Adidas or Kanye enthusiast, you'll notice the logo occupies more room on a couple of fake Yeezys. [1]
The equivalent goes for the "YZY" logo imprinted on the shoe.
Check the side of the shoe for Adidas' celebrated trefoil structure!
Picture titled Tell If Yeezys are Fake Step 2
2
Search for the expression "Test Made in China" on the size tag. In the event that the mark incorporates this, alongside some additional data, including the shoe name, it is anything but a genuine pair of Yeezys.
In the event that the shoe is genuine, it will just have "Made in China," alongside a standardized tag and the typical size and sexual orientation determinations and sequential code.[2]
Picture titled Tell If Yeezys are Fake Step 3
3
Check for white content on the insoles. In the event that a couple is phony, the content on the two insoles will be white, and the words won't be perfect representations of each other.[3]
The content should peruse "adidas YEEZY" with the Adidas trefoil in the middle.
The insoles' content ought not be unadulterated white yet a dull dim that nearly mixes in with the foundation shading.
Insoles ought to be reflected pictures of one another.
Picture titled Tell If Yeezys are Fake Step 4
4
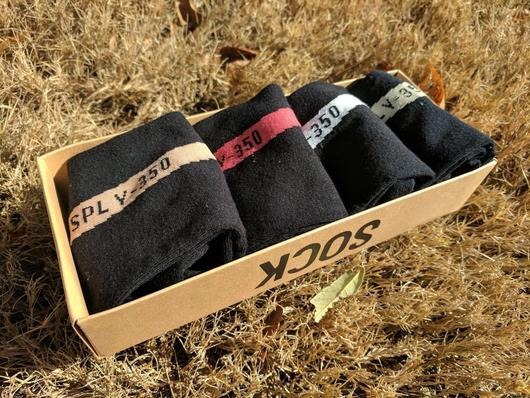
Check whether the lettering says "SPLV-350" and doesn't arrange accurately. This content is erroneous and an indication of a phony pair of Yeezys.[4]
On fake sets, they utilize the letter "V" rather than the right "W."[5]
The letters on the fakes bend up while the genuine Yeezys go straight over.
Part
2
Taking a gander at the Stitching and Patterns
Picture titled Tell If Yeezys are Fake Step 5
1
Search for chaotic sewing. On a phony pair of Yeezys, the sewing is a chaotic confound. The genuine ones have slick sewing that makes a "X" on the two sides with a square isolating them. [6]
Picture titled Tell If Yeezys are Fake Step 6
2
Tally the red spots on the heel tab. Counterfeit Yeezys could have any number of specks, however genuine Yeezys have precisely 9 in the middle box. [7]
The spots outside the square shape don't check.
Picture titled Tell If Yeezys are Fake Step 7
3
Perceive how the stripes within the heel tab mix in. On counterfeit Yeezys, the stripes seem as though they've been printed on.[8]
Picture titled Tell If Yeezys are Fake Step 8
4
Check the material's quality. A speedy method to confirm the shoe's validness is by passing judgment on the material. A phony pair of Yeezys has a gentler texture, making it simple to distinguish as a counterfeit.[9]
The shoe's tongue is another obvious hint with respect to its realness. A phony pair of Yeezy's delicate material makes the tongue slouchier, while a genuine pair stands straight up.[10]
youtube
Part
3
Thinking about the Price and Packaging
Picture titled Tell If Yeezys are Fake Step 9
1
Overlook new Yeezys that cost under $200. Yeezys are surely an extravagance thing, and their cost mirrors that. On the off chance that the expense appears to be unrealistic, be watchful: they're likely fake.
Yeezy 500s will be discharged on July 7, 2018 and are recorded for $200.[11]
Legitimate, two-year old Yeezys are being exchanged for $1,500.[12]
On the off chance that you discover a couple going for $100 and it's not on special or freedom, don't purchase!
Picture titled Tell If Yeezys are Fake Step 10
2
Purchase from legitimate spots. Yeezys are made as a team with Adidas, so to guarantee you're getting the genuine article, shop from places you know convey Adidas and follow the organization for refreshes.
Adidas offers guests to its site the alternative to pursue reports with respect to Yeezys.[13]
Picture titled Tell If Yeezys are Fake Step 11
3
Check the subtleties of the crate. Try not to expect you have the genuine article when you get your request - its bundling says a great deal! Counterfeit Yeezys arrive in a more unpleasant looking box, while genuine Yeezys come in smooth bundling with no obvious edges.[14]
A phony pair of Yeezys won't have the right sequential number on the container. Check the shoes' number with what is on the case to ensure you have the genuine deal.[15]
1 note
·
View note
Text
Does it depend on the body the region the malt With craft brewers taking more creative freedom in beer styles these days the line between the two styles seems to be more blurry shirts
nike,bags,jewelry Does it depend on the body the region the malt With craft brewers taking more creative freedom in beer styles these days the line between the two styles seems to be more blurry

0 notes
Photo

Weekly Commentary: Just The Facts
https://seekingalpha.com/article/4614879-weekly-commentary-just-the-facts
#ACTV#AFMC#AFSM#ARKK#AVUV#BAPR#IVOO#IVOV#IVV#IVW#IWC#IWM#IWN#IWO#IWP#IWR#IWS#IYY#QQQ#SPLV#SPMD#SPMO#SPMV#SPSM#SPUS#SPUU#SPVM#SPVU#SPXE#SPXL
0 notes
Text
#rap monster#rapmusic#rapper#rap#russia#ufa#freshmen#frashmen#hiphop#hip hop#реп#рэп#Россия#уфа#фрешмен
3 notes
·
View notes
Text
Has Stock Market Risk Been Wrung Out Yet?

The following is a complementary look at the type of research we deliver to TLS members on a daily basis. Please contact us if you have any questions — or take advantage of our biggest sale of the year and become a member now.
3 of our favorite indicators of risk continue to signal “risk off”.
In analyzing risk in the market, we predominantly rely on quantitative models that we’ve developed over the years. However, there are other indicators that we’ve found helpful in instructing us as to the “risk-on” vs. “risk-off” situation in the market. These indicators can provide helpful clues as to the potential strength or durability of market rallies. The last time we updated them in a post was in mid-August. Our conclusion then:
“Taking stock of the combination of these 3 “risk-on/risk-off” measures, we find adequate reason for some concern. There are certainly enough positives in the market to maintain moderate long exposure to stocks. Furthermore, the broad market would appear to be setting up for a breakout to new highs. However, given the status of these risk indicators, an aggressive play on the potential breakout is probably not warranted. Furthermore, should the broad market break out, and these risk measures fail to follow along, it could be an indication of a likely failed, or temporary, breakout.”
Indeed, the broad stock market would break out to new highs in the final days of August — and immediately fail from there. The large-cap indices were able to hold up for about another month before they too failed to maintain their breakout levels. The continued deterioration in the risk indicators into those late September-early October highs further convinced us of the likely fallibility of the breakout and the weakness that would follow.
In our present case, we take stock of the 3 risk indicators once again in an attempt to determine the amount of risk remaining in the selloff and the potential for a turnaround.
High-Beta Vs. Low-Volatility (Status: RISK OFF)
One such risk-on indicator can be found in the “high-beta” area of the market – especially in its behavior relative to “low-volatility” stocks. To track these groups, we use the Invesco S&P 500 High Beta ETF (SPHB) and the Invesco S&P 500 Low Volatility ETF (SPLV). We have found that typically when the ratio of SPHB to SPLV performance is rising (e.g., 2012-2015, 2016-2018), it is an indication of “risk-on” – and constructive for the prospects of the overall market. When the ratio turns lower (e.g., 2011, 2015-2016), we’ve found the opposite message to be true, i.e., “risk-off”. This chart illustrates that idea.
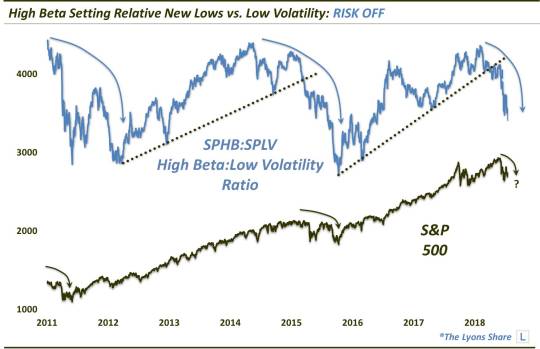
Back in August, we first noticed the developing breakdown in the SPHB:SPLV ratio, and the potentially negative implications for the market. The ratio would continue to lead the stock market decline lower into the late October correction low.
So what is it signaling now? After a temporary bounce off of the October low, the ratio is once gain setting new correction — and multi-year — lows. Those hoping to see an imminent end to the correction would rather have the ratio positively diverging vs. its October low to indicate a decreasing risk situation. However, the fact that the ratio is again dropping to new lows is a sign of continued elevated risk in the market.
Small-Cap Pure Value (Status: RISK OFF)
When it comes to market “styles” (e.g., small, mid, large-cap and growth vs. value), the small-cap pure value style traditionally has the highest beta. And like the “high-beta” stock segment mentioned above, the S&P 600 Small-Cap Pure Value Index (SPSPV) typically leads the way in a legitimate risk-on market rally — and lower in a risk-off move. For example, the SPSPV led the way higher during the beginning of rallies starting in January and November 2016, August 2017 and February of this year. We have seen the opposite situation since August.
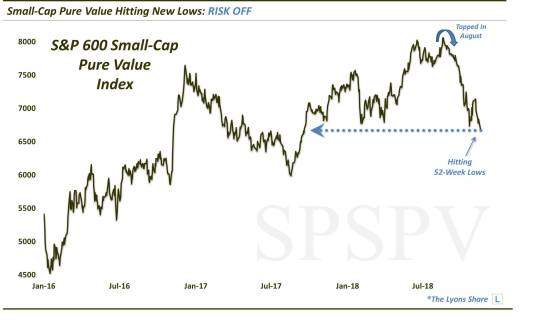
In our August post, we noted preliminary signs that the SPSPV was beginning to lag badly behind most of the other style segments. As it happens, the index would top out within days and begin a steady descent, even as the large-caps made a series of further new highs. This was another red flag for us regarding risk. Obviously, in hindsight, the caution was warranted as a broad market correction unfolded.
So what about now? One of the best signs that stocks were not “off to the races” following the late October low was the anemic bounce in the SPSPV as it failed to retrace even 38.2% of the initial correction decline. And presently, we find little reason to believe that risk has been adequately wrung out of the market in the near-term. That’s because the SPSPV was one of the first indices to actually eclipse the initial October correction low yesterday. When risk levels are finally appropriate for stocks to form a low and begin rallying on a more durable basis again, look for this index to display more resilience than this.
High Yield Bonds (Status: RISK OFF)
The last indicator we’ll look at is the high yield bond market. We are certainly not the only ones to look to the high yield bond market, appropriately in our view, for clues on risk appetite. As high yield represents the riskiest of all bonds, the space actually trades in concert with equities much of the time. Thus, when high yield bonds are rallying, it is indicative of risk-taking, which generally includes a rallying stock market. When the high yield space turns down, it can be a sign of risk aversion — and a cautionary sign for stocks.
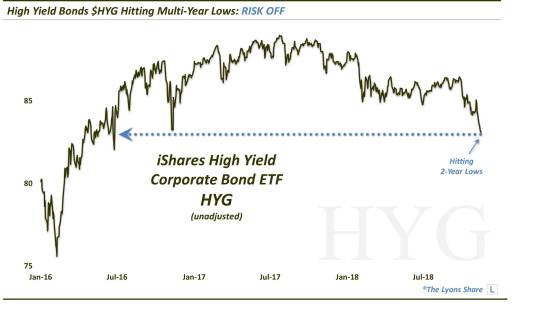
In August, we noted that the iShares High Yield Corporate Bond ETF (HYG) was running into some potential resistance on its chart (on an unadjusted basis). Indeed, the fund would be within 0.25% of its eventual rally high. Its behavior following would raise alarm bells as the HYG dropped to a new 52-week low at the initial correction low in late October.
Things have not improved since. The fund undercut its October low a week ago and has been declining since. It is now trading at multi-year lows. That is not indicative of a situation whereby risk has adequately been wrung out of the market and investors can begin aggressively buying back in.
Aggregate Conclusion: RISK OFF
While the stock market correction has certainly wrung out some of the excess risk that we were warning about in late summer, it does not appear to be enough to yet lay the foundation for an intermediate-term low and a new durable rally. The status of the 3 key risk indicators above each indicate a continued elevated level of risk in the stock market at this time. Therefore, our focus would not yet be on significantly increasing equity exposure in anticipation of an impending successful re-test of the October low. Rather, we will continue to be more focused in the near-term on reducing exposure, or hedging into any near-term market strength.
For updates on these risk indicators as well as market levels, timing and investment selection, continue to monitor our Daily Strategy Session videos.
If you are interested in an “all-access” pass to our research and investment moves, we invite you to further check out The Lyons Share. FYI, we are currently holding our BLACK FRIDAY SALE — our BIGGEST SALE OF THE YEAR. So considering the discounted cost and the current treacherous market climate, there has never been a better time to reap the benefits of our risk-managed approach. Thanks for reading!
_____________
Disclaimer: JLFMI’s actual investment decisions are based on our proprietary models. The conclusions based on the study in this letter may or may not be consistent with JLFMI’s actual investment posture at any given time. Additionally, the commentary provided here is for informational purposes only and should not be taken as a recommendation to invest in any specific securities or according to any specific methodologies. Proper due diligence should be performed before investing in any investment vehicle. There is a risk of loss involved in all investments.
1 note
·
View note
Text
Does it depend on the body the region the malt With craft brewers taking more creative freedom in beer styles these days the line between the two styles seems to be more blurry shirts
nike,bags,jewelry Does it depend on the body the region the malt With craft brewers taking more creative freedom in beer styles these days the line between the two styles seems to be more blurry

0 notes
Link
Among factor-based exchange traded funds, low volatility products, including thePowerShares S&P 500 Low Volatility Portfolio(NYSE: SPLV), are undeniably popular. There are, however, drawbacks to low volatility ETFs. Those include the potential to miss out on some upside during bull markets and the possibility of being exposed to high valuations by way of these funds often being heavily allocated to defensive sectors. SPLV is sector-agnostic. The ETF's underlying index holds the 100 S&P 500 members with the lowest trailing 12-month volatility. It's the benchmark's primary requirement, but there are no sector-level mandates. That said, defensive utilities and consumer staples names combine for over 31 percent of SPLV's weight. Learn more.
1 note
·
View note
Text
From Silver Linings to Gray Skies
“I think it was a long step forward in my trading education when I realized at last that when old Mr. Partridge kept on telling the other customers, “Well, you know this is a bull market!” he really meant to tell them that the big money was not in the individual fluctuations but in the main movements – that is, not in reading the tape but in sizing up the entire market and its trend.
And right here let me say one thing: After spending many years in Wall Street and after making and losing millions of dollars I want to tell you this: It never was my thinking that made the big money for me. It always was my sitting. Got that? My sitting tight! “
– Reminiscences of a Stock Operator
Since I penned the “Silver Linings Playbook” for markets on February 11, 2016, the “main movements” have been up. Thinking has been a liability. Brexit, the U.S. elections, Syria, North Korea, and Comey - all reasons to think - and all distractions from the primary trend. Sitting has earned the “big money,” as it always does during long uptrends.
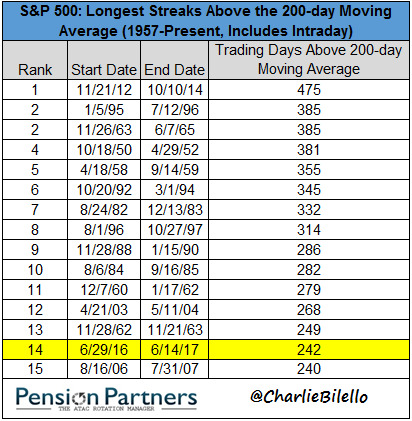
And a long uptrend it has become, with the S&P 500 holding above its 200-day moving average for 242 straight trading days, one of the longest runs in history.
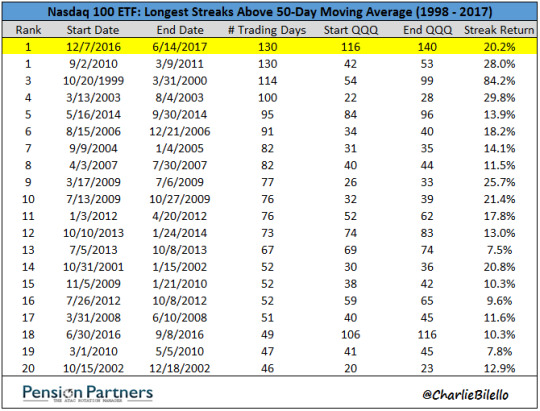
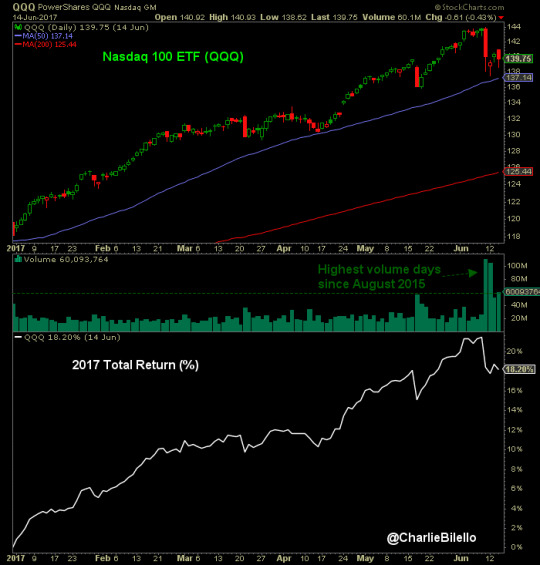
The Nasdaq 100 Index ETF (QQQ) is currently tied for the longest streak above its 50-day moving average in history, at 130 consecutive trading days.
Above the surface, all seems to be well in the world, as I outlined recently in “Is This as Good as It Gets?” It has rarely been easier to sit still and enjoy your gains than it has been in the first half of 2017. Every minor drawdown has been met with strong buying, soon followed by new all-time highs. Equity returns with bond-like volatility – what’s not to like?
But all good things come to an end. There comes a time when thinking is necessary and dare I say prudent. Is now such a time?
You be the judge…
1) With the Dow at an all-time high, the yield curve is aggressively flattening, nearing an expansion low of 80 basis points.
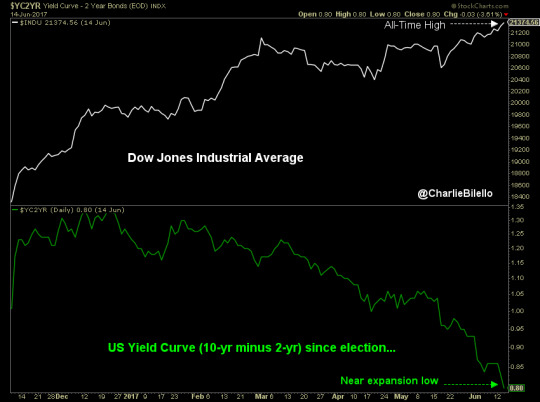
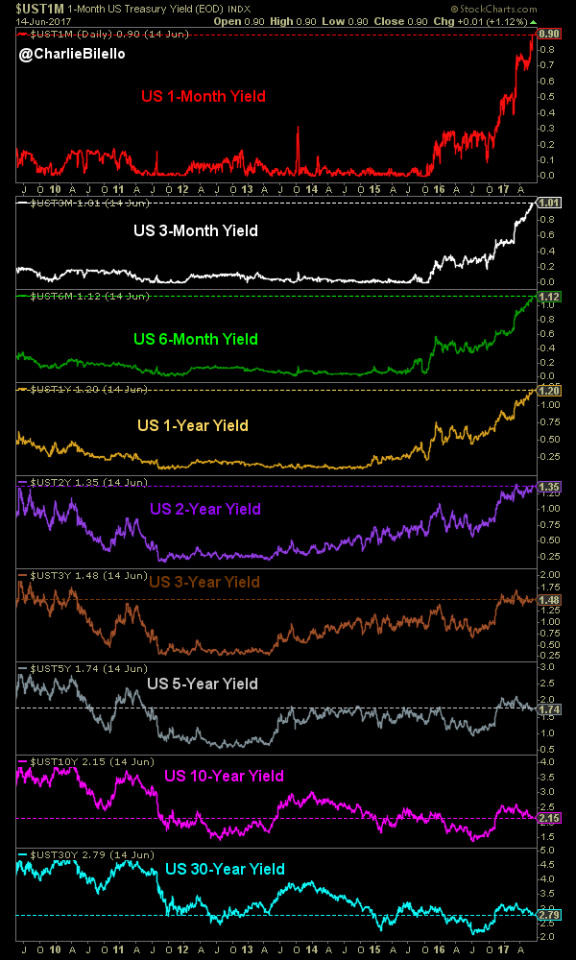
2) With the Fed hiking today to a range of 100 to 125 bps (its 4th hike since December 2015), short-term yields are at their highest level since 2008. Meanwhile, long-term yields (10-year and 30-year) are at 7-month lows.
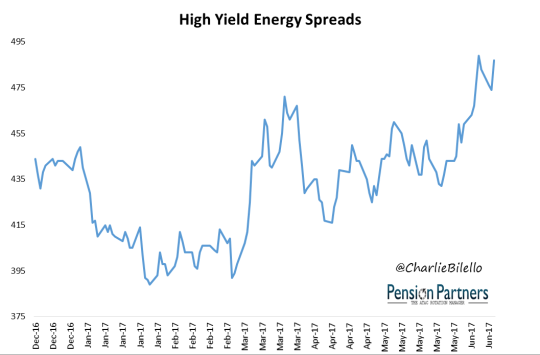
3) Credit, which had been a bastion of strength since February 2016 is starting to show some signs of weakness. Energy spreads, which caused problems for markets back in 2015-16, are at their widest levels in more than 6 months.
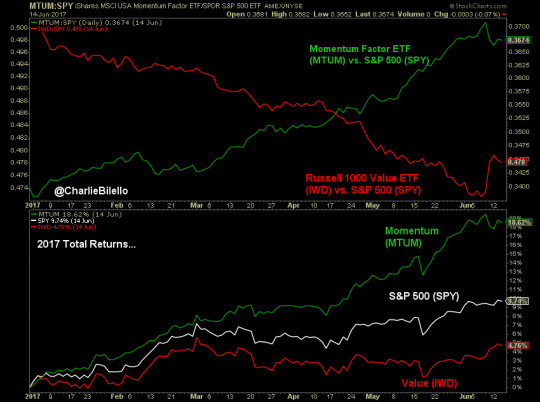
4) The spread between low volatility (SPLV) and high beta (SPHB) stocks has been widening, with defensive names hitting new highs while cyclical names are struggling to remain positive on the year.

5) Momentum stocks, which have been leading all year, are showing their first sign of weakness. The fact that Goldman Sachs is “mulling the death of value investing” is an interesting aside.
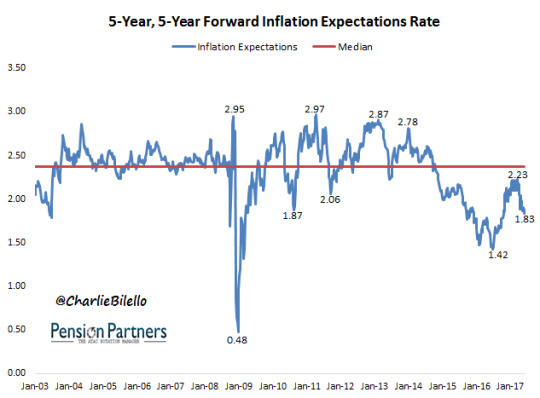
6) Talk of a pickup to 5% real GDP growth after the election is not being confirmed by inflation expectations, which are hitting 7-month lows.
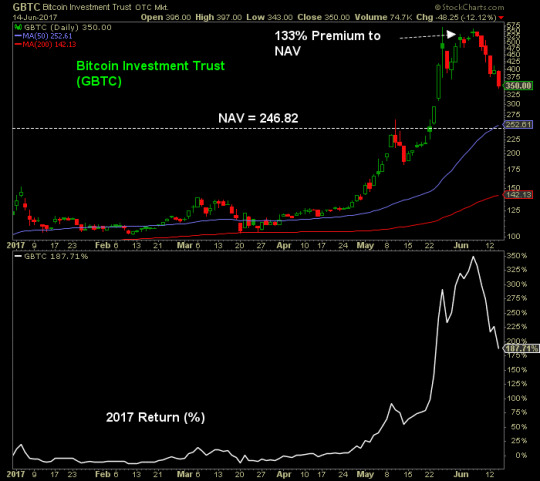
7) Speculative fever seems to be waning in other asset classes, as evidenced by the 38% drop in the Bitcoin Investment Trust (GBTC) over the last 6 trading days. In early June investors were paying a 133% premium to buy this trust. Today that premium is down to 42%.
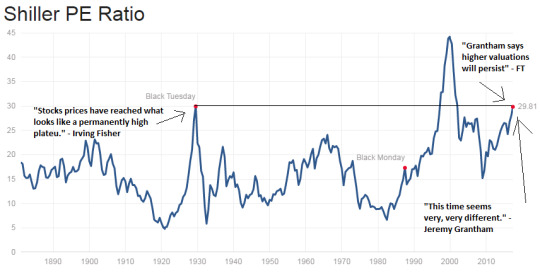
8) Jeremy Grantham, who has been forecasting low U.S. equity returns for the past seven years based on elevated valuations, is throwing in the towel. “This time seems very, very different,” he wrote in a recent piece arguing why higher equity valuations will persist.
9) The Nasdaq 100 ETF (QQQ), which as mentioned earlier is in the midst of a record uptrend, is showing higher volatility on higher volume. For the first time in a long time, there at least appears to be some uncertainty as to its near-term direction.
From Sitting to Thinking
As I write, all is calm in the world. After the Fed hike and announcement of future plans for a balance sheet reduction, the S&P 500 finished down only 2 points. The Dow hit a new all-time high. The Volatility Index (VIX) remained at one of its lowest levels in history (10.64).
It is the complete opposite of the backdrop on February 11 of last year. This has me thinking, about the risk/reward in a market (S&P 500) that has risen over 35% since that time. The above factors (some objective, some subjective) are not by any means absolute, but taken together point to a less favorable position.
Whether that less favorable risk/reward manifests itself in a 5% correction, a 10% correction, or no correction at all remains to be seen. Just because the skies are gray doesn’t mean it will actually rain. But it does mean that if you don’t bring your umbrella and it does rain, you will get wet.
Depending on your time frame, you may or may not care about getting wet. Most investors can handle getting a little wet. Fewer investors can handle a downpour. Fewer still can handle a hurricane.
The problem is that no one rings a special bell ahead of a hurricane in markets. There is no way to tell, in advance, the difference between a drizzle, a downpour and a flood. As such, if you want to manage risk and can’t handle a large drawdown, you have to behave the same the same way every time the evidence points to a less favorable risk/reward. Because you just don’t know when the next flood is coming.
If you want to protect on the downside, you have to be willing to be wrong, early and often. There is no other way. You have to accept that the rain may never come.
***
Related Posts:
Is This as Good as It Gets?
Silver Linings Playbook
To sign up for our free newsletter, click here.
This writing is for informational purposes only and does not constitute an offer to sell, a solicitation to buy, or a recommendation regarding any securities transaction, or as an offer to provide advisory or other services by Pension Partners, LLC in any jurisdiction in which such offer, solicitation, purchase or sale would be unlawful under the securities laws of such jurisdiction. The information contained in this writing should not be construed as financial or investment advice on any subject matter. Pension Partners, LLC expressly disclaims all liability in respect to actions taken based on any or all of the information on this writing.
CHARLIE BILELLO
Charlie Bilello is the Director of Research at Pension Partners, LLC, an investment advisor that manages mutual funds and separate accounts. He is the co-author of four award-winning research papers on market anomalies and investing. Mr. Bilello is responsible for strategy development, investment research and communicating the firm’s investment themes and portfolio positioning to clients. Prior to joining Pension Partners, he was the Managing Member of Momentum Global Advisors and previously held positions as a Credit, Equity and Hedge Fund Analyst at billion dollar alternative investment firms.
Mr. Bilello holds a J.D. and M.B.A. in Finance and Accounting from Fordham University and a B.A. in Economics from Binghamton University. He is a Chartered Market Technician (CMT) and a Member of the Market Technicians Association. Mr. Bilello also holds the Certified Public Accountant (CPA) certificate.
You can follow Charlie on twitter here.
1 note
·
View note
Photo

Week Ahead - Turkey Heads To The Polls, U.S. Retail Sales Eyed, China Ponders Rate Cut
https://seekingalpha.com/article/4603941-week-ahead-turkey-heads-to-the-polls-us-retail-sales-eyed-china-ponders-rate-cut
#ACTV#AFMC#AFSM#ARKK#AVUV#BAPR#IVOO#IVOV#IVV#IVW#IWC#IWM#IWN#IWO#IWP#IWR#IWS#IYY#QQQ#SPLV#SPMD#SPMO#SPMV#SPSM#SPUS#SPUU#SPVM#SPVU#SPXE#SPXL
0 notes
Last Seen Blogs

estellesdoodles
welcome to my blog

thewildestross
XXX~O

gooseworx
Gooseworx

hotelnbear
HotelnBear

bm1937
:0