#Sort Data in Excel Column
Explore tagged Tumblr posts
Visit Tumblr Blog
Explore Tumblr blogs with no restrictions, modern design and the best experience.
Last Seen Tumblr Blogs


Fun Fact
Tumblr.com is the 103rd most visited website in the world.
Text
Seedbed
An excellent chapter of Dancing to her Rhythms came out today describing the sensation of implantation from the side of the affini. I couldn’t help but wonder okay but how would that be different for Brunnaria and quickly threw this together to sate the brainworms.
This should be considered kind of a prequel to Bed of Roses, part of the what if Iya didn’t have the poison capsule scenario.
Brunnaria had tried not too look too closely at the thing before, the piece of herself that had been separated and cultivated to subsume and conquer, but now she couldn’t take her eyes off of it. She watched as it twitched and reached tendrils for her floret and Brun felt ashamed of the lack within her. She should be proud, excited, gleeful to entwine her self into her floret and expand her dominion of the universe. Instead, she felt twisting horror in her core. Was that really what she was? The true nature of her core was laid bare: a squirming parasite straining to consume. Yes, there was an instinctive hunger beginning to rear its head. Brun’s injectors were flexing and her flowers starting to produce pollen, but mostly she felt sick and uneasy.
“You can do this,” Néarcta said gently, and placed a hand on her shoulder.
A tendril brushed against Iya’s spinal column and overwhelming sparks of sensation cascaded through the air into Brunnaria’s core. She yelped and reached, stretching more tendrils into her floret in an action as reflexive as a kick in response to an impact to the patellar tendon. Then, she impulsively drew back; too little too late, she felt her implant squirming indecisively and her floret’s muscles twitched.
“Brun.” Néarcta said sharply.
It was already too much, and Brunnaria knew this was a tiny trickle compared to what she would be receiving with a full connection. She forced herself to relax, and for a moment focused on a vine-winding exercise. She loosened her control and, shivering, allowed her instincts to take over.
Distantly she observed, muttering the names of major neural landmarks as she wound herself into Iya Lapin’s mind. She’d known how this worked. She’d studied it, prepared to perform implantations for other affini, but never before had she so viscerally understood how much of her floret’s internal structure she was consuming and replacing, how even now in the earliest seconds of their union her floret was now more like an extension of Brunnaria than her own entity, how she would forever have a veto on every thought, every sensation, every way that the outside world would affect the mind of this precious sophont.
It felt good. There was pleasure happening. A hunger was being sated.
Something hit the ground with a thud.
Brun stopped bothering to identify which parts were terran and which were phytotech, stopped bothering to remember which bit did what. It wasn’t like her intellect had anything to do with this process. Her instincts knew exactly what to do. She could have done this in her sleep. Brunnaria didn’t really even need to be here for this.
So for a little while she wasn’t.
There was a groaning sound as the information started to slot together, and then she could see the whole of Iya Lapin, First Floret. That snapped her back to attention. Here was something she could do. Iya had been so scared that she would be destroyed by the process, but with this understanding Brunnaria could preserve her, protect her, and—
She became violently aware of how small and fragile a thing she was holding. Her haustorium was terrifyingly strong and a single tendril out of place would ruin everything. It felt incomplete, like a meal half-eaten, like she’d been edged halfway to orgasm, but she’d already done far, far too much. Brun smothered the part of herself that wanted more, it had been fed enough today and it could never truly be sated anyway.
There was still so much data flowing in, and her core slowly started to sort it, to adapt to it, and the curtain lifted somewhat. Brunnaria was a loose tangle in Néarcta’s lap. The older affini was running her talons through Brun’s vines.
“You did it. How does it feel?”
Mulch. Good, right? There was a pleasure coursing through her. But she didn’t really feel good. She felt different. She felt like she’d been transmuted into a wholly different organism. She felt like a caterpillar that had metamorphosed into a butterfly, except…except she still had the mind of the caterpillar. That wasn’t right somehow, being the same person when she was so different now.
“Different,” she settled on.
“You did a great job, Brun. I knew you would.”
Before Brun could answer she felt her haustorium twitch within her floret and she winced; she’d relaxed for a moment and immediately she’d tried to burrow deeper into Iya without even knowing what or where or why.
A great job. How the frost did Néarcta know? She hadn’t seen it. She hadn’t felt it. She was just trying to sooth Brunnaria. And the truth emerged within her mind: she’d done a terrible job. This was supposed to be joyful, ecstatic, a glorious union, and Brunnaria had mulched it up, and that’s why she felt so awful. She couldn’t say that, though. So instead, she curled tighter in Néarcta’s lap.
“She’s mine now. Forever.”
8 notes
·
View notes
Note
any tips or stuff youve learned along the way on making a headworld "series bible" of sorts?

discord categories & channels (ft. the old working title of Where Hate Rules because i forgot to change it). i have a discord server with just me in it where I have a channel category for each writing project.
scroll down for a spreadsheet data blast
General - image dump, place to throw in new ideas so I don't forget them, plot points, etc
Worldbuilding - this is for stuff that's set in stone, not vague concepts. maps, diagrams, etc (i have a lot of diesel engine block diagrams and celestial illustrations in there as well as every holy beast)
Character log - literally just a list of characters. put in every character in the same format (i.e Name, Age, Profession, Physical Description, Hometown)
Writing Place - for prose. I write in libreoffice but when I'm out of the house on mobile or just doing test paragraphs they go here because I'd rather kill myself than use google docs ever. Each new piece of writing has an easily-searched title.
After this I have a channel for every main character. In here I put art relating to them, backstory, motivations, any random thoughts I have about them and so on. You don't wanna see how many of these I have for my Inver channel category lmaoo.
No, there are better ways to visualise Inver's absolutely massive series bible!
Discord is obviously only useful if you're online and I don't like storing so much shit in the cloud. And what if I need rows AND columns?
man i love spreadsheets. zoom in and get a load of that sweet sweet fossit guide.
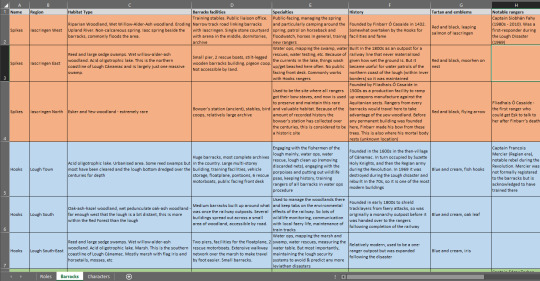
this is me kissing microsoft excel with tongue to produce a datasheet about the modern-day ranger barracks in Inver (year 2017, Pascal's time) but any spreadsheet program will do. Even (gag) google sheets. I made this because in the modern era, rangers are ecologists! They participate in land management as well as faery relations.
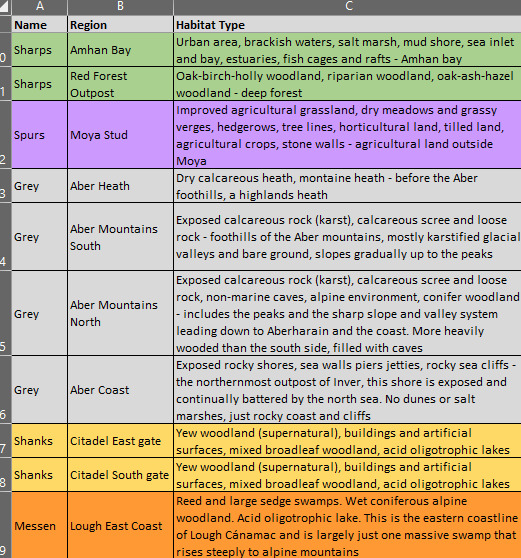
Okay so. First thing you want to do is freeze the top row so that it remains in place when you scroll. Then populate the boxes. Here, each ranger organisation (column 1) is given its own bg colour based on its main tartan colour so visual reference is easy. The characters tab is similar - frozen top row with basic categories, then a colour-coded list of rangers.
I have one of these for 1800s Inver as well! Luckily I only had to do the habitats once since they didn't change much over the years.
Hopefully that helps?? Basically: if you're lazy and need to generate ideas and data on the go, pick discord. If you want to be more specific, make a spreadsheet or 6.
169 notes
·
View notes
Text
dnp movie analysis p2: genres, studios, franchises
thanks everyone for enabling me <3 i'm back with some more analysis by genre, franchise, and studio!
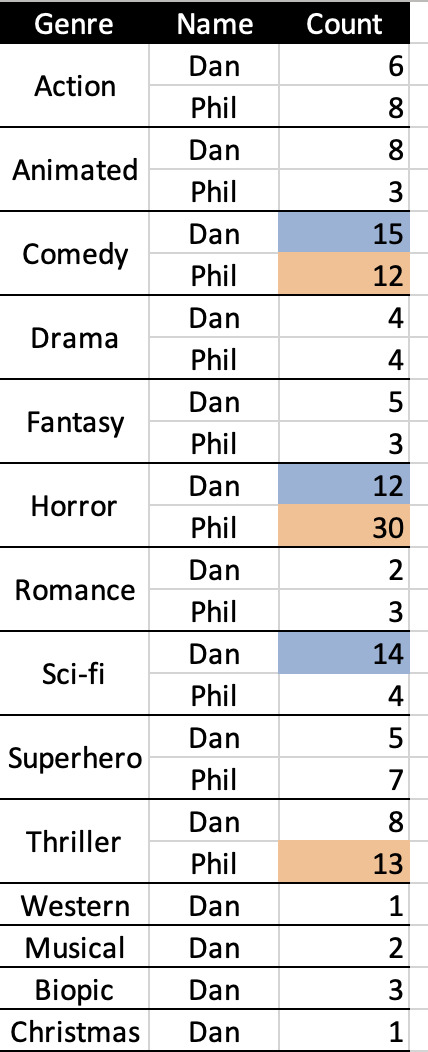
genre ratings
first, genre ratings (genre is kinda arbitrary here, tbh; there's a lot of overlap!)
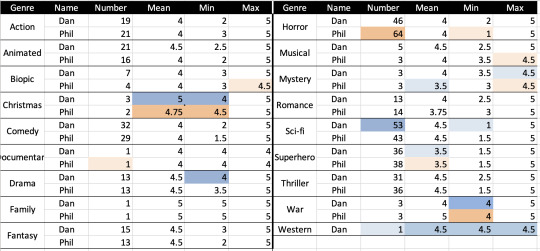
here we have the first table (please tumblr don't mess with the quality) (i can post the excel sheets if needed; r tables were being a pita)
here we have the number, mean (= median for all of this analysis), minimum, and maximum ratings by genre. within each statistic, i've highlighted the minimum (light) and maximum (dark) for dan (blue) and phil for genres with >1 movie (just realized i fucked up western, ignore that lmao)
phil has watched the most horror (64) and dan mostly sci-fi (53). interestingly, but presumably because of their love for these genres, each of their minimum scores went to these genres. if you watch a lot of one type of movie, you're gonna find the duds.
both of them liked christmas movies (tbh this was like, home alone, so), with their highest minimum and mean ratings being for that category (nostalgia, i assume because like, same). lowest mean scores were for superhero movies (both) and mystery (phil). for both of them, marvel was pretty all over the place (we'll get into that in a sec), so that's not super surprising.
their highest minimum scores were both given to war movies, which is a little surprising but this include movies like 1917 and dunkirk which are ~critically acclaimed~, so makes some sense. their minimum max scores went to westerns and mysteries for dan, and musicals, mysteries, and biopics for phil.
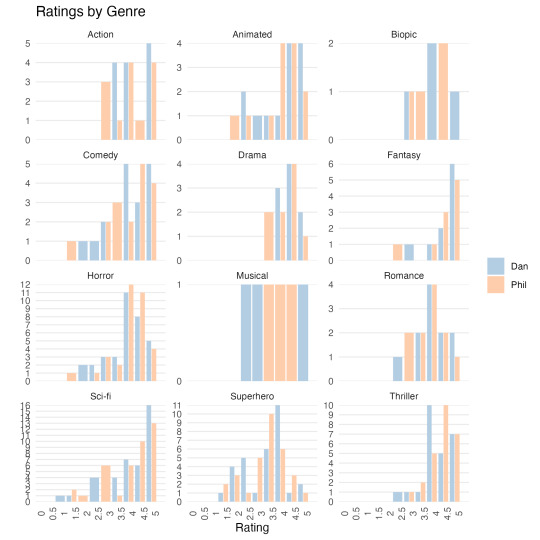
here are the histograms/bar charts for genres. these aren't the prettiest tbh, and i excluded some that had only one or two movies / weren't very interesting. without delving deep into the data, you can see how their preferences play out especially in horror and sci-fi, where phil has more highly-rated horror movies (partly because he's rated more) and dan has a lot of highly-rated sci-fi (but also low ratings). you also see how superhero movies are pretty middling -- there's almost a normal distribution! (not really, but sort of!). romance too. there's in general a lot of left skew here -- they like to rate movies highly.
final genre analysis is number of movies in one genre rated by one and not the other. i'm so sorry this table is so long.
i highlighted here the top three genres one has watched without the other. again we see phil likes his horror (and as i said in my last post, a fair amount of these movies were watched when dan was on tour, and this doesn't even include the guillermo del toro's cabinet of curiosities episodes he rated), but also thrillers (similar!) and comedies (which i get; i love to put a comedy on in the background). unsuprisingly, dan's watched a lot of sci-fi without phil, but also horror and comedy. in general, though, his genres are more distributed.
next, studios/franchises!
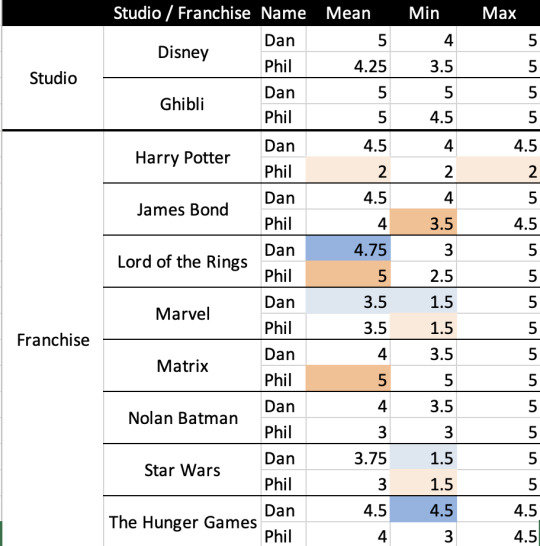
again, i've highlighted the maximum and minimum in each column, only for franchises. both of them really like ghibli, and dan likes disney more than phil (though i think this is missing big hero 6 now that i'm looking at it again, because dan rated that lower). that's theatre kid behavior: the 4.5 was beauty and the beast, all pixar and aladdin and so on were highly rated.
i fucked up the matrix somehow so just ignore that -- they both gave matrix sequels low scores
turning to franchises, phil is a harry potter hater (valid at this point). but loves lord of the rings. so does dan, though his dan's ratings actually skew pretty high for franchises in general (see: his maximum scores for each franchise are 4.5 or 5); he can pretend to be alternative or whatever but he's still a millennial at heart. their minimums minimums are both for star wars (sequels!) and marvel, which, valid. phil's highest minimum is bond (there were only a couple rated) and dan's is the hunger games, but unlike phil he only rated thg and catching fire, not either mockingjay.
and bar charts!
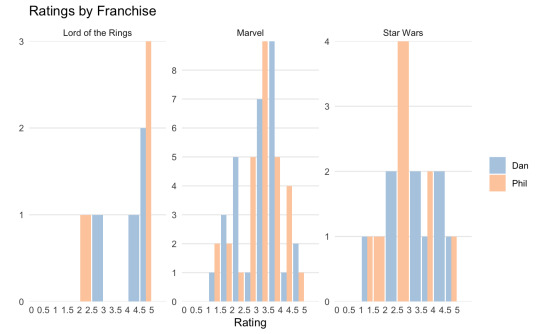

i only picked the most interesting ones here as well. marvel follows a similar distribution to the superhero movies, which, since they each only rated a couple dc movies (and i didn't include nolan's batmans), makes sense. again they both rate lotr highly, but the hobbit was low. the studio ones are less interesting imo because they skew so far left, but again: dan is such a disney kid.
that's all i have! i love this because dan, for all his faux cynicism, just rates movies so highly + it's so often the movies that don't fit his curated doomer persona but moreso the pooh one. and also phil expressing opinions! phil just watching a lot of horror!! i love it.
#dnp#dan and phil#phan#dan howell#phil lester#also i am so sorry about accessibility; i can make these more accessible (sharing the spreadsheets?) if that's useful#also i have histograms separated into d and p if ppl want to see that instead of these ones which are a little confusing to see them both o#one chart but are also imo good for general trends/comparisons#tbh i think there's an issue with the musical ratings maybe too because the shape here suggests there's no overlap in ratings but they def#both rated at least the greatest showman...#the yapping. is because i was raised by dan.
40 notes
·
View notes
Text
Plagiarist's Cant, and Plagiarists Can't.
"This was merely a single skirmish in a broader war to unravel public faith in pillars of American society."
-Claudine Gay, NYT, 2024.
That's four metaphors combined in one sentence: military, fabric, religion, architecture.
"The Ogre does what ogres can, Deeds quite impossible for Man, But one prize is beyond his reach, The Ogre cannot master Speech. About a subjugated plain, Among its desperate and slain, The Ogre stalks with hands on hips While drivel gushes from his lips."
-W.H. Auden, 1968, originally about Soviet cant.
The Gay affair (thank you English phraseology) has gotten headlines with Claudine Gay, plagiarism and antisemitism, but my interest in it is more about the entire class of people eagerly telling lies and talking cant. Lying is wrong. Cant is ogrish.
Gay lied, and the Harvard board lied to back her up, and an entire class of allegedly truth-seeking, fact-checking journalists lied some more. Several "professional" people who are well paid to be well informed were revealed as aggressively ignorant and less informed than I was after an hour with Sci-Hub and Google Scholar. I already felt cynical and jaded beforehand, and I nonetheless kept being disappointed by the sheer torrent of lies in the Gay affair.
I say "lies" because the alternative is that they are delusional imbeciles who genuinely believe that this canting midwit is a groundbreaking scholar. Look at her. Look at her and laugh.
Given a NYT column and a last word of sorts, she delivers neither competent workmanlike prose, nor literary excellence, but instead a grab bag of cant and overused metaphor and pompous self-importance.
My hope is that by stepping down I will deny demagogues the opportunity to further weaponize my presidency in their campaign to undermine the ideals animating Harvard since its founding: excellence, openness, independence, truth.
She did not bring excellence, nor openness, nor truth, and I'm skeptical about the independence. She is at best spouting cant, at worst lying again. She communicates in emotive connotations, unfitting of a Harvard scholar.
It is not lost on me that I make an ideal canvas for projecting every anxiety about the generational and demographic changes unfolding on American campuses: a Black woman selected to lead a storied institution. Someone who views diversity as a source of institutional strength and dynamism. Someone who has advocated a modern curriculum that spans from the frontier of quantum science to the long-neglected history of Asian Americans. Someone who believes that a daughter of Haitian immigrants has something to offer to the nation’s oldest university.
What a lot of blather. "Diversity" in particular is a bait-and-switch word that changes between meaning "More black people" and "Variety of opinions" depending on whether the speaker is engaged in rhetorical attack or defense. The four sentences of this paragraph could be reduced with little loss to the four words "Black. Race. Asian. Black." and in the process constitute evidence that the anxiety about changes on American campus is justified - the campus is becoming race-obsessed to the detriment of everything else. It's race-cant, similar in spirit to plagiarism, and to Orwell's complaint: "his brain is not involved as it would be if he were choosing his words for himself."
The plagiarism is not the only problem. Even the broader issue that she writes and talks sloppily is not the only problem. Her papers were bad as scientific papers. Her p-values were absurd, her statistical analysis was confounded, she dropped an inconvenient data point, she failed to distinguish correlation with causation, she asserted overly strong conclusions from tiny sample sizes processed through interpolative models, et cetera. I've got Tumblr mutuals who write better and more factful analysis.
There is nothing inherently wrong with plagiarism as such: for example engineering approaches to the same problem, studies of the same object, or entertainment in the same genre ought to be similar to one another with good reason.
Much like Van Halen's famous "remove the brown M&Ms from the bowl" contract, though, a ban on close plagiarism can serve as a simple and visible test of someone's ability to follow correct procedure. Hence the pun: plagiarists can't. Claudine Gay is a serial plagiarist who sucks at expressing herself, so she copies, and she cants.
45 notes
·
View notes
Text
Palantir freaks me out, and I have some thoughts...
Look, I have no actual plan here. Nothing concrete, anyway. But, I've just been thinking a lot about data collection lately. As someone who works with data professionally -- and specifically has a background in data quality -- I wanted to talk about different factors that make using data very difficult.
We have a saying in the data world: "Garbage in, garbage out." What that means is that you can have the nicest programs, the shiniest dashboards, and the smartest analysts, but if the data you're working with is inconsistent, incorrect, or missing, your conclusions cannot be counted on. We ran into this a lot at my last job; people would blame this one particular program that sat on top of a specific database for all the company's ills because, when we first started using it, our data quality was very poor. It took years of consistent data quality efforts and data clean-up to regain the trust of most of the company, and some people still distrusted the data in that database despite proof that it was actually a very good source by the end.
Think about it: you can run the most advanced analysis on a robust dataset, but if a quarter of the data is wrong, what good is the analysis?
So, here are a list of factors that I personally found the most frustrating to deal with as a data quality analyst, from least to most disruptive:
Missing data. Missing data is annoying, and in some cases, it can halt a project in its tracks. However, missing data can often be found, especially if it's something that was stored elsewhere -- like in state records or the like. It's also easier to recognize a problem if a field is empty -- searching for a "null" value is super simple.
Corrupt/consistently incorrect data. This is annoying, but it's something that a program or person can pick up on pretty quickly. For instance, I once found a crop of records for which the state IDs were all in the same way. I'm pretty sure what happened is someone dumped the IDs in Excel and some leading zeroes got deleted and zeroes were filled in at the end of the ID to make up for the missing numerals. It was kind of crazy that I even found these, but once I did, I quickly noticed the pattern and was able to fix them pretty easily because they were all wrong in the same way. Similarly, we received a bunch of records in an acquisition that had a value of "0" in one particular column for most wells. The "0" was meaningless, so we quickly deleted it.
Obviously incorrect data. Depending on the company, there may be measures put in place to catch data that is obviously outside the bounds of reality. Whether it be locations that don't exist or a part size that's far too large or small for the job being done, this sort of bad data can be found and deleted or excluded somewhat easily as long as parameters are established for the affect data points.
Plausible-yet-incorrect data. This is the absolute worst. Unless there is a ton of other data supporting or disproving the data point, finding and correcting it involves a lot more work -- and is sometimes impossible if the data is inconsistent across systems. Depending on the data point, AI/machine learning programs may not be able to detect that there's a problem, because all they're trained to do is recognize patterns, and if the piece of data isn't obviously incorrect or outside the bounds of possibility, it might go undetected. Too much plausible-yet-incorrect data in one dataset makes that dataset essentially useless, because who even knows what's true or not?
I'm not sure where to go with this. But it's just something I've been thinking about a lot lately.
2 notes
·
View notes
Text
Chapter 4 Loading Screen Trivia
Note: Currently, I do not know which of these trivia may be general game trivia or Chapter 4 exclusives (if there is any). And there may be trivia I'm currently missing that I will add later on, if I find any more.
World Detective Organization (WDO) An extra-legal, extra-privileged organization devoted to eradicating the world's unsolved mysteries.
Detective Deed An identification card. These are granted by the World Detective Organization.
Master Detective Among the detectives belonging to the World Detective Organization, this is a detective with a specialized power called Forensic Forte that aids in their investigative activities.
Forensic Forte Those exhibiting innate talent for special powers like clairvoyance or mind-reading are trained by the WDO to develop a supernatural investigative ability called Forensic Forte or simply, Forte.
Amaterasu Corporation Many products are in development, some of which cannot be made public.
Amaterasu Peacekeepers A department of Amaterasu Corporation. They serve as a sort of police force within Kanai Ward.
Kamasaki District Crime generally isn't bad here, unless you venture deeper inside, that is.
Riverbank Due to polluted waters, fish are rarely caught.
Kanai Station The only train station in Kanai Ward. It's a magnificent building, but seldom has customers because of the city's isolation.
Kanai Ward Living Condition Perhaps because of the daily rainfall, some people in Kanai Ward don't mind getting wet.
TV Programs Nearly all the TV programs broadcasted in Kanai Ward are sponsored by Amaterasu Corporation.
Popular Sports Parkour is popular among the young men of Kamasaki District. New problems have arisen however, what will all the trespassing and running across the top of food stalls.
Means of Communication Most communications to people outside of Kanai Ward are tapped and monitored by Amaterasu. The phone at the Nocturnal Detective Agency uses a different type of line to prevent eavesdropping.
Pets Because of Kanai Ward's unending rain, indoor pets are popular. At the same time, there is increasing concern of many dogs and cats become feral after being abandoned by irresponsible owners.
Kanai Ward's Electrical Power Because of the perpetual rain, electrical power is derived predominantly from rainwater.
Flavor of Halara's Candy Depends on the mood. The worse the mood, the sweeter the taste; the better the mood, the lighter the taste.
Fubuki's Accessories Fubuki's necklace has a clock motif. The choker is decorated with video playback control symbols.
Vivia's Book Catalog Novels, columns, essays, all sorts of things. There's no particular preference for genre; he reads just to pass time.
Vivia's Garments There are just bandage-like wrappings beneath his coat, so it wouldn't be accurate to call it clothing.
Amaterasu Corporation The megacorporation controlling Kanai Ward. It deals in a wide variety of goods such as industrial products, electronic appliances, as well as pharmaceuticals.
Kanai Ward Currently, Kanai ward is isolated from the rest of the world. Few people enter and leave and very little information goes beyond its walls.
Kanai Tower Lease agreements are available, but the monthly rent costs as much as a luxury car.
Ama-Pal Different versions of Ama-Pal exist, but among the scarce limited edition releases, there is evidently a bear variant with differently colored left and right sides.
Ama-Pay An electronic payment system courtesy of Amaterasu Corporation. It can be used at almost any shop in Kanai Ward, but rumor has it the company collects personal data from each transaction.
Popular Appliances Indoor dryers are very popular in Kanai Ward. Amaterasu Corporation's new "Kagutsuchi" model is quite excellent, capable of drying any type of laundry in just two hours.
Amaterasu's Latest Products A drone car that will autonomously deliver you from departure...to tomorrow. "Amenotorifune." Coming soon from Amaterasu Corporation.
Amaterasu's Latest Products Fall asleep in an instant.... And slumber for eight hours without waking up...no matter what... "Snoozewell," coming soon from Amaterasu Corporation.
Amaterasu Lab Research facilities located in the underground section of the Amaterasu Corporation. Access to the lab is highly restricted, even among Amaterasu personnel.
Amaterasu Security Entry to the premises requires employee IDs, as well as biometric authentication via retinal scans, making it practically impossible for outsiders to infiltrate Amaterasu Corporation.
Blank Week Mystery A phrase considered taboo in Kanai Ward. The meaning of the phrase is unclear
Makoto's Masks The mask is different ever morning, depending on his mood. Sometimes it takes him more than 30 minutes to choose, to the chagrin of the people around him.
About Dr. Huesca He walks around barefoot in the lab. This isn't for anything health-related, he simply feel the time spent putting on shoes and socks is better used on research.
Robot Researcher Akira is his name. He's poured his whole being into Ama-Pal, his life dedicated to its development. His catchphrase: "When my time comes, I want it to be by Ama-Pal's hand."
Fink the Slaughter Artist A hitman predominantly active in Kanai Ward. It's rumored that he'll kill any target, regardless of difficulty, as long as the client can afford it.
Yomi's Cane Yomi's cane transforms into a whip and can be used to strangle people he isn't fond of.
Shinigami's Secret Depending on Shinigami's emotional state, not only can horns and a tail sprout out, but her entire body can take on a fiery form.
Amazing Physique Number One of the WDO may look wizened, but beneath his robe is a muscle-bound body, compared to that of a youth's. It's littered in scars following encounters with a variety of criminals.
Invention Detective A Master Detective whose Forte allows for on-the-spot assembly of inventions useful for an investigation. This detective was not summoned to Kanai Ward.
#mdarc#master detective archives rain code#rain code#raincode#rain code archives#makoto kagutsuchi#dr huesca#yomi hellsmile#shinigami#number one
40 notes
·
View notes
Text
Excel, I thought we were friends!! I have dedicated my life to you, how could you betray me so?

I imported data in with a query, and then added columns to it and resorted after the fact... and when I updated the query data, the original rows were back in the original order, but the new columns had their data in the re-sorted order, which completely fucked up my whole table
2 notes
·
View notes
Text
Fake It Til You Make It
It's with a heavy heart that I admit, once again, I have yet to finish off Final Fantasy VII: Rebirth at time of writing up this post. While I'm certain the ending is not far off, there's a plethora of side activities demanding my attention including the likes of Queen's Blood and secondary quests. Oh, and competing in the Musclehead Coliseum at the Gold Saucer. But I'm certain my next post will most assuredly be all about our Gaslight, Gatekeep and Girlboss queen: Sephiroth!
Honestly, if the world of Gaia actually had an Employee Assistance Program and a slew of therapists at their beck and call, I'm a hundred percent certain Sephiroth would not be able to so easily manipulate main protagonist Cloud Strife into doing his bidding.
Of course, that's a blog for another day!
Speaking of therapy, though, I'm certain I'd be perfect picture of a client who is intellectualises many of my problems and is quite self-aware of the glaring issues I need to address. Unfortunately, knowing what I need to do is a lot easier than actually putting in the effort. Take, for example, the very real impostor syndrome I felt when I'd been offered a chance to act up at my work place.
The anxiety bubbling in my stomach, the spiralling thoughts...
This was, despite the fact, I'd grown bored with my role and was actively looking for something a little bit more challenging. I think a part of it was because the supervisor for the new team, when he called me, had glanced through my resume and had pinpointed several aspects he thought beneficial to the role I'd be taking up. Namely, Microsoft Excel.
Of course, I'd tried to dissuade him of his assumptions. After all, for most of my working life, Excel has simply been a means of inputting data. There is no sorting, no freeze rowing or actually pivot tabling of the information at hand. That is reserved for another member of our team. One who eat, sleeps and breathes spreadsheets.
I just know how to do basic functions. Like filtering or creating new columns.
Using something like vlookup, though? No. No way. Not in my wheelhouse. Heck, any formula besides sum and a few other simple functions are way out of my scope. I wouldn't know the first thing about them. At all.
And yet, here I was, being trusted to assist with an important report and finally use my brain to critically analyse the information that would go in it, noting any important trends that may have cropped up. Wasn't this something I'd wanted to do since I'd got my degree in Social Science? Yes, the quantitative data before me wasn't entirely related to criminology, but it was a start.
I think part of it comes from being a gifted child when I was younger. One who attended school with other gifted children. Growing up was not easy when everyone else was just as intelligent, if not more so, than you. Coupled with my mother's expectations to be more perfect, is it any wonder I came away from it saddled with crippling self-doubt and low self-esteem?
While failure is a great fear I've harboured for many a long while, it seems passingly strange that it doesn't always carry over into everything I do. Take video games, for example. In many a game, especially platformers, I've often had to retry levels multiple times to get past it. Each time, of course, learning what I did wrong and how I might improve. Yes, sometimes I'd be convinced it was the game's fault and not mine, but I'd persist.
And if persistence didn't pay off after a significant period, I knew I could always lower the difficulty.
Failing in real life, however, is a different ordeal. Or so it feels.
While I know each failure I commit won't lead to the heat-death of the universe, and that it's a learning experience, I find it hard to accept I may not always be good at something from the onset. After all, theoretical principles, once explained, are understandable to an extent. And if I'm following an instructor, doing as he does during special targeted training with minimal requests for help, it must mean I innately know the content. Right?
Well, no. Because training in a closed and guided environment doesn't always translate to the exterior world. Take for example, driving a car. Let it be known, dear reader, I failed my driving test twice before finally passing my third go.
It was this very reason that I found problematic when it came to my degree at university. Sure, we used the programs available for the students, but there was a distinct lack of focus for the wider applications for the knowledge I was attaining. There was no course for extrapolating information from an Excel database. Qualitative data was nigh impossible to assess for the end-of-term project unless the responses were individually sifted through. And none of what I was doing seemed to reflect the kind of work I'd face in a professional setting.
Quite frankly, it was a bit of a mess.
Fast forward to the current day and I'm all but drowning my fear that I'll mess up and make a fool of myself. Even as I know I'm a quick learner and could pick up the skills after a few tries.
But in the back of my mind, the doubt remains. The harsh inner critic telling me I'll never be enough. That the people around me will judge me for not immediately knowing what needs to be done and how. Even though I know they'd only have picked me out of the gods-know-how-many other candidates who had also thrown their hat into the ring (maybe it was one. Maybe it was two. Or perhaps it was a neat hundred. One can only dream, right? Like winning the lotto?)
And maybe it's also the reason why I struggle with finding love. Sometimes I wonder if part of the reason why I can't seem to connect with anyone is actually a form of self-sabotage. My own self-hatred getting in the way of me creating a lasting connection with the strangers I meet. Then again...it could be just that many of the people I've met haven't really wowed me or met my stringent standards.
What I do know is that the person I have a crush on?
I'm scared they might reject me if I were to find a quiet time to tell them of my feelings. Yes, my friend (who is their cousin) has told me that there might be a sort of reciprocity (or, at least, they seem to attend events if they know I might be there), it's still a little hard for me to know with absolute certainty it'll end merrily.
Still, I suppose that's the risk of life.
There is no certainty. No control over the will of others.
The act of being vulnerable sets one up to being hurt.
To failing.
To being unmasked as the impostor one is.
But it's only by embracing that very thing, and putting oneself out of their comfort zone, that we can grow. I don't know what the future will bring but I have told myself that after my mother comes back from overseas and I'm no longer stressed about caring for my elderly grandmother, I should, at least, try for the possibility of happiness. Whether that be a new career path or even finding myself a possible life partner.
For now, I'll have to settle for proving to myself how much of an asset I can be to my new team. And if I struggle a little bit, that's good. Because it means I've finally come up against a challenge. Something I've been looking for since my previous role has led to a lot of stagnation in what I actually want to achieve (not that I have a lot of ambitions when it came to the work place - please, can a publisher just reach out and offer me a contract to write books? I swear I can write something people of all ages would enjoy!).
So here's to pretending I know exactly how Microsoft Excel works and looking at endless spreadsheets for the next six months! Huzzah!
#personal blog#excel#spreadsheets#the work life#corporate drone#insecurity#self-esteem issues#low self worth#perfectionism#gifted kid problems
3 notes
·
View notes
Text

Lil' tutorial from yours truly for marvel characters that you're are pretty sure have interacted, but don't know which issue(s) and you want to avoid the RP faux-pas of having your character not know the other when they do in-universe?

(that is a very specific title, but it is what it is)
head over marvel.fandom.com and look up character A
check out their appearances, and copy the whole list into excel (google sheets doesn't have the option to do the conditional formatting we need at this time, so you have to use excel :( haven't tried other free office alternatives though)
look up character B, and paste the list into the same column, after the appearances of character A
optional but makes things neater IMO: sort from A to Z
Select Home > Conditional Formatting > Highlight Cells Rules > Duplicate Values
choose how to highlight the data that is doubly present. Choose something visible like bold + red
scroll your list.... you'll see all the shared appearances in double & highlighted.
Voilà, you can go read the issue profiles on marvel.fandom.com and/or use your trusty websites to read said issues directly. (not all issues are relevant/important, so I recommend checking out the profile before wasting time reading)
Should take about 15 minutes with practice, without the time needed to read the issues ofc.
If you need I can make a picture tutorial, but I will only spend time on it on request ;)
6 notes
·
View notes
Text
Inform Basics: practice with tables
Tables can be intimidating, but they are great for handling complex situations with text. Since writing and printing text is my whole jam, I've pushed myself to use tables as much as possible. My first ever table turned out to be the central tracking system for magic in Repeat the Ending!
I think I had some beginner's luck there--I never needed to change/fix it later. We'll use it as a model for the next few posts. I've made a couple of things nicer for this discussion, but the core functionality is unchanged.
Let's Make a Table!
A table, as a lot of you probably know, is a way to store and present information. It is a grid organized by rows and columns. If you've ever seen a spreadsheet program like Excel, you can visualize the way rows and columns can be used to arrange information sensibly.
In Inform 7, a table has very specific formatting conventions that must be followed:
It begins with the text "table of [insert your title here]" alone on a single line of code.
On the very next line, the names of the columns must be typed and separated by a single press of the TAB key.
The next line(s) contain(s) data. Once again, columns are separated by the TAB key. Note that actual empty entries are not permitted. Instead, populate so-called "blank" fields with two hyphen characters (without quotation marks).
Here's an image of a very paired-back version of the table from RTE:

In some cases, we need to tell Inform 7 what a column of data is. More on this next time. For now, just be aware that I've got this in my code to explain what the first column, "siphontype," contains.
siphontype is a kind of value. the siphontypes are defined by the table of diagnoses.
There's no magic to any of these names. They're just what seemed right at the time.
Some simple applications
What can we do with it? Without getting up to anything fancy, we can count the rows. Inform 7 will count almost anything if you use the phrase "number of [almost anything with a numbered quantity]". I'll make a custom action, frobbing, for these experiments.
frobbing is an action applying to nothing. understand "frob" as frobbing. carry out frobbing: say "The number of rows in the table of diagnoses is [number of rows in the table of diagnoses]."
Output:
>frob The number of rows in the table of diagnoses is 3.
We can also dump the entire contents of the table. "Repeat through," which we've used on lists, can also be used to apply an operation/action/etc. to multiple rows in a table.
repeat through the table of diagnoses: say "[siphontype entry]: [diagstring entry]"
OK. Since "siphontype" and "diagstring" are column names, Inform 7 will walk through each row, printing the relevant entries.
What does that look like?
>frob The number of rows in the table of diagnoses is 3. TInert: At the moment, I am not empowered by any sort of entropic magic.TPsychic: [REDACTED]TLucky: Feeling lucky?
Yikes. That's pretty ugly. Let's get that text cleaned up.
carry out frobbing: say "[bold type]The number of rows in the table of diagnoses is [number of rows in the table of diagnoses].[roman type][paragraph break]"; repeat through the table of diagnoses: say "[siphontype entry]: [diagstring entry][line break]"
The main features here are bold text for the first line, a blank line between the bold text and the table dump, and line breaks after every printed row. It winds up looking like this:
The number of rows in the table of diagnoses is 3.
TInert: At the moment, I am not empowered by any sort of entropic magic. TPsychic: [REDACTED] TLucky: Feeling lucky?
I think that's enough for today! Next time, we'll dig deeper into tables, using the same bit from RTE as an example. As always, feel free to AMA
Code used in this post:
#interactive fiction#inform 7#parser#i7 for beginners#i am not a programmer irl#tables#repeat the ending#AMA
6 notes
·
View notes
Text
Mastering Excel Basics: 10 Essential Tips for Spreadsheet Success

I. Introduction
In this section, you will introduce the blog post by emphasizing the importance of Excel in various aspects of life and work. You will highlight the significance of mastering the basics of Excel for efficient usage of spreadsheets. This will set the tone for the rest of the blog post. II. Tip 1: Navigating the Excel Interface
This section will guide readers on navigating the Excel interface effectively. It will explain the key elements of the Excel interface, such as the ribbon, menus, and toolbars. You will provide tips on customizing the interface based on individual preferences, improving productivity while working with Excel. III. Tip 2: Creating and Formatting Cells
In this section, you will explain the process of creating and formatting cells in Excel. You will cover essential aspects such as adjusting column width, merging cells, and applying borders. This will help readers make their spreadsheets visually appealing and organized. IV. Tip 3: Working with Formulas and Functions
This section will introduce readers to the concept of formulas and functions in Excel. You will explain basic mathematical operations, referencing cells, and using common functions like SUM, AVERAGE, and COUNT. Practical examples and shortcuts will be shared to simplify the creation of formulas. V. Tip 4: Sorting and Filtering Data
Here, you will demonstrate how to sort data in ascending or descending order in Excel. Additionally, you will explain the benefits of filtering data to focus on specific information. Tips on applying multiple criteria and using advanced filtering options will be provided. VI. Tip 5: Data Validation and Error Handling
This section will discuss the importance of data validation in Excel to ensure accurate data entry. You will share techniques for setting validation rules and creating custom error messages. Furthermore, insights on handling errors, such as using error checking and the IFERROR function, will be provided. VII. Tip 6: Working with Worksheets and Workbooks
In this section, you will guide readers on managing multiple worksheets within an Excel workbook. Techniques for rearranging, renaming, and grouping worksheets will be explained. Additionally, tips on linking data between worksheets and workbooks for efficient data management will be shared. VIII. Tip 7: Using Charts and Graphs
This section will highlight the power of visualizing data with charts and graphs in Excel. Readers will be walked through the process of creating various chart types, such as bar graphs, line charts, and pie charts. Suggestions for customizing and formatting charts to effectively convey information will be offered. IX. Tip 8: Applying Basic Analysis Tools
Here, you will introduce readers to basic analysis tools in Excel, including sorting, filtering, and conditional formatting. The benefits of using these tools to gain insights from data will be discussed. Practical examples of analyzing data using these features will be provided. X. Tip 9: Enhancing Productivity with Shortcuts
In this section, you will share a selection of useful keyboard shortcuts in Excel to streamline common tasks. Time-saving shortcuts for navigation, formatting, and formula entry will be highlighted. Readers will be encouraged to practice and incorporate these shortcuts into their workflow. XI. Tip 10: Troubleshooting Common Issues
This section will address common issues that users may encounter while working in Excel. Troubleshooting tips for issues like formula errors, data inconsistencies, and printing problems will be provided. Resources and recommendations for further assistance will also be given.
Microsoft Excel Basics Microsoft Excel is a powerful and versatile tool that provides numerous benefits for individuals and organizations across various industries. This conclusion highlights the fundamental aspects of Microsoft Excel and its importance in everyday tasks. Firstly, Excel serves as a comprehensive spreadsheet program that allows users to organize and analyze data efficiently. Its wide range of functions, formulas, and formatting options enable users to perform complex calculations, create visually appealing charts and graphs, and manipulate data with ease.
Excel’s intuitive interface and user-friendly features make it accessible to users of all skill levels. Secondly, Excel enhances productivity and saves time by automating repetitive tasks through the use of macros and advanced formulas. It enables users to create templates and apply them to new data sets, thereby streamlining workflows and reducing errors. Additionally, Excel facilitates collaboration and data sharing by providing options for data import/export, real-time co-authoring, and integration with other Microsoft Office applications. Moreover, Excel is a valuable tool for financial analysis, budgeting, and forecasting. It enables individuals and businesses to track expenses, manage budgets, and generate accurate financial reports. Excel’s built-in financial functions and tools make it an indispensable asset for finance professionals, enabling them to make informed decisions based on reliable data. Furthermore, Excel is widely used in various industries such as finance, accounting, marketing, and project management. Its versatility allows it to adapt to different business needs, making it a universal tool for data manipulation and analysis. Proficiency in Excel is often a prerequisite for many job positions, and acquiring Excel skills can significantly enhance one’s employability
In this article, we’ll cover the fundamental capabilities in the Lace, which is what the primary menu bar in Succeed is called. Things in the lace contain gatherings of symbols that carry out comparable roles. These incorporate :
File Home Insert Page Layout Formulas Data Review View
File

The Record menu is the furthest left thing in the Succeed strip. The Record strip things empower you to perform document the executives capabilities, including open, save, close, and print. You likewise utilize the Document menu to import from outside sources into Succeed, alongside choices that permit you to change Succeed itself.
Expert Tip: The Document menu doesn’t show up as a lace in Succeed for Macintosh. All things being equal, the Document menu shows up in the Application Menu Bar.
Home

The Home menu is the second menu in the Succeed menu bar. The Home lace things incorporate choices for arranging textual style, variety, restrictive designing, channel, number sort, and that’s only the tip of the iceberg. This multitude of capabilities help one in performing different viable computations.
Expert Tip: Attempt the Configuration Painter. It permits you to duplicate the designing starting with one cell then onto the next, which can be an incredible efficient device.
Insert

As the name recommends, the Supplement menu assists you with embedding different choices and things into a Succeed calculation sheet. You can embed different things going from turn table to picture, cut craftsmanship, shapes, screen shots, diagrams and charts, text box, header and footer, images, condition, and that’s only the tip of the iceberg.
Expert Tip: You can likewise embed hyperlinks and even guides utilizing the Supplement menu.
Page Layout
Once more, the name recommends the assortment of capabilities on the Page Format menu. You’ll see numerous choices for arranging pages for survey and printing — including page size, edges, tones and text styles, etc. You can likewise tweak cell level and width on the Page Design menu.
Expert Tip: You can add a foundation to an assortment of cells — or even your whole bookkeeping sheet. Simply click Foundation and select the picture you need to utilize.
Formulas

The Recipes menu is where you track down all the calculating choices. Succeed accompanies heaps of equations including monetary, intelligent, text, date and time, query and reference, and math and geometry.
Expert Tip: You can name cells or scopes of cells – this can make it more straightforward to modify your recipes.
Data

The Information menu likewise contains numerous significant capabilities in Succeed, incorporating imports and associations with data sets. You likewise access the sort, channel, eliminate copies, information approval, solidification, bunch, ungroup, and subtotal capabilities on the Information menu.
Expert Tip: Utilize the Information Approval capability to guarantee consistency in cells.
Review

Prior in this article, we referenced Succeed’s capacity to team up on calculation sheets. The Survey menu is where a significant number of those errands happen. You can offer remarks in cells for your associates, check spelling, track changes, and even limit authorization involving things in the Audit menu.
Expert Tip: Utilize the Offer Exercise manual connect to impart to your associates!
View

On the View menu, you tweak the manner in which accounting sheets show up on your screen. Choices incorporate showing matrix lines between cells, flipping the recipe bar and headings, and that’s only the tip of the iceberg. This menu additionally gives you choices to view and record macros, also — macros let you record normal advances you perform so you don’t need to rehash exactly the same things again and again!
Expert Tip: Utilize the Freeze Top Line or Freeze First Segment, and they will wait while you look at endlessly pages of numbers.
Conclusion In the concluding section, you will recap the 10 essential tips for mastering Excel basics. Readers will be encouraged to apply these tips to improve their spreadsheet skills and achieve success. The importance of continuous learning and exploration of advanced Excel features will be emphasized. By explaining each outline in detail, the blog post will provide valuable insights and practical guidance to readers looking to master Excel basics and succeed with their spreadsheets.
Microsoft Excel is an essential tool for data management, analysis, and productivity improvement. Its diverse range of features, ease of use, and widespread applicability make it an indispensable asset for individuals and organizations alike. By mastering the basics of Excel, users can unlock its full potential and gain a competitive edge in the digital age.
2 notes
·
View notes
Text
youtube
Optimizing Data Management with Business Central List Page View
elcome to "Optimizing Data Management with Business Central List Page View" video! In this video, we'll explore how to use the List Page View in Microsoft Dynamics 365 Business Central to manage your data more efficiently.
The List Page View is a powerful feature that allows you to view, sort, filter, and edit data in a table format. We'll show you how to customize your list pages by adding and removing columns, filtering data, and exporting information to Excel for further analysis.
We'll also cover some tips and tricks to help you work with large data sets more effectively. For example, we'll show you how to use the "find" function to quickly locate specific records and how to use keyboard shortcuts to speed up your workflow.
By the end of this video, you'll have a better understanding of how to use the List Page View to optimize your data management and make informed business decision.
2 notes
·
View notes
Text
Most kids do not enjoy spreadsheets. Most kids, as far as I know, float through elementary school in a haze of pre-Excel bliss, never once dreaming of tracking their finances or doing their taxes.
Not me.
I was born with a filing cabinet in my brain and a deep desire for patterns. As soon as I understood the concept of "more than one thing" I felt an overwhelming urge to put them into a color-coordinated list. Marbles? Arranged. Books? Shelved by author. Stuffed animals? Writing those little bitches' names down in my diary like I was Light Yagami and they were America's Most Wanted.
I used to lie on the floor of my bedroom and HAND-DRAW grids on taped-together sheets of paper with a ruler, probably because I didn't know how to turn on a computer yet. When I had successfully made hundreds of (sort of) identical boxes I filled them with incredibly important information about my OCs, such as name, eye color, number of siblings, magic powers-- you get the idea. (I think most of them were unicorns, but I can't check because I lost all these proto-spreadsheets at some point in the two decades since i made them.)
Around age 9 I gained access to my family’s desktop Mac and started spending all my time alone and unsupervised in the "computer room" (early 2000s kids remember) because my parents didn't know enough about the Internet to be worried. Luckily their kid was a nerd, so instead of discovering porn or chatting to 40-year-old men or whatever my peers were doing I found Excel and was immediately fascinated. So many options! Such easy data entry! I could even color-code!!
I used my new power to invent endless OC families with at least 20 kids each, all named around a theme like "plants" or "semi-precious stones" or "Irish". I spent more time on baby name websites than a pregnant Mormon-- all for the sheer pleasure of writing them down, picking my favorites, and neatly squaring them away in Excel docs, organized by age and hair color. I'm sure there are still dozens of them on my dad's hard drive somewhere, buried alongside the maze of nested folders I created to categorize and store my favorite photos of cakes.
(the cakes are a whole other can of worms, but really this too is spreadsheet...)
My biggest project, though, was recording all the different color names in my mom's Lands End catalogs. It took years and ended up with HUNDREDS of entries. I'm not sure there even are that many colors, and if they do exist they're certainly not fully represented in Lands End heather v-neck sweaters. But damn if they aren't all written down in color-specific columns!
this project extended into high school. On an unrelated note, I didn't go on a real date until I was 21.
Look, I'm being rude to myself because I can, but it's fond teasing. Spreadsheets are great!
For example, I actually do well with money even though I'm an impulsive little bastard with a bad memory, no sense of consequences, and a strong desire for little treats-- mostly because every single week I sit down and meticulously go through my finances in my carefully tailored Money Spreadsheet.
(I also sit down every month and meticulously go through my Spotify history, but that's beside the point. My Spotify chart makes graphs, and everyone knows graphs are cool.)
But really, I genuinely think it's helped me manage my likely undiagnosed ADHD that i so enjoy organizing stuff into little rows. Or maybe it's the other way around, I don't know. Chicken and egg ¯\_(ツ)_/¯
So yeah, spreadsheets! A fun and helpful way to organize things that do and also don't matter! Don't come for me and my 256 Spotify playlists, okay?? We're fine. We're chilling. We have the dozens of pages in my Notes app listing all my new OCs and their attributes to keep us company. I haven't changed since I was six years old.
Because this came up in my life recently, a question:
To be clear I mean a spreadsheet in any program (Excel, Sheets, Notion) and for any reason EXCEPT for it being required of you. It could be cataloging stuff you own, categorizing characters in a show you like, etc. But it has to be something you chose to do without being paid or graded for it
#Poll#The fun thing about being undiagnosed is that you have so many options to explain your childhood and also adulthood#Was I just an only child? Is there something else going on? Who knows!
8K notes
·
View notes
Text
What is Structured Data and Why Do Lists Need It?
Structured data refers to information organized in a clearly defined format, such as tables with rows and columns. This structure allows software systems and users to efficiently search, analyze, and manipulate data. In contrast, a simple list—whether it's a bullet-pointed list in a document or a string of values—is not inherently useful without structure. For example, a list of names and phone numbers is just text until it’s divided into two columns labeled “Name” and “Phone Number.” This conversion gives meaning and order to the information, making it readable for both humans and machines. Lists are useful for brainstorming, capturing quick notes, or collecting raw input—but structured data unlocks their full potential.
Step-by-Step: Converting Lists to Tables in Excel and Google Sheets
One of the easiest ways to structure a list is by using spreadsheet tools like Excel or Google Sheets. Start by pasting your list into a column. If each item includes multiple parts (e.g., “John Doe, New York, 32”), you can use Excel’s “Text to Columns” feature or Google Sheets’ SPLIT() function. These tools allow you to divide each entry into multiple columns using whatsapp data like commas, tabs, or spaces. After splitting, you can add headers to each column to define your dataset (e.g., Name, City, Age). This small step transforms your raw list into an organized data table. From here, you can sort, filter, and even create charts.

Using Online Tools to Convert Lists Automatically
There are many free online tools designed specifically to convert lists into structured formats such as CSV or JSON. These include platforms like CSVLint, TableConvert, or ConvertCSV.com. Simply paste your list, select your delimiter, and the tool instantly formats your input into a data table. Some tools even let you preview your data before downloading. These web-based utilities are perfect for users without spreadsheet software or coding experience. They’re especially handy for quick jobs like formatting data for reports, email campaigns, or import into databases or CMS platforms.
Tips for Clean and Accurate Data Transformation
Successful list-to-data conversion depends on consistency. Always check that each list item follows the same structure—no missing commas, extra spaces, or inconsistent formatting. Use functions like TRIM() in Google Sheets to remove unwanted spaces, or CLEAN() to get rid of hidden characters. Standardize formats for dates, phone numbers, or capitalization. If working with large lists, apply conditional formatting to highlight errors. Finally, always validate your converted data before using it—whether for analysis, uploads, or automations. Clean data is reliable data, and a little attention early on saves time down the line.
0 notes
Text
How to Use Google Sheets for Data Visualization
In today’s data-centric era, creating impactful data visualizations is essential for professionals in every sector. While many tools are available, Google Sheets offers a simple yet powerful platform for creating insightful visualizations without the need for complex software. This article will guide you through using Google Sheets for data visualization, and how enhancing your skills with a data analyst course in Kolkata can elevate your capabilities.
Why Choose Google Sheets for Data Visualization?
Google Sheets is a web-based spreadsheet application that offers a blend of convenience, user-friendliness, and robust features. It allows you to organize data, perform calculations, and create various types of charts—all within a collaborative environment. For aspiring data analysts, especially those enrolled in a data analyst course in Kolkata, Google Sheets serves as an excellent starting point to practice and apply visualization skills.
Moreover, Google Sheets supports real-time collaboration, making it easier for teams to work together on data projects. This feature is particularly valuable in today’s hybrid work culture, where analysts must collaborate with stakeholders across different locations.
Setting Up Your Data
Before diving into visualization, it’s essential to structure your data effectively. Start by organizing your dataset into clear columns and rows, ensuring labels are clear and consistent. Google Sheets offers built-in functions to clean, filter, and sort data, which is a foundational skill taught in any offline data analyst institute in Kolkata. Proper data organization minimizes errors and sets the stage for accurate visualizations.
Choosing the Right Chart Type
Google Sheets offers an array of chart options such as bar charts, line graphs, pie charts, and scatter plots. The key is selecting a chart that best represents your data’s story.
For example:
Use a bar chart to compare categories.
Select a line graph to illustrate trends across a period.
Opt for a pie chart to illustrate proportions.
Apply a scatter plot to display relationships between two variables.
Learning to match data types with appropriate visualizations is a skill honed through courses like a data analyst course in Kolkata, where you practice real-world scenarios.
Customizing Your Charts
Once you’ve selected a chart, Google Sheets offers extensive customization options. You can adjust colors, fonts, data labels, and axes to make your visualizations more impactful. Use consistent color schemes to enhance readability and emphasize key data points. Remember, the goal of data visualization is clarity and insight, not just aesthetics.
Offline training from an offline data analyst institute in Kolkata often emphasizes these customization techniques, ensuring your charts effectively communicate insights. Whether you’re preparing reports, dashboards, or presentations, well-designed charts can make complex data accessible to everyone.
Interactive Dashboards with Google Sheets
Beyond static charts, Google Sheets supports the creation of interactive dashboards. By using data validation, filters, and linked charts, you can allow viewers to explore different perspectives of the data. Such interactivity boosts user involvement and facilitates more flexible decision-making.
Interactive dashboards are a staple in the toolkit of modern data analysts, and practicing these techniques during your data analyst course in Kolkata will prepare you for real-world applications. Google Sheets offers a user-friendly environment to experiment with these dynamic features.
Sharing and Collaboration
Google Sheets makes it easy to share visualizations with colleagues or clients. You can set access permissions, collaborate in real-time, and even embed charts into presentations or websites. This collaborative functionality mirrors the team-based projects often emphasized in an offline data analyst institute in Kolkata, where working with others is key to delivering successful projects.
DataMites Institute: Your Partner in Data Visualization Excellence
For those eager to master not only Google Sheets but also a broad spectrum of data analytics tools and techniques, DataMites is the ideal partner. Accredited by IABAC and NASSCOM FutureSkills, the courses at DataMites Institute are designed to meet global industry standards. Learners gain access to expert mentorship, hands-on projects, internship opportunities, and comprehensive placement support.
DataMites Institute also offers offline classroom training in key cities such as Mumbai, Pune, Hyderabad, Chennai, Delhi, Coimbatore, and Ahmedabad—ensuring flexible learning options across India. If you're based in Pune, DataMites Institute provides the ideal platform to master Python and excel in today’s competitive tech environment.
What truly distinguishes DataMites Institute is its learner-centric approach. With a curriculum that bridges theory and practice, learners are equipped to handle real-world data challenges. Whether you’re aiming to use Google Sheets for data visualization or pursue a deeper dive into analytics, DataMites Institute offers a pathway tailored to your ambitions. Its courses emphasize clarity, problem-solving, and communication—skills that will make you a sought-after data analyst.
In conclusion, Google Sheets is a flexible tool for data visualization that combines ease of use with advanced capabilities. By combining its functionalities with skills gained from a data analyst course in Kolkata, and nurturing those skills further through an offline data analyst institute in Kolkata, you can become a data visualization expert ready to meet the demands of today’s data-driven world. And with DataMites as your learning partner, you’ll be well-prepared to turn insights into impact.
1 note
·
View note
Text
Looking for list of excel formulas? We have a create a cheat sheet for excel formulas to help beginners. The excel Spreadsheet has number of functions which can be used to help you greatly enhance your abilities when it comes to performing day to day maths operations. With excel, you no longer have to waste time doing things manually. If you are new to excel, know that you can use it to find totals for any given column or a row of numbers and perform many more functions. To achieve this, excel uses formulas in cells to perform the different calculations. When starting a formula you need to know that every formula usually starts with an equal sign which can then be followed by a number, math operators and the functions. In addition to this article you may also find this ebook about Microsoft Excel : 101 Secrets Of A Microsoft Excel Addict Snapshot of The Cheat Sheet Please click on the image to see in bigger size. Get Access To Printable Useful Excel Formula Cheat Sheet (PDF Format) For Just a Tweet The Fromdev Cheatsheet for excel formula is available totally free in exchange of a tweet. Download Cheatsheet As soon as you tweet we will redirect you to the download page and you will be able to downloaded the cheatsheet to your computer. Reference Operators These refer to a cell or a group of cells. Reference operators are divided into two types including: union and range. As for a range reference, it can be defined as the cells between and also includes the reference. It includes 2 cell addresses that have been separated by a colon. On the other hand, a union reference refers to 2 or more references. It is made up of 2 or more cell addresses that have been separated by a comma. Excel Formulas That You Need To Familiarize Yourself With SUM Just as the name suggests, you can expect the SUM function to help you add 2 or more numbers. For further assistance, you can also use the cell references together with the formula. For as long as there are numbers in the reference cells, you can have as many numbers as possible added together. Example of SUM formula in excel =SUM(A1:B5) =SUM(5, 5) =SUM(A1, B1) COUNTA This function allows you to count the numbers of non-empty cells in a given range. What the function does is that it allows you to count cells that already have numbers together with any other characters found in the cells. The function works with all data types. Example of COUNTA formula in excel =COUNTA(A1:A10) COUNT You can use the formula function to count the numbers of the different cells in a range that have numbers in them. The formula cannot work without numbers. Example of COUNT formula in excel =COUNT(A1:A10) TRIM This is a very useful function that was designed to help users get rid of any sorts of spaces found in cells. The only exception is with single spaces between words. Do not allow yourself to pull out data from your database with extra spaces because it can wreak havoc when it comes to comparing using IF statements or VLOOKUP's. Example Excel TRIM formula =TRIM(A1) LEN Whenever this function is included in a function, you can expect it to count the number of characters in that given cell. You need to note that this function also counts the spaces between words. If you do not need to count the spaces, do not use this function. Example Excel LEN formula =LEN(A1) VLOOKUP Anyone who has used excel for a while can attest to the fact that the VLOOKUP formula is the most used formula. What the formula really does is that it looks for a value that is found in the leftmost column of a table and goes ahead and returns a value in the same row from a column that you'd have specified. Below example searches for “TextToSearch” in array of cells from A1 to B10, the last parameter FALSE is used to do exact match search. Example Excel VLOOKUP formula =VLOOKUP("TextToSearch",A1:B10,2,FALSE) AVERAGE This function will help you to calculate the average value of the series of numbers found in between the specified cells.
In this case, the function will calculate the averages of the numbers found in the cells B1 to B3 and give you an optimal result. Example Excel AVERAGE formula =AVERAGE(B1:B3) MIN This function can be used to help one calculate the lowest number in a given series of numbers. In the example above, the formula will give you the lowest number found in the series between cells B1 to B3. Example MIN in excel formula =MIN(B1:B3) MAX The MAX function helps you to find the highest number in a given series of numbers. In the given example, the function will get you the highest figure in the series between cells B1 to B3. Example MAX in excel formula =MAX(B1:B3) IF Function You can use this function to help you determine whether a given statement is true or false which can then allow you to perform a specified action based on your results. Example IF in excel formula =IF(Criteria,True value,False value) SUMIF Function More or less similar to the IF Function. The only difference is that with the SUMIF Function, after finding the values of the set criteria, it will go ahead and Sum up the values of the related cells. Example SUMIF in excel formula Below example will do the sum of all number in A1 to A25 if they are greater than 10 =SUMIF(A1:A25,">10") COUNTIF Function The function works the same way as the SUMIF Function with the exception that it counts the fields that match with one another in relation to the set criteria instead of summing them together. Below example will do the count of all number in A1 to A25 if they are greater than 10 Example COUNTIF in excel formula =COUNTIF(A1:A255,">10") AND Function Dubbed as a logical function, the AND function helps you to check specified multiple criteria and will give a TRUE value if say ALL the criteria are found to be TRUE. If that criterion is not met, it will return as false. Below example will do logical AND operation of two conditions and return a boolean value. In this case it must return TRUE Example AND in excel formula =AND(1+1=2, 3+3=6) OR Function This function is similar to the AND Function. However, the OR Function checks multiple criteria but only requires ONE statement to be true for the entire statement to be TRUE. Below example will do logical OR operation of two conditions and return a boolean value. In this case it must return TRUE Example OR in excel formula =OR(1+1=2, 3+3=6) RIGHT, LEFT, MID Function All these functions are great TEXT functions that are used for manipulating data in a given cell. With the function, you can use it to take any numbers/words in a given cell, pull it in the right or left from them and go ahead to put them in a new cell. Example RIGHT in excel formula Example to get Right part of text, below will return TEXT =RIGHT('TESTSOMETEXT',4) Example LEFT in excel formula Example to get Left part of text, below will return TEST =LEFT('TESTSOMETEXT',4) Example MID in excel formula Example to get Middle part of text, below will return SOME =MID('TESTSOMETEXT',5,4 ) Jessica Millis, an aspiring writer and editor. Also Jess is working as an educator at JMU and as a chief editor at Essaymama essay writing agency. Article Updates Article Updated on September 2021. Some HTTP links are updated to HTTPS. Updated broken links with latest URLs. Some minor text updates done. Content validated and updated for relevance in 2021.
0 notes