#Temperature mapping
Explore tagged Tumblr posts
Visit Tumblr Blog
Explore Tumblr blogs with no restrictions, modern design and the best experience.
Last Seen Tumblr Blogs


Fun Fact
Tumblr.com is the 103rd most visited website in the world.
Text
What is Temperature Mapping? A Complete Guide for Beginners
Temperature mapping is an essential procedure used across various industries to ensure that products are stored and transported within safe temperature ranges. This process is vital in maintaining the integrity of pharmaceuticals, food items, and other temperature-sensitive goods. In this guide, we'll explore the basics of temperature mapping, its importance, and how technology, like Tempmate, aids in executing this crucial task effectively. Read More Here: https://www.timessquarereporter.com/business/what-is-temperature-mapping--a-complete-guide-for-beginners
0 notes
Text
Understanding Temperature Mapping: A Critical Component of Quality Control
Temperature mapping is the process of systematically measuring and recording temperature variations within a specific environment, such as a storage facility, warehouse, or refrigerated space. This process helps to identify any hot or cold spots, ensuring that the entire area maintains the required temperature range to protect the integrity of stored products. The goal of temperature mapping is to create a comprehensive thermal profile of the area being monitored. This profile helps in understanding how temperature fluctuates over time and across different locations within the space. It’s particularly important in environments where slight temperature deviations can have significant consequences, such as in pharmaceutical storage where a change of just a few degrees can affect the efficacy of medications.
0 notes
Text
Pharmaceutical Temperature Mapping: Ensuring Product Integrity
In the world of pharmaceuticals, maintaining the integrity of products is pivotal. From research and development to distribution, each step demands precise temperature control. This is where Temperature Mapping plays a highly crucial role. It’s not just about numbers on a screen; it’s about safeguarding the health and well-being of patients who rely on these medications. Let’s delve into the world of Temperature Mapping and how it guarantees the integrity of pharmaceutical products.
READ MORE
0 notes
Photo

Temperature difference between Jan average low and Jul average high, showing the role mountains play in NW US climate
by DJCane/reddit
157 notes
·
View notes
Text

Temperature Quaker: April 2025
Highs for April ranged from 43°F on April 10 to 84°F on April 28.
12 notes
·
View notes
Text

[Image Description: A map of the fictional planet Osmos V, a planet comprised of mostly land with a scattering of inland seas, the two largest of which could each fit all of the smaller seas with room to spare. The topography of the planet is shown with colors ranging from dark green to red-orange with large areas of green denoting low-lying regions and warmer colors showing higher and higher elevations. Around most bodies of water are patches denoting areas that receive regular rainfall, with brighter shades denoting rain and dark denoting heavy rain- red for northern hemisphere summer, blue for northern hemisphere winter, and raspberry where the two overlap. All together, the rainfall zones take up at maybe 20% of the map. /End description]
Hey! Look! Osmos V has precipitation maps now! So, ya know, if you were ever wondering 'but just how dry is this desert planet'... Pretty fucking dry. If it ain't a shade of red or blue, it's fucking dry.
Mad Ben's world? Everyone else is struggling but Kevin and Manny are sat there in the sunshine like nothing's up playing fucking Go Fish.
#osmos v#osmosians#'' 'boo hoo it's a hundred degrees out and there's no water' pansies!!''#you fuckers wait until i get the temperature maps done *that's* gonna be scary#summer temps on some parts of this planet are going to be fucking deadly for anything that isn't made of fire or capable of eating heat
7 notes
·
View notes
Text

Warm and cozy
#hyper-katt art#hyper katt art#digital art#artists on tumblr#my art#art#digital illustration#my oc#doodles#just laying in bed playing Infinity Nikki on my iPad#procreate art#temperature map doodle
9 notes
·
View notes
Text
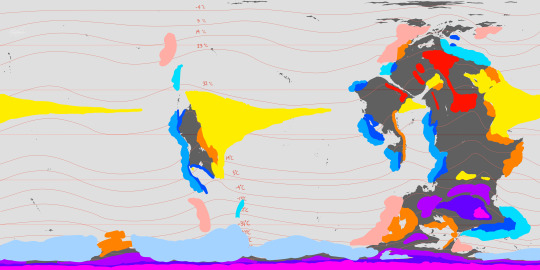
The next phase of the Ayrum project was climate, which I'll introduce with the resource that made my work possible in the first place: these datasets created by Nikolai Lofving Hersfeldt, who runs WorldBuildingPasta and shared all of this with my client and me via Panoply. These were tremendously helpful and I wouldn't be able to achieve a fraction of the final detail without them.

My own adjustment to this data begins with Surface Temperature, which came down to correcting the coastlines (I mistakenly sent in a version of the elevation map that resulted in continental shelves appearing above sea level), refining the effects of elevation, and adding a color gradient.

I was then able to combine this data into Annual Minimum, Average, and Maximum temperature maps, seen above, which was pretty useful too.
One use for the Annual Average map, for example, was providing a baseline to compare each month's data against, seen in the sequence above.

And from the Annual Minimum and Maximum maps, I was able to create a map that presents the overall range of temperatures throughout the year, which does a good job of showing just how extreme the conditions are in higher latitudes and further inland.
#digital painting#imaginary climate maps#mapmaking#imaginary maps#Ayrum#Photopea#worldbuilding#commission#long term project#Surface Temperature maps#monthly data sequence#WorldBuildingPasta#Panoply#Christopher Maida Artwork
32 notes
·
View notes
Text

youtube
#India#Pakistan#for those not in the know#Both nations are nuclear powers#Usually the USA could be depended on to help lower the temperature#But I honest to god dont think trump could find Pakistan on a map
2 notes
·
View notes
Text
Mapped: The 10 Hottest and Coldest Countries
With the summer heating up, we all know what it’s like when it’s so hot that things get uncomfortable.
Well, what if the weather were that toasty all the time? The most discussed graphic this month highlights the countries with the highest (and lowest) average temperatures.

This visualization by Visual Capitalist kicked off a debate on whether certain countries were missed in the rankings, however users were quick to point out that these are average temperatures only, and not local extremes.
For example, although the U.S. has some sweltering cities, it also has some states that get very cold especially during the winter, that bring the overall average down.
🔥🔥🔥🔥🔥🔥🔥🔥🔥🔥🔥🔥🔥
#The Hottest & Coldest #Mapped
# global solidarity #global news
#global temperature #pucex
#xpuigc
5 notes
·
View notes
Text
How Tempmate S1 Enhances Product Safety and Quality Assurance
In today's fast-moving world, ensuring product security and quality affirmation has never been more critical. Organizations across different enterprises are ceaselessly looking for inventive solutions to keep up with the respectability of their items and fulfill severe compliance guidelines. One such solution that has acquired prominence quality is the Tempmate S1.
This best in class temperature monitoring gadget is changing the game with regards to protecting item security and ensuring immaculate quality.
1. Real-time Temperature Monitoring
The Tempmate S1 is a real-time temperature monitoring gadget intended to give exact and solid data on temperature-delicate items. It is furnished with cutting edge sensors that consistently record temperature varieties during capacity and transportation. This real-time monitoring guarantees that items are kept inside the predetermined temperature range, pivotal for saving their quality and security.
2. Data Logging and Analysis
It goes beyond basic temperature monitoring. It takes into account complete data logging and analysis. Temperature data is logged at customary spans and can be effectively gotten to and examined, offering significant bits of knowledge into temperature patterns. This data can be utilized to distinguish possible issues and pursue informed choices to improve item security and quality.
3. Alerts and Notifications
One of the champion highlights of the Tempmate S1 is its capacity to give moment alerts and notifications. Assuming the temperature surpasses predefined limits, the gadget triggers quick alerts. This real-time ready framework takes into account quick activity to amend any temperature deviations, decreasing the gamble of item waste and guaranteeing item quality.
4. Easy Integration
It is intended to consistently incorporate into different capacity and transportation arrangements. Its reduced size and easy to use interface make it easy to introduce and make due. It very well may be utilized in many applications, from monitoring food and drug items to guaranteeing the security of immunizations during transportation.
5. Compliance and Documentation
Compliance with temperature-delicate item stockpiling and transportation guidelines is a first concern for organizations. It works on compliance by producing definite temperature reports. These reports are significant for recording that items have been put away and moved under the expected circumstances, guaranteeing they meet the vital security and quality norms.
6. Cost-effective Solution
Putting resources into item security and quality affirmation is an interest in the standing of your image. It gives a reasonable solution to assist you with keeping up with the best principles while limiting item misfortune because of temperature changes.
Conclusion
The Tempmate S1 is a unique advantage in the realm of item security and quality confirmation. Its real-time monitoring, data logging, and moment ready capacities offer an unrivaled degree of control and trust in keeping up with item quality. Besides, its easy to understand plan and cost-effective solutions make it a significant expansion for organizations across different ventures.
By coordinating it into your tasks, you improve item security as well as guarantee that your items reliably satisfy the greatest guidelines, supporting your standing and customer trust.
1 note
·
View note
Text
Ensure Precision and Compliance with Expert Temperature Mapping Services
At Qualistery GmbH, we offer comprehensive temperature mapping services designed to ensure precision and compliance in your storage and transportation environments. Our expert team utilizes state-of-the-art technology to accurately monitor and document temperature variations, ensuring your products remain within safe and regulatory-approved ranges. Whether for pharmaceuticals, food, or other sensitive goods, our temperature mapping solutions provide critical data for validating your processes and meeting industry standards. Trust Qualistery GmbH for reliable and efficient temperature mapping services that safeguard the integrity and quality of your products. Contact us today to learn how we can support your temperature control needs and compliance requirements.

0 notes
Text

Time to play America's favorite game show: #SpotTheColdFront!
2 notes
·
View notes
Text

Temperature Grid: 2024
The pattern is by Climbing Goat Designs, although I didn’t use their colors. I used the colors I've been using since 2018 just to be consistent. The fabric is 20 ct Lugana in the color Little Boy Blue by Zweigart.
Highs for December ranged from 15°F to 55°F
Lows ranged from 4°F to 45°F
Largest span: December 7 (High 50°F & Low 24°F) for 26 degrees
Smallest span: December 17 (High 39° & Low 33°) for 6 degrees
No, I don't live at O'Hare Int'l Airport. That's just the closest official weather station to me, yet it's still far enough away that I can't guarantee the temperature there is the same as in my town, so I didn't feel comfortable labeling it as the temperatures for my town.
#cross stitch#temperature map#climbing goat designs#finished#not!fandom#i don't know why i keep stitching things on blue fabric#my camera either wants to make the blue fabric white or the stitching all blue
20 notes
·
View notes
Text

s. s ave me, meoto…
#n o t me clinging to meoto to retain my sanity bc g o o d l o r d today was the worst#today was truly a very bad; very horrible day indeeeeeeed#man. today truly was a comedic tragedy in every way possible. i’d laugh if i were anyone else tbh#first i couldn’t start my workstation bc we were out of this cleaning acid thing.#t h e n this other branch lab sent over a precise amount of [reagent] that we needed to make the cleaning acid thing#*and* what’s worse was that they also demanded like. 1/5 of the acid we mixed. like bro. make it yourself mans.#but the worst part was when i tried to use a dropper to poke this sediment out of [tube i was supposed to be cleaning]#bUT THEN HALF OF THE DROPPER MELTED BC THAT BUGGER CAN’T HANDLE HIGH TEMPERATURES AAAAAAAAAAAAAA#stupid new droppers man. the old droppers could handle 100 degrees just fine. s o now the tube is clogged with melted plastic and it’s just.#life’s *really* great sometimes yk~~~~? (ʘ‿ʘ)#and so the night shift dude who came to take over the workstation against expectations seemed kinda pissed that i hadn’t started anything#and im just there. with my intestines wriggling about like internal abdominal worms. tryin not to cry in the face of my mistake.#while he’s fumin’ away like a freakin’ chimney or sth. like. man. no one asked you to take this workstation. you came here on your own. :(#anyway i ditched him and left for my break to calm myself down only to be approached by some random terribly lost middle aged to old lady#who was looking for directions to *somewhere* but she only spoke chinese aaaaaaaa#and i can’t read maps/i don’t even live in the area of my workplace so i have no idea if the lady managed to make it safely#but. lol. the lady showed me her message screen when she asked me for directions to her destination#and by pure coincidence the person she was texting is apparently related to someone with the same first name as me#the cons and cons of having common names man. i hope the lady managed to find her friend with the same name as me though lol#anyways. pls hw im begging. pls drop the crossfade for lxl birthday tmr i n e e d more meoto to carry on—#s o b s this is what im living for now ig. meoto………..
7 notes
·
View notes
Text

Ok I created some basic air temperature isotherm maps for Summer on Jom'Gol. While not EXACT, they should help me get a basic idea for surface temperature.
I also used a guide to add in some areas of significant temperature qualities.... cold costal areas, arid hotspots, warm water tropical gyres, cold areas, etc.
These are also very basic and not exact, but they helped me make some surface temperature calculations. Now I have to adjust my isotherms and I'm pretty close to getting on my surface temp maps !!
Working on the same thing for Winter as we SPEAK
#art#digital art#artists on tumblr#worldbuilding#jomgol#mapmaking#maps#speculative worldbuilding#temperature
6 notes
·
View notes