#UnrequitedReason
Photo

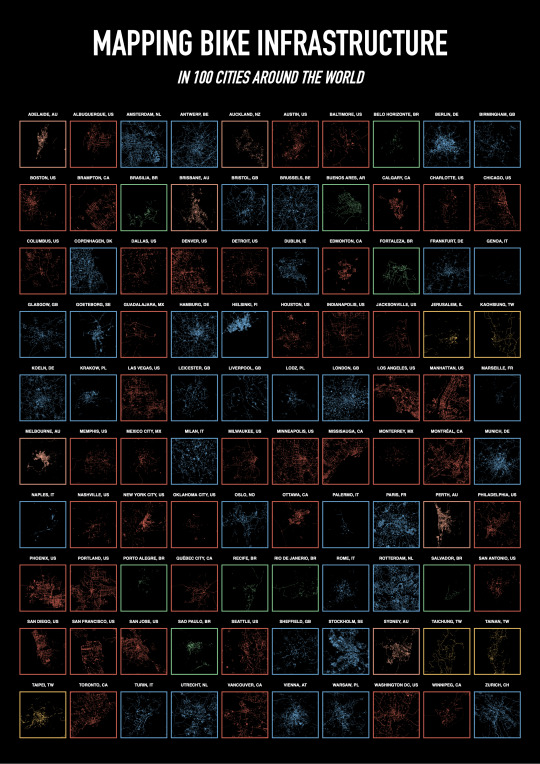
Mapping Bike Infrastructure in 100 Cities Around the World
by u/UnrequitedReason
With the surge in bicycle use over the course of the COVID-19 pandemic, municipalities around the world are experiencing a unique opportunity to transform urban spaces to be more cyclist-friendly. This includes building protected bike lanes that make it easier for cyclists to share busy city streets with cars.
Bike network density is the most important factor in encouraging people to ride bikes, with each standard deviation (about 1 kilometer of bike infrastructure per square kilometer) associated with an additional 150 bike commuters per 10,000 commuters. Bike network connectivitity is the second most imoirtant factor, with one standard deviation correlated to an additional 37 bike commuters per 10,000 commuters.
By using a combination of webscraping and computer vision techniques, we mapped bike infrastructure in 100 cities around the world, making it possible to view differences in network connectivity and density,
Source: Google Maps Tools: Python, HTML
Note: Data was limited to cities with bike lane data on Google Maps.
All data, code, and images for this analysis can be found here.
203 notes
·
View notes
Photo

Mapping Bike Infrastructure in 100 Cities Around the World
by u/UnrequitedReason
25 notes
·
View notes
Photo

"Which energy source has the least disadvantages? [OC]"- Caption by UnrequitedReason - Detail: https://ift.tt/3duQwdb. Filed Under: 1,000 ways to visualize Data. Curated by: www.eurekaking.com
0 notes
Photo

Timeline of All Five Major Extinctions via @ http://www.liveinfographic.com/ UnrequitedReason, July 07, 2019 at 03:21AM
0 notes
Photo
Mapping Bike Infrastructure in 100 Cities Around the World
by u/UnrequitedReason
With the surge in bicycle use over the course of the COVID-19 pandemic, municipalities around the world are experiencing a unique opportunity to transform urban spaces to be more cyclist-friendly. This includes building protected bike lanes that make it easier for cyclists to share busy city streets with cars.
Bike network density is the most important factor in encouraging people to ride bikes, with each standard deviation (about 1 kilometre of bike infrastructure per square kilometre) associated with an additional 150 bike commuters per 10,000 commuters. Bike network connectivity is the second most important factor, with one standard deviation correlated to an additional 37 bike commuters per 10,000 commuters.
By using a combination of web-scraping and computer vision techniques, we mapped bike infrastructure in 100 cities around the world, making it possible to view differences in network connectivity and density,
Source: Google Maps Tools: Python, HTML/CSS
Note: Data was limited to cities with bike lane data on Google Maps.
All data, code, and images for this analysis can be found here.
101 notes
·
View notes
Photo

"[OC] Which countries contribute a greater proportion of global CO2 emissions than they contribute to global GDP (scaled by PPP)?"- Caption by UnrequitedReason - Detail: https://ift.tt/2UOEhNH. Filed Under: 1,000 ways to visualize Data. Curated by: www.eurekaking.com
0 notes
Photo

"[OC] Which countries contribute a greater proportion of global CO2 emissions than they contribute to global GDP?"- Caption by UnrequitedReason - Detail: https://ift.tt/34JY4Cz. Filed Under: 1,000 ways to visualize Data. Curated by: www.eurekaking.com
0 notes
Photo

"[OC] Which countries produce a greater proportion of global CO2 emissions than their proportion of the global population?"- Caption by UnrequitedReason - Detail: https://ift.tt/2ZREXH0. Filed Under: 1,000 ways to visualize Data. Curated by: www.eurekaking.com
0 notes
Photo

"[OC] Commitments Made by the G7/8"- Caption by UnrequitedReason - Detail: https://ift.tt/2YQzwHD. Filed Under: 1,000 ways to visualize Data. Curated by: www.eurekaking.com
0 notes
Photo

"[OC] Fatal Shootings of Unarmed Suspects (Controlled by Violent Crime Arrest Rates)"- Caption by UnrequitedReason - Detail: https://ift.tt/2MHQMbV. Filed Under: 1,000 ways to visualize Data. Curated by: www.eurekaking.com
0 notes
Photo

"[OC] Proportional Geologic Timescale (with major events)"- Caption by UnrequitedReason - Detail: https://ift.tt/2Jg4lgd. Filed Under: 1,000 ways to visualize Data. Curated by: www.eurekaking.com
0 notes
Photo

"[OC] Proportional Geologic Time Scale"- Caption by UnrequitedReason - Detail: http://bit.ly/2WmRUTr. Filed Under: 1,000 ways to visualize Data. Curated by: www.eurekaking.com
0 notes
Photo

"Opioid Use by Country [OC]"- Caption by UnrequitedReason - Detail: https://ift.tt/2U56Ox2. Filed Under: 1,000 ways to visualize Data. Curated by: www.eurekaking.com
0 notes
Photo

"Catalan Referendum, Full Vote Breakdown [OC]"- Caption by UnrequitedReason - Detail: http://ift.tt/2hUPSLF. Filed Under: 1,000 ways to visualize Data. Curated by: www.eurekaking.com
0 notes
Last Seen Blogs

zeromajia07
pic of zeromajia07

ldshadowladyfans-blog
LDshadowlady

angrycookieknightduck
Алексей Александрович

dgh7747
My Fetish

ulquhime
Ulquiorra & Orihime