#VBA dashboard
Explore tagged Tumblr posts
Visit Tumblr Blog
Explore Tumblr blogs with no restrictions, modern design and the best experience.
Last Seen Tumblr Blogs


Fun Fact
Celebrities use Tumblr as well.
Text
4 Excel Functions Every Data Analyst Must Know for Smarter Data Insights

Mastering Excel is essential for any aspiring data analyst. This infographic highlights four powerful Excel functions that simplify complex data tasks, improve accuracy, and enhance decision-making. Whether you're analyzing trends, cleaning data, or creating dashboards, these must-know formulas will upgrade your analytics game. Perfect for students, professionals, and anyone looking to boost their data skills in today’s competitive job market.
📚 Learn MIS & Data analytics: Attitude Academy
📍 Visit Us: Yamuna Vihar | Uttam Nagar
📞 Call: +91 9654382235
🌐 Website: www.attitudetallyacademy.com
📩 Email: [email protected]
📸 Follow us on: attitudeacademy4u
#MIS & Data analytics#advance excel#advance MS-Excel in yamuna vihar#advance MS-Excel in uttam nagar#MIS reporting#VBA dashboard#Big data with hadoop
0 notes
Text
Opmaat gemaakt dashboard met VBA code in Excel
Ik kreeg gisteren een interessante vraag binnen over Excel, die me uitdaagde verder te kijken dan de standaard filterfuncties. Dit leidde tot het ontwikkelen van een uniek prototype, een bewijs dat er altijd ruimte is voor innovatie, zelfs in bekende tools. Mijn ervaring benadrukt hoe cruciaal het is om creatief te denken! Lees meer over de casus https://productiefplus.nl/excel-dashboarding/
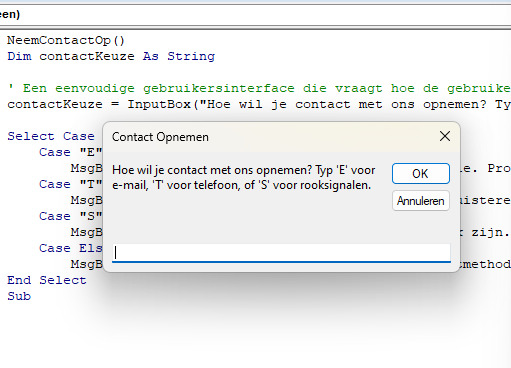
#automatisering#exel#VBA#code#filtering#dashboarding#klantwens#klantreis#proof of concept#Prototype#productiviteit#governance
0 notes
Text
What is the most awesome Microsoft product? Why?
The “most awesome” Microsoft product depends on your needs, but here are some top contenders and why they stand out:
Top Microsoft Products and Their Awesome Features
1. Microsoft Excel
Why? It’s the ultimate tool for data analysis, automation (with Power Query & VBA), and visualization (Power Pivot, PivotTables).
Game-changer feature: Excel’s Power Query and dynamic arrays revolutionized how users clean and analyze data.
2. Visual Studio Code (VS Code)
Why? A lightweight, free, and extensible code editor loved by developers.
Game-changer feature: Its extensions marketplace (e.g., GitHub Copilot, Docker, Python support) makes it indispensable for devs.
3. Windows Subsystem for Linux (WSL)
Why? Lets you run a full Linux kernel inside Windows—perfect for developers.
Game-changer feature: WSL 2 with GPU acceleration and Docker support bridges the gap between Windows and Linux.
4. Azure (Microsoft Cloud)
Why? A powerhouse for AI, cloud computing, and enterprise solutions.
Game-changer feature: Azure OpenAI Service (GPT-4 integration) and AI-driven analytics make it a leader in cloud tech.
5. Microsoft Power BI
Why? Dominates business intelligence with intuitive dashboards and AI insights.
Game-changer feature: Natural language Q&A lets users ask data questions in plain English.
Honorable Mentions:
GitHub (owned by Microsoft) – The #1 platform for developers.
Microsoft Teams – Revolutionized remote work with deep Office 365 integration.
Xbox Game Pass – Netflix-style gaming with cloud streaming.
Final Verdict?
If you’re a developer, VS Code or WSL is unbeatable. If you’re into data, Excel or Power BI wins. For cutting-edge cloud/AI, Azure is king.
What’s your favorite?
If you need any Microsoft products, such as Windows , Office , Visual Studio, or Server , you can go and get it from our online store keyingo.com
8 notes
·
View notes
Text
Career Boost 2025: Why Recruiters Love Data Analysts Who Know VBA and AI
In today's data-driven economy, companies are constantly searching for professionals who can turn raw information into meaningful insights — and do it quickly. But there's a secret weapon that makes candidates stand out: a powerful combination of VBA (Visual Basic for Applications) and Artificial Intelligence (AI).
At GVT Academy, we understand the market’s pulse. That’s why we’ve designed the Best Data Analyst Course with VBA using AI in Noida, tailored to meet real-world industry needs. But why exactly are recruiters so eager to hire analysts with these skills? Let’s break it down.
Why VBA Still Matters in 2025
Despite the surge in new technologies, VBA remains an essential tool in the data analyst’s toolkit. It enables professionals to automate Excel tasks, clean data efficiently, and build custom functions — all without needing to jump to heavier platforms.
Companies still rely heavily on Excel for their day-to-day operations. Automating reports, dashboards, or reconciliation using VBA saves both time and human effort. Recruiters appreciate candidates who don’t just work harder, but work smarter.
The Rise of AI in Data Analytics
Now add AI to the mix. Artificial Intelligence helps analysts go beyond descriptive statistics and dive into predictive and prescriptive analytics. Machine learning, pattern recognition, and AI-driven forecasting give businesses a competitive edge — and they need professionals who can implement these strategies.
Recruiters today are actively searching for hybrid-skilled data analysts — those who understand the structure of traditional tools like Excel and VBA, while also navigating AI models and automation.
What the Job Market Says
According to recent LinkedIn and Naukri hiring trends:
Data Analyst roles demanding AI skills have seen a 40% rise in listings compared to the previous year.
Excel VBA continues to appear as a top preferred skill in mid-level analytics roles.
Companies offering higher salary packages look for candidates who can automate, analyze, and interpret data — all in one.
This clearly shows the industry’s need for professionals with both practical automation (VBA) and analytical intelligence (AI) skills.
How GVT Academy Prepares You for Success
Our Best Data Analyst Course with VBA using AI in Noida is crafted with one goal: to make you job-ready from day one.
Here’s what you’ll master:
Excel and VBA: Streamline your reports, develop macros, and enhance productivity with automated workflows.
AI Tools & Techniques: Learn Python basics, data visualization, and machine learning algorithms.
SQL & Power BI: Learn how to manage data with SQL and create interactive reports using Power BI to master both data analysis and visualization.
Real-World Projects: Work on capstone projects that simulate actual industry challenges.
Interview & Placement Prep: Get trained in resume building, mock interviews, and job portal strategies.
We go beyond theory — we prepare you to excel in interviews and impress recruiters.
Give Your Career a Boost in 2025
Whether you're a graduate, a professional switching careers, or someone looking to upskill, now is the best time to invest in your future.
The Best Data Analyst Course with VBA using AI in Noida at GVT Academy is your launchpad to exciting opportunities in data analytics. You’ll gain the skills recruiters want and the confidence to stand out in interviews.
Enroll Today — Seats Are Limited!
2025 is all about speed, automation, and intelligence. Companies don’t want just number crunchers. They want data analysts who can automate with VBA and think with AI.
Join GVT Academy and become one of them.
📞 Call us now or visit our official website to learn more about upcoming batches, course fees, and free demo sessions.
1. Google My Business: http://g.co/kgs/v3LrzxE
2. Website: https://gvtacademy.com
3. LinkedIn: www.linkedin.com/in/gvt-academy-48b916164
4. Facebook: https://www.facebook.com/gvtacademy
5. Instagram: https://www.instagram.com/gvtacademy/
6. X: https://x.com/GVTAcademy
7. Pinterest: https://in.pinterest.com/gvtacademy
8. Medium: https://medium.com/@gvtacademy
#gvt academy#data analytics#advanced excel training#data science#python#sql course#advanced excel training institute in noida#best powerbi course#power bi#advanced excel
0 notes
Text
AI and Automation in Data Analyst: Why You Still Need an "Best Data Analyst Course" in 2025, 100% Job in MNC, Excel, VBA, SQL, Power BI, Tableau Projects, "Data Analyst Training Certification Course" in Delhi, 110097 - Free Alteryx, Python Data Science Certification, By SLA Consultants India,
AI and automation are dramatically reshaping the data analytics profession in 2025, but rather than making data analysts obsolete, these technologies are elevating the role and changing the essential skill set required for success. AI excels at automating repetitive tasks—such as data cleaning, basic reporting, and even some aspects of visualization—allowing analysts to focus on higher-value activities like interpreting results, influencing business strategy, and communicating insights to stakeholders. As AI-driven analytics platforms become standard in MNCs, the need for professionals who can bridge the gap between automated outputs and actionable business decisions is greater than ever.
Data Analyst Course in Delhi
Despite the speed and efficiency of AI, core technical skills remain non-negotiable for data analysts. Mastery of tools like Excel, VBA, SQL, Power BI, and Tableau continues to be in high demand, with these skills referenced in a significant share of job postings for 2025. Additionally, proficiency in advanced platforms such as Alteryx and programming languages like Python is increasingly valuable, enabling analysts to automate complex workflows and perform sophisticated analyses that go beyond what AI can do out-of-the-box. Real-world project experience—such as building dashboards, automating reports, and developing predictive models—remains a key differentiator for candidates seeking 100% job placement in top MNCs. Data Analyst Training Course in Delhi
This evolving landscape underscores the importance of enrolling in a Data Analyst Certification Course in Delhi especially those that blend foundational analytics training with exposure to AI and automation. For learners in Delhi’s 110097 area, the "Data Analyst Training Certification Course" by SLA Consultants India stands out for its comprehensive curriculum covering Excel, VBA, SQL, Power BI, Tableau, and free modules in Alteryx and Python for data science. The course emphasizes hands-on, project-based learning, ensuring students build a robust portfolio and develop the practical skills that employers value most. Moreover, strong placement support and interview preparation further increase the likelihood of securing high-paying roles in MNCs.
Data Analyst Training Course Modules Module 1 - Basic and Advanced Excel With Dashboard and Excel Analytics Module 2 - VBA / Macros - Automation Reporting, User Form and Dashboard Module 3 - SQL and MS Access - Data Manipulation, Queries, Scripts and Server Connection - MIS and Data Analytics Module 4 - MS Power BI | Tableau Both BI & Data Visualization Module 5 - Free Python Data Science | Alteryx/ R Programing Module 6 - Python Data Science and Machine Learning - 100% Free in Offer - by IIT/NIT Alumni Trainer
Ultimately, while AI and automation are transforming the data analytics field, they are also creating new opportunities for those who are adaptable, tech-savvy, and committed to continuous learning. Certification from a reputable institute like SLA Consultants India not only validates your technical expertise but also demonstrates your ability to leverage the latest tools and methodologies in a rapidly changing environment. By mastering both classic analytics tools and emerging AI-driven platforms, you can future-proof your career, secure 100% job placement in leading organizations, and play a pivotal role in shaping the data-driven strategies of tomorrow. For more details Call: +91-8700575874 or Email: [email protected]
0 notes
Text
Build a Dynamic Dashboard Using VBA and Excel
In today’s fast-paced business world, data visualization and automation have become essential tools for professionals. One of the most powerful ways to combine both is by creating dynamic dashboards using VBA in Excel. With the right VBA (Visual Basic for Applications) skills, you can automate data processing and build interactive dashboards that update with just one click.
In this blog, we'll explore how you can build a dynamic Excel dashboard using VBA, step-by-step. We’ll also show you how you can upgrade your skills with expert training from Innozant Institute, a leading name in smart tech learning.
🧩 What is a Dynamic Dashboard?
A dynamic dashboard is an interactive visual representation of your data that updates in real-time or with minimal manual effort. It includes charts, pivot tables, buttons, drop-downs, and reports that respond to user inputs like date selection, product filter, or region.
Unlike static reports, dynamic dashboards can be reused, refreshed, and reused with just a few clicks. And when combined with Excel VBA automation, they become even more powerful.
🛠️ Why Use VBA in Dashboards?
While Excel’s native tools like PivotTables and slicers are helpful, VBA offers added flexibility. Here’s what VBA can do:
Automate data import and cleanup
Dynamically refresh charts and PivotTables
Hide/show sheets, rows, and columns based on selections
Trigger actions with buttons or UserForms
Save or send dashboard reports in PDF or email
In short, VBA gives life to your static Excel files and makes your dashboards dynamic and intelligent.
📊 Step-by-Step: Build a Dynamic Dashboard Using VBA
Let’s look at how to build a simple yet dynamic sales dashboard using Excel and VBA.
Step 1: Prepare the Data
First, get your data ready. It could be from an Excel sheet, a database, or even an imported CSV file. Make sure it’s well structured — rows for records and columns for fields like Date, Region, Product, Sales, etc.
Step 2: Insert PivotTables and Charts
Use Excel’s built-in PivotTable feature to summarize your data — total sales by region, top products, monthly sales trends. Then, insert PivotCharts based on these tables.
To make the dashboard dynamic, we’ll now connect it with VBA.
Step 3: Add Form Controls (Buttons, Drop-downs)
Go to the Developer Tab in Excel and insert buttons and drop-downs. For example:
Combo box to select Region
Button to refresh data
Button to export dashboard as PDF
Name these controls so you can reference them in your VBA code.
Step 4: Open VBA Editor and Write Code
Press ALT + F11 to open the VBA editor. Create a new module and add code like:
Sub RefreshDashboard()
Sheets("Dashboard").PivotTables("SalesPivot").PivotCache.Refresh
MsgBox "Dashboard Updated!"
End Sub
You can also automate chart updates, formatting, and data filters. Connect your buttons to the macros via "Assign Macro."
Step 5: Add Export or Email Option
Want to share your dashboard? Try this code:
Sub ExportDashboardToPDF()
Sheets("Dashboard").ExportAsFixedFormat Type:=xlTypePDF, Filename:="Sales_Report.pdf"
MsgBox "Dashboard Exported as PDF!"
End Sub
This allows users to download or email the dashboard as a professional PDF report — all from within Excel.
Step 6: Build a UserForm for Advanced Control
Using a VBA UserForm, you can let users select multiple filters (like date range, region, or category) and click a button to view updated results. This adds a sleek, app-like feel to your Excel file.
🎯 Real-World Uses of Dynamic Dashboards
Sales Teams: Track targets, product performance, and regional trends
HR Departments: Monitor hiring status, attrition, and employee engagement
Finance Teams: Compare monthly expenses, profits, and forecasts
Project Managers: View project timelines, milestones, and risks
With just a bit of VBA, your Excel file becomes a powerful business intelligence tool.
📚 Learn Excel VBA Dashboard Design at Innozant Institute
Want to master the art of Excel VBA dashboards? Join Innozant Institute, the fastest-growing training hub for data, digital, and tech skills. Our Excel VBA course covers:
Macro recording and editing
VBA syntax, loops, and conditions
Working with charts, forms, and events
Creating real-time dashboards
Automating reports and emails
✅ Live Projects ✅ Expert Trainers ✅ Hybrid (Online + Offline) Classes ✅ Placement Support
Whether you’re a student, working professional, or business owner, Innozant Institute can help you upgrade your skills and boost your career.
🚀 Final Thoughts
Creating a dynamic dashboard using VBA in Excel is not only fun but also incredibly useful in real-world business situations. It gives you more control, automation, and speed.
If you want to go beyond the basics and become an Excel automation expert, start learning VBA today — and there’s no better place than Innozant Institute to begin that journey.
0 notes
Text
Excel Like a Pro: The Ultimate Guide to Microsoft Excel Mastery
If you've ever felt overwhelmed looking at an Excel spreadsheet, you're not alone. Microsoft Excel can look intimidating with all its formulas, charts, tables, and tabs. But here’s the thing — once you master it, Excel becomes one of the most powerful tools you’ll ever use. Whether you're managing personal finances, analyzing data, or building dashboards for work, Excel has you covered.
So, how do you go from being an Excel rookie to someone who uses pivot tables in their sleep?
Simple. By learning from the Microsoft Excel: Ultimate Mastery from Beginner to Pro course — a comprehensive program designed to turn even the most hesitant users into Excel power users.
Let’s break down why this course is worth your time and how it can transform your skills from basic to brilliant.
Why Excel Mastery Matters in 2025 (and Beyond)
Excel is not just a tool. It’s practically a language spoken across all industries — from finance and marketing to healthcare and logistics. Here's what makes it essential:
Universal Application: Almost every job requires some level of data entry, reporting, or analysis.
Efficiency & Productivity: Mastering Excel helps you complete tasks faster and more accurately.
Career Advancement: Proficiency in Excel is a highly sought-after skill that can help you stand out.
Smarter Decision Making: With Excel, you can visualize data, forecast trends, and make data-driven decisions.
So, whether you're job hunting, starting a business, or looking to automate repetitive tasks, mastering Excel is a smart move.
What Makes This Excel Course So Effective?
There are tons of Excel tutorials out there, so why choose this one? The Microsoft Excel: Ultimate Mastery from Beginner to Pro course on Korshub is different. Here’s how:
✅ All-in-One Learning Path
Instead of bouncing between YouTube videos and random blog posts, this course gives you a structured, progressive roadmap. It starts with the basics like formatting cells and quickly moves into advanced territory like macros and data analysis.
✅ Hands-On Learning with Real-Life Examples
You won’t just learn how to use VLOOKUP or SUMIF — you’ll use them in real-world scenarios that simulate actual workplace tasks. That means what you learn is immediately applicable.
✅ Latest Excel 2021 Features Covered
With tools and techniques updated for Microsoft Excel 2021, this course ensures you're learning the most relevant and up-to-date content. Features like dynamic arrays, XLOOKUP, and improved charting functionalities are all part of the package.
✅ Lifetime Access with Future Updates
Once enrolled, you’ll have lifetime access to the course. Whenever there’s a new Excel update, you’ll be the first to know and learn how to use it.
What You’ll Learn — A Peek into the Curriculum
Here’s a quick overview of the skills you'll gain from beginner to pro level:
🟢 Beginner Essentials
Navigating Excel’s interface
Formatting cells and worksheets
Basic formulas and functions (SUM, AVERAGE, COUNT)
Sorting and filtering data
Creating and formatting simple charts
🔵 Intermediate Proficiency
Conditional formatting
Data validation
Pivot tables and Pivot charts
Logical functions like IF, AND, OR
Lookup functions (VLOOKUP, HLOOKUP, XLOOKUP)
🟣 Advanced Excel Techniques
Data visualization dashboards
Advanced charts (combo, waterfall, histogram)
What-If analysis (Goal Seek, Scenario Manager)
Named ranges and data tables
Working with large datasets
🔴 Excel Power Tools
Power Query & Power Pivot
Macros and VBA basics
Automating reports
Connecting Excel to other data sources
Advanced data modeling and forecasting
Real-World Applications: How Excel Helps You Every Day
You might be wondering, "Will I really use all this?" The short answer: YES.
Here’s how Excel shows up in real life:
For Students: Organize study schedules, calculate GPA, track expenses.
For Freelancers: Invoice clients, calculate earnings, manage projects.
For Office Workers: Analyze sales data, create performance dashboards, generate automated reports.
For Small Business Owners: Track inventory, monitor cash flow, create financial projections.
And the best part? Once you’ve taken the Microsoft Excel: Ultimate Mastery from Beginner to Pro course, you’ll be doing all this with ease and speed.
Who Is This Course For?
This course is designed for everyone — regardless of your background or experience. Here's who will benefit most:
Absolute Beginners: No prior Excel knowledge needed.
Intermediate Users: Fill in knowledge gaps and explore new features.
Business Professionals: Improve productivity and data analysis.
Job Seekers: Boost your resume with a high-demand skill.
Entrepreneurs: Manage and grow your business more efficiently.
Key Features That Set This Course Apart
🌟 20+ Hours of Engaging Video Content
Packed with digestible lessons that keep you motivated.
🌟 Downloadable Resources & Workbooks
Practice what you learn with ready-to-use files.
🌟 Quizzes & Real-World Projects
Put your skills to the test with interactive assignments.
🌟 Certificate of Completion
Showcase your achievement and add it to your LinkedIn profile.
What Students Are Saying
"I thought Excel was only for accountants. After taking this course, I use it for everything — budgeting, planning, even my side hustle. Totally worth it!" — Priya M., Freelancer
"I landed a job partly because of the Excel dashboard I built as part of this course. Hiring managers were impressed!" — Jason T., Data Analyst
"This course is like having a mentor walk you through Excel step-by-step. I finally understand formulas, charts, and even macros!" — Alisha R., College Student
How to Get Started
Ready to transform how you work with data?
It only takes a few minutes to enroll in the Microsoft Excel: Ultimate Mastery from Beginner to Pro course. From there, you can start learning at your own pace — pause, rewind, practice — and gradually build mastery.
Excel Tips to Keep in Your Back Pocket
To give you a head start, here are a few tips that’ll instantly improve your Excel game:
CTRL + Arrow Keys: Jump quickly across large datasets.
Use Named Ranges: They make formulas easier to read and manage.
Combine Functions: Nest IF, AND, OR for powerful logical analysis.
Flash Fill: Excel predicts and completes repetitive entries for you.
Use Tables for Dynamic Ranges: Automatically updates data references when new rows are added.
Of course, all these tricks (and hundreds more) are covered inside the course!
Final Thoughts: Excel Isn’t Optional Anymore
Whether you're building your career, managing your own business, or simply trying to stay organized, Excel is one skill that pays for itself many times over. And you don’t need to spend months trying to figure it all out.
With the Microsoft Excel: Ultimate Mastery from Beginner to Pro course, you’ll go from confused to confident — unlocking the full power of spreadsheets, dashboards, and data automation.
0 notes
Text
Advanced Excel Course – Master the Tools Top Professionals Use Elevate your Excel skills and become a power user with our in-depth Advanced Excel course, designed for learners who are ready to move beyond the basics and tackle real-world data challenges.
Whether you're a working professional, a business owner, a student, or someone looking to upskill, this course is your gateway to becoming Excel-proficient in data analysis, automation, and reporting.
What You’ll Learn:
Master complex formulas like VLOOKUP, HLOOKUP, INDEX-MATCH, XLOOKUP, and dynamic arrays.
Understand nested IF statements, logical operators, and advanced cell referencing.
Create insightful dashboards using PivotTables, slicers, and PivotCharts.
Automate manual processes using Macros and foundational VBA scripting.
Leverage Power Query for data import, cleanup, transformation, and combination.
Use Power Pivot to model data from multiple sources and create powerful reports.
Implement data validation tools to control inputs and reduce human error.
Build interactive financial models, trackers, and custom templates.
Apply What-If Analysis, Solver, and Scenario Manager for smarter decision-making.
Use conditional formatting to highlight data trends, exceptions, and KPIs.
Explore advanced charting techniques to make your data presentations impactful.
Analyze large datasets efficiently using advanced filtering and dynamic ranges.
Learn keyboard shortcuts and productivity hacks to work faster in Excel.
Course Features:
100% recorded sessions – Learn at your own pace, on your schedule.
Step-by-step demonstrations with practical examples and downloadable files.
Lifetime access to all course content and future updates.
Certificate of completion to showcase your skills professionally.
Support via email or discussion forum for doubts and queries.
Suitable for Excel 2016, 2019, 2021 & Microsoft 365 versions.
Ideal for roles in data analysis, finance, HR, operations, sales, and consulting.
By the end of this course, you’ll confidently tackle advanced data tasks and streamline your workflow, helping you stand out in interviews, promotions, and high-impact projects.
Start learning today at www.mwcedu.com and transform your Excel skills into career assets.

#microsoft excel excel from beginner to advanced#advance excel course#advanced excel course online with certificate#advanced excel course online#advanced excel course with certification#excel beginner to advanced course#advance excel certification course#Oline learning platform
0 notes
Text
Excel Outsourcing vs. In-House: What Growing Companies Need to Understand
Scaling a business is exciting, but it also means making tough decisions—especially when it comes to managing data and automating workflows. Do you hire an Excel expert for full-time support, or do you go the Excel outsourcing route and bring in specialists only when needed?
Truth is, both approaches have their perks! While in-house teams provide dedicated attention, outsourcing offers flexibility and cost savings. So, what’s the best move for a growing company? Let’s dive in.
In-House Excel Experts: Pros and Cons
Having an internal Excel specialist means immediate access to expertise—no waiting, no searching, just a dedicated resource ready to tackle reports, analysis, and workflow automation.
Pros of In-House Specialists
Deep Business Knowledge – They understand your company’s data inside and out.
Constant Availability – No need to schedule external consultants.
Data Security – Confidential files stay within the organization.
Cons of In-House Specialists
High Overhead Costs – Salary, benefits, and workspace add up fast.
Limited Skill Set – One person can’t be an expert in every Excel feature.
Scalability Issues – As projects grow, you might need more specialized help.
For companies managing Airtable consulting projects alongside Excel workflows, an internal expert can certainly help—but only to a point.
Outsourcing Excel Work: Pros and Cons
On the flip side, Excel outsourcing offers access to specialized expertise without the commitment of hiring full-time staff. Need a custom automation? A business process automation consulting expert can set it up without training an internal employee!
Pros of Outsourcing
Cost-Effective – Pay only for the services you need.
Access to High-Level Expertise – Find specialists in VBA, dashboards, and automation.
Scalability – Bring in extra help when workloads spike.
Cons of Outsourcing
Less Immediate Availability – External consultants work on multiple projects.
Onboarding Time – It takes a moment to align them with your needs.
Data Security Concerns – Sharing files externally requires extra precautions.
If your business needs complex Excel automation and consulting Excel experts who can integrate workflows with platforms like Airtable, outsourcing is a great choice.
Making the Right Decision
Ultimately, it boils down to your company’s needs. If data management is core to daily operations, hiring an in-house specialist may be worth the investment. But if your projects vary in complexity or frequency, outsourcing provides flexibility without the overhead.
Want the best of both worlds? Consider a hybrid approach—keep a generalist in-house while outsourcing specialized tasks like Excel automation, Airtable consulting, and business process automation consulting when necessary.
Conclusion: Work Smarter, Not Harder
Growing companies can’t afford inefficiencies. Whether you hire an Excel expert or outsource Excel work, optimizing workflows saves time, reduces errors, and boosts productivity.
Need expert Excel consulting? Find a business process automation consultant today and transform the way your business handles data!
0 notes
Text
Beyond Basics: Advanced Excel for Careers

When you think of Microsoft Excel, you might picture simple spreadsheets for organizing data or basic calculations. Yet, in almost all industries, Excel is far more than a mere table. It is data analysis, reporting, and automation tool. Going beyond the basics, becoming an advanced Excel pro leads to a career fast track, converting an ordinary data user to the master.
Companies across industries are drowning in data in today's data-driven world. They require workers who can handle data, extract insights, display information well, and automate processes. Advanced Excel skills thus make you an awesome asset in the finance firms, marketing agencies, HRs, and operations departments.
Why Advanced Excel Skills are Resisted in Career Growth
Many would consider basic Excel skills to be the only requirement of a job; however, the reality is that further potentials of Excel are increasingly sought after by employers. Here is why getting the hang of advanced Excel is crucial:
Data Analysis Prowess: You are able to analyze big sets of data instantaneously; identify trends; and come up with useful business decisions.
Report Creation: Develop fully interactive reports and dashboards that provide a visual representation of complex information to stakeholders.
Automation & Efficiency: Consider the fascination of automating repetitive tasks anymore and save human beings hours of work while few errors can occur due to manual operations.
Problem-Solving: Advanced functions can be used to model complex business problems, from financial decision-making to resource allocation.
Employability: Advanced Excel skills appear on almost every job listing and are sometimes considered the top requirement for many.
Key Advanced Excel Skills to Master
If you want to truly move beyond the basics, then consider sharpening your skills around these powerful features:
Pivot tables and Pivot charts: Learn to summarize, analyze, explore, and present large amounts of data interactively and flexibly. These are best used for quick reporting and spotting trends.
Advanced functions (VLOOKUP, HLOOKUP, INDEX, MATCH, IF, SUMIFS, COUNTIFS): Beyond simple sums, these allow complex lookups and conditional aggregations or tests over multiple criteria. INDEX and MATCH are a particularly powerful combo.
Data Validation: Do data cleansing by defining rules that restrict what can be entered in a cell, thus preventing errors and promoting inconsistency.
Conditional Formatting: Highlight data based on given criteria; this will help trends, exceptions, and anomalies stand out at a glance.
What-If Analysis (Goal Seek, Scenario Manager, Data Tables): Play with perhaps various scenarios and make predictions for expected results once variables have been changed; this is very important for planning and decision-making.
Macros & VBA (Visual Basic for Applications): Record or write custom code, relying heavily on automation to eliminate tedious manual tasks, create custom functions, and develop very powerful user interfaces within the Excel environment itself-this is an efficiency game-changer.
Power Query & Power Pivot: These built-in tools allow for advanced cleansing and transformations and creation of sophisticated data models, working with a much bigger volume of data compared to a traditional Excel file.
Career Roles Where Advanced Excel Shines
Having those skills opens countless career openings:
Financial Analyst: This is important for financial modeling, budgeting, forecasting, and investment analysis.
Business Analyst: For market research, performance measurement, and strategic planning.
Data Analyst: For cleaning, analyzing, and making data easier to understand from various sources.
Project Manager: For progress tracking, resource management, and detailed scheduling.
Marketing Analyst: Measuring campaign performances, analyzing customer data, and trends in sales.
Operations Manager: For workflow optimization, inventory handling, and logistics conversation.
Your Road to Advanced Excel Mastery
If you aspire to level up, taking an Advanced Excel course or a Data Analytics course in Ahmedabad is strongly recommended. These programs dive deep into advanced functions, tools, and best practices, typically going further with actual project executions to churn out a mature portfolio. For a student seeding for their first job or a working professional looking to rank higher, investing in advanced Excel skills will pay dividends through their entire career. Become the Excel expert your workplace needs. At that stage, your livelihood will be fostered by your flourish!
Contact us
Call now on +91 9825618292
Visit Our Website: http://tccicomputercoaching.com/
#AdvancedExcel#ExcelSkills#CareerGoals#DataAnalysis#BusinessTools#Productivity#ExcelTips#OfficeSkills#TCCI
0 notes
Text
Advanced Excel for Data Analytics Online Coaching by Gritty Tech
In the era of digital transformation, data has become the foundation for strategic decision-making across industries. Excel remains one of the most powerful tools for data manipulation, visualization, and analysis. For professionals, students, and analysts alike, learning Advanced Excel for data analytics online coaching can be a career-defining decision. Gritty Tech offers a premier platform for mastering this essential skill with an affordable, high-quality learning experience For More…

Why Advanced Excel for Data Analytics Matters
Advanced Excel isn't just about formulas—it's about understanding data at a granular level. From pivot tables to complex VBA automation, Excel helps data professionals make informed decisions faster. By enrolling in Advanced Excel for data analytics online coaching, you position yourself at the forefront of business intelligence and decision-making.
What Makes Gritty Tech the Preferred Choice?
Gritty Tech stands apart by combining expertise, affordability, and global reach. Here’s what you can expect:
1. High-Quality Learning Experience
Our curriculum is designed by industry experts who understand the practical needs of data analysts. Each module of the Advanced Excel for data analytics online coaching program is crafted to build real-world skills.
2. Affordable and Transparent Pricing
Gritty Tech is committed to making advanced education accessible. Our flexible payment plans—monthly or session-based—allow learners from diverse backgrounds to access top-tier content without financial strain.
3. Global Network of Tutors
With a presence in over 110 countries, Gritty Tech offers a diverse faculty of professional, experienced tutors who are well-versed in international data standards and applications. This makes our Advanced Excel for data analytics online coaching ideal for a global audience.
4. Easy Refunds and Tutor Replacement
Customer satisfaction is a priority. If for any reason a learner is unsatisfied, we offer easy refund options and tutor replacements to ensure a seamless educational experience.
Course Overview
Our Advanced Excel for data analytics online coaching includes:
Data cleaning and preparation
Pivot tables and pivot charts
Advanced formulas and functions
Conditional formatting techniques
Power Query and Power Pivot
Data visualization best practices
Macros and VBA for automation
Each topic is covered in detail with hands-on examples to reinforce learning.
Who Should Enroll?
This course is ideal for:
Data analysts and aspiring professionals
Business managers who rely on data reports
Students in business, economics, or IT
Freelancers offering data analysis services
No prior experience in data analytics is necessary, though basic Excel knowledge is recommended.
Learning Outcomes
After completing the Advanced Excel for data analytics online coaching, you will be able to:
Manage and analyze large datasets efficiently
Automate routine tasks with VBA and macros
Generate interactive dashboards and reports
Apply statistical tools directly within Excel
Optimize data workflows using Power Query
Additional Keywords Integrated
Excel data analytics certification
Learn Excel data tools
Online Excel coaching for analysts
Advanced Excel training for professionals
Excel for business intelligence
These terms naturally support the main keyword and enhance semantic SEO.
Benefits of Choosing Gritty Tech
Interactive Learning: Live sessions, real-time query resolution
Flexible Scheduling: Attend classes as per your availability
Progress Tracking: Monitor your growth and revisit past modules
Certification: Receive a globally recognized certificate upon completion
Frequently Asked Questions
1. What is Advanced Excel for data analytics online coaching? Advanced Excel for data analytics online coaching is a structured training program that helps learners master Excel features essential for analyzing and visualizing data.
2. Who can join Advanced Excel for data analytics online coaching? Anyone interested in data analytics—from beginners to experienced professionals—can benefit from this course.
3. What tools are covered in Advanced Excel for data analytics online coaching? We cover Power Query, Pivot Tables, Charts, VBA, Macros, and more to give you a complete analytical toolkit.
4. Is Advanced Excel for data analytics online coaching suitable for remote learners? Yes, the course is entirely online and accessible globally, making it ideal for remote learners.
5. What makes Gritty Tech’s Advanced Excel for data analytics online coaching unique? Our course combines practical knowledge, global tutor access, and affordability, ensuring a top-quality experience.
6. How long is the Advanced Excel for data analytics online coaching? Depending on your pace, it can be completed in 4 to 8 weeks, with lifetime access to materials.
7. Will I get a certificate after completing the Advanced Excel for data analytics online coaching? Yes, Gritty Tech provides a recognized certificate that enhances your professional credibility.
8. Can I request a tutor replacement during the Advanced Excel for data analytics online coaching? Absolutely. We prioritize your satisfaction and offer hassle-free tutor changes.
9. Is there a refund policy for Advanced Excel for data analytics online coaching? Yes, our easy refund policy ensures that you're covered in case you wish to discontinue for any reason.
10. How often is the curriculum of Advanced Excel for data analytics online coaching updated? We revise our content regularly to include the latest Excel features and analytics trends.
Conclusion
Mastering Excel is more than just a technical skill—it’s a business advantage. Gritty Tech’s Advanced Excel for data analytics online coaching program is designed to equip you with practical, job-ready skills that make a measurable impact. With expert tutors, affordable plans, and global reach, Gritty Tech is your ideal partner in professional growth. Start your journey today and transform how you analyze data.
0 notes
Text
Unlock Your Potential with the Best Advanced Excel Course in Pitampura

In today’s data-driven world, the ability to efficiently manage and analyze information is more crucial than ever. For professionals looking to enhance their skills, the Advanced Excel Course in Pitampura at DICS Innovatives stands out as a premier choice. This meticulously crafted program not only aims to elevate your spreadsheet skills but also empowers you to interpret and manipulate data with exceptional ease and efficiency.
Why Choose DICS Innovatives?
DICS Innovatives has established itself as a leader in professional training, offering a range of courses designed to meet the demands of the modern workplace. The Advanced Excel Course is particularly noteworthy, as it is tailored for individuals who already have a foundational understanding of Excel but wish to delve deeper into its advanced functionalities.
Comprehensive Curriculum
The course covers an extensive range of topics, ensuring that participants gain a well-rounded understanding of Excel’s advanced features. Key areas of focus include:
Data Analysis: Learn to utilize tools such as PivotTables and Power Query for effective data manipulation.
Advanced Formulas: Master complex formulas, including nested functions and array formulas, to perform intricate calculations.
Data Visualization: Discover how to create dynamic charts and dashboards that present data in a visually appealing and informative manner.
Automation with Macros: Understand how to automate repetitive tasks using VBA (Visual Basic for Applications), saving time and reducing errors.
Data Management: Gain skills in data validation, conditional formatting, and using advanced filtering techniques to manage large datasets efficiently.
Experienced Instructors
One of the key advantages of enrolling in the Advanced Excel Course at DICS Innovatives is access to highly experienced instructors. They bring a wealth of knowledge from various industries, providing real-world insights and practical applications of the skills taught. This hands-on approach ensures that you not only learn theoretical concepts but also how to apply them in your professional environment.
Flexible Learning Options
Understanding the busy schedules of professionals, DICS Innovatives offers flexible learning options. Participants can choose from weekday or weekend classes, allowing you to balance your coursework with personal and professional commitments. Additionally, the course is structured to accommodate both in-person and online learning, making it accessible to a broader audience.
Who Should Enroll?
The Advanced Excel Course in Pitampura is ideal for:
Business Analysts: Enhance your ability to analyze data and provide actionable insights.
Finance Professionals: Improve your financial modeling and forecasting skills.
Data Scientists: Learn to preprocess and analyze data more effectively.
Administrative Professionals: Streamline your workflow and improve efficiency in data management tasks.
Whether you are looking to advance in your current role or make a career switch, this course equips you with the skills necessary to excel in various fields.
Benefits of Advanced Excel Skills
Investing in advanced Excel skills offers numerous benefits:
Increased Efficiency: Automating tasks and utilizing advanced functions can significantly reduce the time spent on data processing
.
Enhanced Decision-Making: With better data analysis capabilities, you can make more informed decisions that drive business success.
Career Advancement: Proficiency in Excel is often a prerequisite for many high-level positions, making this course a valuable addition to your resume.
Testimonials from Alumni
Don’t just take our word for it—here’s what some of our alumni have to say about their experience:
Rahul S.: "The Advanced Excel Course at DICS Innovatives transformed my approach to data handling. I can now analyze complex datasets with ease!"
Anjali K.: "The instructors were fantastic! Their real-world examples made the learning process engaging and applicable."
Enrollment Information
Ready to take your Excel skills to the next level? Enroll in the Advanced Excel Course in Pitampura at DICS Innovatives today! Visit our website for more details on course schedules, fees, and registration.
ConclusionIn a world where data is king, mastering advanced Excel functionalities is a game-changer. The Advanced Excel Course in Pitampura at DICS Innovatives is your gateway to unlocking new opportunities and enhancing your professional skill set. Empower yourself with the tools and knowledge to navigate complex data challenges and drive informed decision-making. Don’t miss out—invest in your future today!
0 notes
Text
Advanced Excel Certification | Online Excel Course
Take your spreadsheet skills to the next level with our Advanced Excel Certification course—designed for professionals who want to become Excel experts. This course dives deep into advanced Excel functions and tools, including pivot tables, advanced formulas (like INDEX-MATCH, IFERROR, and array formulas), data validation, scenario analysis, and more. You’ll also learn to build interactive dashboards, use Power Query for data transformation, and get introduced to automation using macros and VBA. Whether you're in finance, accounting, marketing, data analysis, or operations, this course equips you with the skills to work faster, smarter, and more effectively with data. Real-world projects and step-by-step video tutorials ensure a practical learning experience. Upon completion, you’ll receive an industry-recognized certification that enhances your resume and sets you apart in today’s competitive job market. Learn at your own pace with flexible online access and expert support throughout the course. Enroll today and become a certified advanced Excel professional.
0 notes
Text
From Excel to AI: Your Complete Learning Path as a Data Analyst

Presented by GVT Academy – Shaping the Data Leaders of Tomorrow
In today’s digital age, data isn’t just numbers—it’s the new oil that powers decisions, strategy, and growth across every industry. But turning raw data into meaningful insights requires more than just curiosity—it demands skills. At GVT Academy, we’ve crafted a unique and future-ready program: the Best Data Analyst Course with VBA and AI in Noida. This isn't just a course—it's a career transformation journey, taking you step-by-step from Excel basics to cutting-edge AI-powered analysis.
Let us walk you through what your learning path looks like at GVT Academy.
Step 1: Get Started with Excel – Your First Building Block
Every powerful data analyst starts with Excel. It may look like a simple spreadsheet tool, but in the hands of a trained analyst, it becomes a powerful platform for data visualization, reporting, and decision-making.
At GVT Academy, you begin your journey by:
Learning data entry, formatting, and filtering
Creating smart dashboards using charts and pivot tables
Using advanced formulas like VLOOKUP, INDEX/MATCH, IFERROR, etc.
Harness Excel’s native tools to speed up your data analysis process
Our real-time business examples ensure you don’t just learn Excel—you master it for practical, real-world use.
Step 2: Automate Repetitive Work with VBA (Visual Basic for Applications)
Here’s where the magic begins! Once you're confident in Excel, we introduce VBA, Microsoft’s powerful automation language.
With VBA, you’ll:
Streamline processes such as generating reports and preparing data
Develop personalized macros to cut down on manual work and save time
Build user-friendly forms for data collection
Control multiple workbooks and sheets with a single click
At GVT Academy, we teach you how to think like a coder—even if you’ve never written a single line of code before.
Step 3: Master SQL – Unlock the Power Behind Every Database
Data often lives in massive databases, not just spreadsheets. So next, you’ll learn SQL (Structured Query Language)—the language every data analyst must know.
You will:
Understand database structure and relationships
Write queries to fetch, filter, and sort data
Join multiple tables to generate complex reports
Practice on real-time datasets from business domains
By now, you’re no longer just a data user—you’re a data wrangler!
Step 4: Visualize Insights with Power BI
Today, no one wants plain numbers—they want interactive dashboards that tell stories. With Microsoft Power BI, you’ll build visually stunning reports and dashboards that decision-makers love.
In this phase of your journey:
Explore techniques to pull, process, and structure data efficiently for analysis
Apply DAX (Data Analysis Expressions) to perform complex data calculations
Design visual dashboards with filters, slicers, and KPIs
Connect Power BI with Excel, SQL, and web APIs
With Power BI, you’ll bring your analysis to life—and your insights will never go unnoticed.
Step 5: Embrace Python – The Language of AI and Machine Learning
Now that your foundations are solid, it’s time to take the leap into AI-powered analytics. At GVT Academy, we introduce you to Python, the most in-demand language for data science and artificial intelligence.
Here, you’ll explore:
Data analysis using Pandas and NumPy
Data visualization with Matplotlib and Seaborn
Predictive modeling with Scikit-learn
Real-world applications like sales forecasting, sentiment analysis, and fraud detection
You don’t just learn Python—you use it to solve real business problems using AI models.
Step 6: Capstone Projects – Apply Everything You’ve Learned
What makes our course stand out is the final touch—live industry-based capstone projects.
You’ll:
Solve actual data problems from marketing, HR, sales, or finance
Use all tools—Excel, VBA, SQL, Power BI, and Python—in an integrated project
Present your insights just like a pro analyst in a corporate boardroom
Receive expert career guidance and tailored feedback from seasoned professionals
By the end of the course, your portfolio will do the talking—and employers will take notice.
Why Choose GVT Academy for Your Data Analytics Journey?
✅ Industry-relevant curriculum built by data professionals
✅ Hands-on training with real-world projects
✅ Small batch sizes for personal attention
✅ 100% placement assistance with interview preparation
✅ Choose from online or classroom sessions—designed to fit your routine
Thousands of students have already launched their careers with us—and you could be next.
Ready to Begin?
🚀 Step into the data revolution—shape the future, don’t just observe it.
Whether you’re a student, fresher, working professional, or someone switching careers, this is your complete learning path—from Excel to AI.
Unlock your potential with GVT Academy’s Best Data Analyst Course using VBA and AI – gain future-ready skills that set you apart in the evolving world of data.
👉 Take the first step toward a smarter career – enroll today!
1. Google My Business: http://g.co/kgs/v3LrzxE
2. Website: https://gvtacademy.com
3. LinkedIn: www.linkedin.com/in/gvt-academy-48b916164
4. Facebook: https://www.facebook.com/gvtacademy
5. Instagram: https://www.instagram.com/gvtacademy/
6. X: https://x.com/GVTAcademy
7. Pinterest: https://in.pinterest.com/gvtacademy
8. Medium: https://medium.com/@gvtacademy
#gvt academy#data analytics#advanced excel training#data science#python#sql course#advanced excel training institute in noida#best powerbi course#power bi#advanced excel#vba
0 notes
Text
The Rise of Remote Data Analyst Jobs: Why an "Best Data Analyst Course" is Key in 2025, 100% Job in MNC, Excel, VBA, SQL, Power BI, Tableau Projects, "Data Analyst Training Certification Course" in Delhi, 110027 - Free Alteryx, Python Data Science Certification, By SLA Consultants India,
The rise of remote data analyst jobs in 2025 is transforming the global workforce, offering flexibility, high earning potential, and access to international opportunities. While the proportion of explicitly remote data analyst roles has slightly decreased since 2024, the overall market for remote and hybrid work remains robust, with platforms listing hundreds of remote openings and average salaries for remote analysts now exceeding $113,000 per year in the US. In India and other global markets, remote analysts are also seeing competitive pay and the ability to work for multinational companies from anywhere, making this career path more accessible and attractive than ever.
Data Analyst Course in Delhi
The key to securing these coveted remote positions is mastering a broad set of in-demand skills. Employers consistently seek proficiency in Excel, VBA, SQL, Power BI, Tableau, Alteryx, and Python, as well as strong analytical, statistical, and communication abilities. Data visualization tools like Tableau (28.1% of postings) and Power BI (24.7%) are especially sought after, while Microsoft Excel remains foundational, referenced in over 41% of job listings. While machine learning is increasingly mentioned in job ads, deep ML expertise is less crucial for analysts than for data scientists; instead, the focus is on practical analytics, business acumen, and the ability to translate data into actionable insights for stakeholders.
A comprehensive Data Analyst Training Course in Delhi such as the one offered by SLA Consultants India (110027), is essential for aspiring remote analysts. This program covers all the core tools—Excel, VBA, SQL, Power BI, Tableau—and includes free modules in Alteryx and Python Data Science, ensuring you are equipped for both foundational and advanced analytics tasks. The curriculum is project-driven, emphasizing real-world business scenarios, portfolio development, and hands-on experience, which are vital for remote job applications where employers often evaluate candidates based on demonstrable skills and completed projects. Additionally, the course offers a 100% job guarantee in MNCs and robust placement support, providing a direct pathway to remote and hybrid roles in top companies. Data Analyst Training Institute in Delhi
Data Analyst Training Course Module 1 - Basic and Advanced Excel With Dashboard and Excel Analytics Module 2 - VBA / Macros - Automation Reporting, User Form and Dashboard Module 3 - SQL and MS Access - Data Manipulation, Queries, Scripts and Server Connection - MIS and Data Analytics Module 4 - MS Power BI | Tableau Both BI & Data Visualization Module 5 - Free Python Data Science | Alteryx/ R Programing Module 6 - Python Data Science and Machine Learning - 100% Free in Offer - by IIT/NIT Alumni Trainer
The remote data analyst job market is maturing, with a growing preference for candidates who possess 2–4 years of experience and a broader, interdisciplinary skill set that includes ETL, data governance, and cloud analytics. Entry-level hiring is becoming more selective, but the field remains far from oversaturated for those with the right combination of technical mastery and business understanding. In summary, the Data Analyst Certification Course—like SLA Consultants India’s in Delhi (110027)—are key to unlocking remote and global opportunities in 2025, equipping you with the expertise, practical experience, and industry recognition needed to thrive in the evolving, flexible world of data analytics. For more details Call: +91-8700575874 or Email: [email protected]
0 notes
Text
Online vs. In-Person Excel Training: Pros and Cons

Whether you’re starting out in Excel or just brushing up on skills you last used five years ago, one question tends to come up: should you take a course online, or find a class you can attend in person?
It might sound like a small detail, but how you choose to learn something like Excel can actually make a big difference—not just in how fast you pick it up, but also in whether it sticks.
Let’s walk through both online Excel courses and in-person Excel training, and look at what each brings to the table. No marketing fluff—just an honest take on what works, and what doesn’t.
Learning Excel Online: The Flexible Favorite
Online learning has taken over just about every space, and Excel is no exception. There are thousands of courses out there, from basic spreadsheet skills to advanced automation with VBA.
Where Online Training Shines
Fits Around Your LifeFor most people, the biggest draw is flexibility. You don’t have to drive anywhere or rearrange your day. You can learn from your couch, your office, or the local coffee shop.
Go at Your Own SpeedIf a topic doesn’t quite click, you can pause and replay it. If you already know something, skip ahead. That kind of pacing isn’t always possible in a live class.
Generally More AffordableOnline Excel courses tend to cost less than traditional training. Some are even free. Others charge a one-time fee and give you access forever.
Wide Selection of TopicsWant to focus just on pivot tables? Or maybe build dashboards? There’s likely a course out there that teaches exactly what you’re looking for.
Access to Global TrainersYou’re not limited to instructors in your city or country. Some of the best Excel minds offer courses online, and you can learn from them directly.
Where Online Has Its Gaps
No Real-Time HelpIf you’re stuck, you’re stuck. Some courses offer community forums or email support, but it’s not the same as having someone walk you through the issue on the spot.
You Have to Stay MotivatedWithout a set schedule or classmates, it’s easy to put the course off. You start out strong but might lose momentum halfway through.
Lack of Personal FeedbackMost online Excel courses give you practice files, but rarely someone to review your work or point out where you’re going wrong.
In-Person Excel Training: The Traditional Route
Despite all the tech around us, plenty of people still prefer face-to-face learning. And when it comes to Excel, the hands-on approach can be really effective.
What Makes It Work
Live InteractionYou can ask questions the moment they come up, and the trainer can answer right away. It’s a smoother learning experience, especially when things get complicated.
Structure Helps You Stay FocusedWith a set time, place, and instructor, it’s easier to stay committed. You’ve made time for it in your calendar—and that structure helps keep you on track.
Hands-On Practice, Guided by an ExpertMost classroom sessions include activities, exercises, and immediate feedback. You’re learning, doing, and correcting—on the spot.
Group Energy HelpsYou’re learning alongside others, and that creates a shared focus. Sometimes a classmate asks a question you hadn’t even thought of. It keeps things dynamic.
Great for TeamsA lot of companies bring in trainers to teach entire teams. It keeps everyone on the same page and lets the content be tailored to the business’s actual tools and workflows.
The Drawbacks
Less FlexibleYou have to be there, at a set time, in a specific place. If something comes up—work, family, traffic—you miss the class.
Costs More, GenerallyLive training can be pricey. There are instructor fees, maybe venue costs, printed material, and travel—especially if it’s a multi-day workshop.
Limited Course SelectionLocal offerings might be basic. If you’re looking to learn something really niche—like Excel for data science or financial modeling—you might have a hard time finding it.
Pacing Isn’t Always RightIn a group setting, the instructor sets the pace. If you learn faster or slower than the average, it can be frustrating.
How to Decide: Which One Works for You?
There’s no one-size-fits-all answer here. It really depends on your own situation, learning style, and what you’re trying to achieve.
Here are a few questions to think through:
Do I need a flexible schedule or fixed structure?
Can I stay motivated on my own?
Would I benefit from live feedback?
Am I trying to learn something specific or just cover the basics?
How much am I willing to spend?
If you’re self-driven and looking to focus on specific Excel skills, online Excel courses are probably the way to go. But if you learn best with guidance and like being in a group setting, in-person Excel training might be the better fit.
Is There a Middle Ground?
Actually, yes. Some people go with a hybrid setup: start with online basics, then join a live session for hands-on practice. Others attend an in-person session and use online resources to follow up and dig deeper later.
These blended Excel learning methods are becoming more popular—especially with companies that want both flexibility and accountability for their teams.
Final Word
At the end of the day, the goal is the same—get better at Excel so you can work smarter, faster, and with more confidence.
Whether you choose to learn online or in a classroom, what really matters is sticking with it. Excel isn’t something you master in one sitting. It builds over time, and every bit of progress opens up more you can do with it.
The good news? No matter where you’re starting from, there’s a path forward that works for you.
0 notes