#VBA tool
Explore tagged Tumblr posts
Visit Tumblr Blog
Explore Tumblr blogs with no restrictions, modern design and the best experience.
Last Seen Tumblr Blogs


Fun Fact
Kazakhstan’s Minister of Communications and Informatics has blocked the Tumblr site because it contained 60 sites of terrorism, extremism, and pornography in 2015.
Text
Skill Nation Reviews | Index Creation
Index Creation VBA tool to automatically create Indexes
#Index Creation#jatan shah#jatan shah reviews#jatan shah skill nation reviews#jatan shah skill nation#skill nation reviews#skill nation student reviews#VBA tool#automatically create Indexes
0 notes
Text
Typesetting in One Click: Microsoft Word Macros 101!
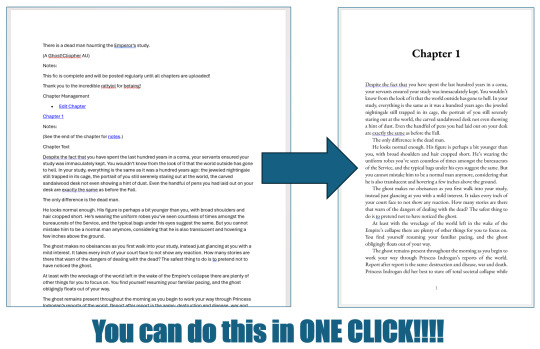
For @renegadepublishing's Binderary month, I gave a talk about how you can use Microsoft Word Macros to automate the typesetting process!! This talk was aimed for beginners, and covered how to install and use the Blak Books Bindery Macros (which can typeset an Ao3 fanfic in a single click!), how to customize Macros, some very basic VBA syntax, how to understand VBA documentation, use debugging tools, and more! If you're a total beginner to bookbinding, using Macros is one of the easiest ways to get started typesetting! You can watch the recording of the talk here. And the slides for the talk can be viewed here! Hope this is helpful, and happy binding! 😊
#bookbinding#typesetting#fanbinding#binderary2025#fanfic binding#ficbinding#bookbinding tutorial#rosa binds#rosa macros#renegade bookbinding guild
80 notes
·
View notes
Text
What is the most awesome Microsoft product? Why?
The “most awesome” Microsoft product depends on your needs, but here are some top contenders and why they stand out:
Top Microsoft Products and Their Awesome Features
1. Microsoft Excel
Why? It’s the ultimate tool for data analysis, automation (with Power Query & VBA), and visualization (Power Pivot, PivotTables).
Game-changer feature: Excel’s Power Query and dynamic arrays revolutionized how users clean and analyze data.
2. Visual Studio Code (VS Code)
Why? A lightweight, free, and extensible code editor loved by developers.
Game-changer feature: Its extensions marketplace (e.g., GitHub Copilot, Docker, Python support) makes it indispensable for devs.
3. Windows Subsystem for Linux (WSL)
Why? Lets you run a full Linux kernel inside Windows—perfect for developers.
Game-changer feature: WSL 2 with GPU acceleration and Docker support bridges the gap between Windows and Linux.
4. Azure (Microsoft Cloud)
Why? A powerhouse for AI, cloud computing, and enterprise solutions.
Game-changer feature: Azure OpenAI Service (GPT-4 integration) and AI-driven analytics make it a leader in cloud tech.
5. Microsoft Power BI
Why? Dominates business intelligence with intuitive dashboards and AI insights.
Game-changer feature: Natural language Q&A lets users ask data questions in plain English.
Honorable Mentions:
GitHub (owned by Microsoft) – The #1 platform for developers.
Microsoft Teams – Revolutionized remote work with deep Office 365 integration.
Xbox Game Pass – Netflix-style gaming with cloud streaming.
Final Verdict?
If you’re a developer, VS Code or WSL is unbeatable. If you’re into data, Excel or Power BI wins. For cutting-edge cloud/AI, Azure is king.
What’s your favorite?
If you need any Microsoft products, such as Windows , Office , Visual Studio, or Server , you can go and get it from our online store keyingo.com
8 notes
·
View notes
Text
The Limbo of Advanced Users and Amateur Developers in Microsoft 365

Microsoft 365, the successor to the iconic Office suite, has transformed how millions of people work, collaborate, and manage their daily tasks. However, this transformation has not been equal for everyone. While businesses and corporations have access to a myriad of powerful tools through robust subscriptions, advanced users — those enthusiasts who have historically driven innovation through customization and automation — are left in limbo. This article argues that Microsoft, by prioritizing service-based and enterprise-focused models, has abandoned beginner developers and advanced users, once the cornerstone of its tools’ success.
The Golden Age of Customization
In the past, Microsoft Office allowed rich customization and automation through Visual Basic for Applications (VBA) and integration with technologies like COM (Component Object Model). These features enabled individuals, even without corporate tools, to create scripts to automate tasks, customize interfaces, and connect applications in innovative ways. With VBA, a user could generate automated reports in Excel or build macros to streamline repetitive processes in Word. This turned Office into not only a productivity tool but also a learning platform for budding developers.
However, with the migration to Microsoft 365, this flexibility has been significantly reduced. VBA remains available in a limited capacity, but its usage is increasingly marginalized, and many new features of Microsoft 365 are inaccessible through it. Furthermore, VBA has no support in the web environment, which is becoming increasingly central to modern workflows.
A Service, Not a Tool
Microsoft 365 represents a fundamental shift: from locally installed software to a cloud-based service. While this approach offers benefits like real-time collaboration and automatic updates, it has severely limited advanced users. Local automation has taken a back seat, and the focus has shifted to tools like Power Automate — a powerful platform, but largely inaccessible to personal users.
Power Automate is clearly designed for the corporate environment. Many of its most compelling features are locked behind business-specific subscriptions, leaving individual users without practical alternatives. For users seeking advanced and customized solutions, Microsoft 365 is no longer a viable option.
Apple’s Counterpoint
While Microsoft appears to be moving away from advanced users, Apple is taking the opposite direction. Tools like Shortcuts, AppleScript, and Automator make Apple’s applications highly customizable, even for personal users. Tasks can be automated in Pages, Numbers, Reminders, and Calendar without relying on corporate services. This approach not only empowers users but also fosters curiosity and learning among new developers.
This contrast highlights the central issue: Apple values tech enthusiasts and amateur developers, while Microsoft seems to have relegated them to a secondary role, if not excluded them entirely.
The Impact on the Future of Technology
Microsoft’s abandonment of advanced users has broader implications beyond daily workflows. For many developers, tools like VBA served as an entry point to programming. Removing these opportunities makes practical learning more difficult and stifles grassroots innovation. At a time when the market needs more developers and creative thinkers, this decision is particularly troubling.
Moreover, this exclusion risks alienating a community that has historically been crucial to Office’s success. Advanced users are often technology “evangelists” within their circles, promoting tools and influencing purchasing decisions. Ignoring them poses a significant strategic risk for Microsoft.
Conclusion: What Should Microsoft Do?
If Microsoft wants to regain the trust and engagement of advanced users, several actions are essential:
1. Revitalize VBA and Similar Technologies: Ensure that local automations are not only supported but encouraged, including integration with new Microsoft 365 features.
2. Expand Access to Power Automate: Offer more platform functionalities to individual users without requiring corporate subscriptions.
3. Acknowledge the Value of Advanced Users: Develop tools and initiatives aimed at educating and empowering amateur developers and tech enthusiasts.
In a world increasingly dominated by cloud-based services, striking a balance between innovation and accessibility is crucial. Microsoft has an opportunity to correct its course and reaffirm its commitment to the community that helped it succeed. If it fails to do so, it risks losing a vital segment of its user base to more inclusive alternatives.
6 notes
·
View notes
Text
For large portions of my career I've made vba tools.
80% of that time is spent handling any possible user input and writing very polite error messages because god forbid the sales people have to think about what they're doing
If any part of your plan involves the words “nobody could be that stupid”, please be prepared to be proven wrong at any minute at a moment’s notice. Pay in mind that the person determined to prove you wrong may already be aware of this assumption, and is already approaching your current location at an alarming speed.
31K notes
·
View notes
Text
How an "Best Data Analyst Course" Can Secure Your Job in the Evolving 2025-2026 Market, 100% Job in MNC, Excel, VBA, SQL, Power BI, Tableau Projects, "Best Data Analyst Course" in Delhi, 110089 - Free Alteryx, Python Data Science Certification, By SLA Consultants India,
A “Best Data Analyst Course” is a powerful tool to secure your job in the rapidly evolving 2025-2026 market, especially as demand for skilled data analysts continues to surge across industries. The US Bureau of Labor Statistics projects a 23% increase in data analyst jobs by 2032, with entry-level salaries now at $90,000—a $20,000 jump from 2024—and average salaries reaching $111,000, reflecting the high value organizations place on analytical expertise. In India, the data analytics sector is projected to reach $118.7 billion by 2026, highlighting a wealth of opportunities for those with the right skills.
Data Analyst Course in Delhi
Employers are seeking candidates with a robust skill set that includes proficiency in Excel, VBA, SQL, Power BI, and Tableau—tools that are consistently referenced in job postings and essential for data manipulation, automation, and visualization. Advanced skills in automation (Alteryx) and programming (Python) are also increasingly valued, as companies integrate AI and machine learning into their workflows. While AI is transforming the field by automating routine tasks, it is not replacing data analysts; instead, it is augmenting their work and increasing their strategic value. In fact, 70% of analysts say AI automation enhances their effectiveness, while 87% feel more strategically valuable than ever before. This means that professionals who can leverage both traditional and cutting-edge tools will be in high demand.
A Data Analyst Training Course in Delhi offered by SLA Consultants India in Delhi (110089) is specifically designed to prepare you for this dynamic market. The comprehensive curriculum covers all essential tools—Excel, VBA, SQL, Power BI, Tableau—and includes real-world projects that simulate the challenges faced by analysts in leading organizations. The inclusion of free Alteryx and Python Data Science certification further enhances your profile, equipping you with advanced analytics and automation skills that are highly sought after by employers. This practical, hands-on approach ensures you are job-ready and can demonstrate your ability to deliver actionable insights from complex data.
Data Analyst Training Course Modules Module 1 - Basic and Advanced Excel With Dashboard and Excel Analytics Module 2 - VBA / Macros - Automation Reporting, User Form and Dashboard Module 3 - SQL and MS Access - Data Manipulation, Queries, Scripts and Server Connection - MIS and Data Analytics Module 4 - MS Power BI | Tableau Both BI & Data Visualization Module 5 - Free Python Data Science | Alteryx/ R Programing Module 6 - Python Data Science and Machine Learning - 100% Free in Offer - by IIT/NIT Alumni Trainer
With robust placement support and 100% job guarantee for MNCs, SLA Consultants India’s Data Analyst Certification Course in Delhi provides a clear pathway to high-paying roles in top organizations, both locally and internationally. The flexibility to work remotely or in hybrid environments further expands your opportunities, as data analyst roles are among the most sought-after remote jobs globally. By investing in this certification, you position yourself for rapid career advancement and financial success, securing your place in the evolving, data-driven economy of 2025-2026. The combination of strong technical skills, business acumen, and the ability to adapt to new technologies makes data analyst professionals indispensable and ensures their continued high demand across industries. For more details Call: +91-8700575874 or Email: [email protected]
0 notes
Text
How VBA Automates Reporting and AI Enhances Insights in Data Analysis

In today’s data-driven world, companies are flooded with massive volumes of information. Yet, raw data alone doesn’t deliver value. What matters is how quickly and intelligently we can process and analyze it. This is exactly where the powerful duo of VBA (Visual Basic for Applications) and Artificial Intelligence (AI) comes into play. At GVT Academy, we have integrated both into our curriculum, offering the Best Data Analyst Course with VBA & AI in Noida to meet the industry’s growing demand for skilled professionals.
Why VBA Is Still Relevant in 2025
Despite the emergence of newer tools, VBA remains a powerful language for automating repetitive tasks, especially in Excel – a tool widely used in businesses of all sizes. With VBA, data analysts can:
Create your daily and weekly reports in seconds—just one click and you're done
Create personalized macros to simplify data cleaning and formatting tasks
Reduce manual errors and improve efficiency
Schedule and generate reports without supervision
This kind of automation saves not just hours, but sometimes days of work—giving analysts more time to focus on what really matters: analysis and decision-making.
How AI Transforms the Way We Analyze Data
While VBA handles automation, AI brings intelligence. Machine learning models can identify hidden trends, forecast future patterns, and even detect anomalies in large datasets. In GVT Academy’s Data Analyst course, you learn:
Predictive analytics using Python libraries
Customer behavior analysis with machine learning
Natural Language Processing for unstructured data
AI-driven dashboards for smart visualizations
AI empowers analysts to move beyond dashboards and deliver real insights that drive business strategy.
The Magic Happens When VBA Meets AI
Imagine this: You build an automated Excel report using VBA that pulls sales data every morning. That same data is fed into an AI model which predicts future revenue or flags unusual spending patterns. This is not fiction — it’s the real-world, hands-on training offered in the Best Data Analyst Course with VBA & AI in Noida, exclusively at GVT Academy.
Our hybrid approach teaches students to automate routine tasks using VBA, and then apply AI to gain deeper, more accurate insights from the data.
What You'll Learn at GVT Academy
At GVT Academy, our program is designed to make you industry-ready. Here's what you gain:
Mastery over Excel and VBA for automation
In-depth training in Power BI and SQL
Python programming for AI and machine learning
Real-life projects and case studies to apply what you learn
Interview preparation and resume building
Our trainers are industry professionals who bring real-world expertise into the classroom, ensuring you're learning what employers actually look for.
Why Choose GVT Academy in Noida?
GVT Academy has helped countless students build successful careers, backed by dedicated placement support — making it a top choice for the Best Data Analyst Course with VBA & AI in Noida. Our focus is not just on tools—but on problem-solving and critical thinking, which are crucial in today’s competitive job market.
Whether you're a fresher or a working professional looking to upskill, this course is a gateway to high-paying jobs in data analytics, business intelligence, and AI-driven decision-making roles.
Final Thoughts
VBA streamlines your current tasks, while AI empowers you to forecast what’s coming next. Together, they make a powerful combination that companies are actively seeking in their data teams. Don’t miss the opportunity to become a skilled data analyst with expertise in both.
Enroll now at GVT Academy and take the smartest step toward your data analytics career.
1. Google My Business: http://g.co/kgs/v3LrzxE
2. Website: https://gvtacademy.com
3. LinkedIn: www.linkedin.com/in/gvt-academy-48b916164
4. Facebook: https://www.facebook.com/gvtacademy
5. Instagram: https://www.instagram.com/gvtacademy/
6. X: https://x.com/GVTAcademy
7. Pinterest: https://in.pinterest.com/gvtacademy
8. Medium: https://medium.com/@gvtacademy
#gvt academy#data analytics#advanced excel training#data science#python#sql course#advanced excel training institute in noida#best powerbi course#power bi#advanced excel#vba#AI
0 notes
Text
Advance Excel Training in Mira Road: Elevate Your Career with TIIT Computer Education
Are you looking to enhance your data skills and boost your career prospects? Advance Excel Training in Mira Road at TIIT Computer Education offers a comprehensive, hands-on course to master Microsoft Excel’s advanced features. Located in the vibrant suburb of Mira Road, Mumbai, TIIT provides expert-led training tailored for professionals, students, and entrepreneurs aiming to excel in data analysis, automation, and reporting.

Why Opt for Advance Excel Training in Mira Road?
In today’s competitive job market, advanced Excel skills are essential across industries like finance, marketing, HR, and logistics. Mira Road, a thriving residential and commercial hub, is home to ambitious learners seeking quality education. TIIT Computer Education’s Advance Excel Training in Mira Road equips you with practical skills to handle complex datasets, automate tasks, and create professional reports, giving you a competitive edge.
This course is perfect for:
Professionals aiming to improve efficiency in roles like MIS, accounting, or data analysis.
Students preparing for careers in commerce, management, or analytics.
Business Owners looking to manage budgets, sales, and inventory with ease.
What’s Covered in Our Advance Excel Course?
Our Advance Excel Training in Mira Road at TIIT Computer Education is designed to transform you into an Excel expert. The course curriculum includes:
1. Advanced Formulas and Functions
Master functions like VLOOKUP, HLOOKUP, INDEX-MATCH, and nested IF statements.
Use logical, text, and date functions for dynamic data manipulation.
Work with array formulas for advanced calculations.
2. Data Analysis and Reporting
Create and customize Pivot Tables and Pivot Charts for insightful data summaries.
Use slicers and timelines for interactive filtering.
Perform What-If Analysis with tools like Goal Seek and Scenario Manager.
3. Automation with Macros and VBA
Record and edit macros to automate repetitive tasks.
Write VBA scripts to build custom functions and workflows.
Develop user-friendly interfaces using VBA forms.
4. Data Cleaning and Management
Import and transform data using Power Query.
Clean datasets by removing duplicates, handling errors, and standardizing formats.
Use Text to Columns, Flash Fill, and advanced filters for efficient data management.
5. Dashboards and Advanced Visualization
Build dynamic, interactive dashboards for professional presentations.
Create advanced charts like Combo Charts, Sparklines, and Histograms.
Apply conditional formatting to highlight key trends and insights.
Why Choose TIIT Computer Education?
TIIT Computer Education is the top choice for Advance Excel Training in Mira Road. Here’s what sets us apart:
Experienced Trainers: Learn from industry experts with extensive knowledge of Excel applications.
Hands-On Learning: Practice real-world scenarios through projects and case studies.
Flexible Schedules: Choose from weekday, evening, or weekend batches to suit your routine.
Affordable Pricing: High-quality training at budget-friendly rates with flexible payment plans.
Recognized Certification: Earn a certificate to strengthen your resume and career prospects.
State-of-the-Art Facilities: Train in modern computer labs equipped with the latest software.
Career Support: Get job placement assistance and career guidance to achieve your goals.
Benefits of Mastering Advance Excel
Enrolling in Advance Excel Training in Mira Road offers significant advantages:
Career Advancement: Excel expertise is highly valued in roles like data analyst, financial planner, and business intelligence specialist.
Time Efficiency: Automate tasks to save hours on manual data processing.
Data-Driven Decisions: Create actionable insights with advanced analysis and visualization tools.
Versatility: Apply skills across industries, from startups to multinational corporations.
Who Should Join This Course?
Our Advance Excel Training in Mira Road is designed for a wide range of learners, including:
Beginners with basic Excel knowledge looking to upskill.
Professionals in finance, marketing, HR, or operations seeking to enhance productivity.
Entrepreneurs needing to manage business data effectively.
Students aiming for careers in data analytics, accounting, or management.
How to Enroll at TIIT Computer Education
Ready to become an Excel pro? Joining Advance Excel Training in Mira Road at TIIT is easy:
Explore the Course: Visit tiitcomputereducation.live for detailed course information.
Get in Touch: Call +91-9323469826 or email [email protected] for queries.
Sign Up: Select a convenient batch and complete the registration process.
Start Learning: Dive into expert-led training and master advanced Excel skills.
Why Mira Road is Ideal for Learning
Mira Road’s proximity to Mumbai and excellent connectivity make it a prime location for professional education. TIIT Computer Education’s centrally located institute in Mira Road offers a conducive learning environment, making it the go-to destination for Advance Excel Training in Mira Road.
Conclusion
Mastering advanced Excel is a game-changer for your career. TIIT Computer Education’s Advance Excel Training in Mira Road provides the skills, tools, and certification you need to succeed in today’s data-driven world. With expert trainers, practical training, and flexible schedules, we’re dedicated to helping you achieve your professional goals. Enroll now at TIIT Computer Education and take the first step toward a brighter future. Contact us at +91-9323469826 or visit our Mira Road center today!
0 notes
Text
The Growing Role of AI in Financial Modelling: What Finance Professionals Need to Know
The finance industry is evolving at lightning speed, and at the heart of this transformation is Artificial Intelligence (AI). Once considered a futuristic concept, AI is now playing a critical role in financial modelling, revolutionizing how analysts, investors, and businesses make decisions.
As AI tools become mainstream—from Excel Copilot to AI-powered forecasting platforms—finance professionals need to upskill quickly to stay relevant. If you're in Maharashtra and looking to prepare for this future, enrolling in the best Financial Modelling Course in Pune can give you the perfect foundation to integrate traditional finance knowledge with cutting-edge AI applications.
Why AI Is Disrupting Financial Modelling
Financial modelling has traditionally relied on tools like Microsoft Excel, manual inputs, historical data, and scenario-based forecasting. While this approach is still foundational, AI introduces new capabilities that speed up workflows, improve accuracy, and unlock deeper insights.
Here’s what AI brings to the table:
Predictive analytics based on real-time data
Automated data cleaning and structuring
Natural Language Processing (NLP) for turning plain questions into formulas
Machine learning algorithms for identifying patterns, anomalies, and trends
AI copilots (like Excel’s AI integration) for building models faster and smarter
Real-World Applications of AI in Financial Modelling
1. Forecasting Revenue with Machine Learning
Startups and enterprises are now using ML algorithms to analyze customer behavior, historical transactions, and seasonality trends to forecast future revenues with more precision than ever before.
2. Risk Assessment and Credit Scoring
Banks and fintechs use AI models to assess a borrower’s creditworthiness by analyzing not just financial history, but also digital footprints, social behavior, and market signals. This data is fed into financial risk models for faster decision-making.
3. Automated Financial Dashboards
AI is being used to build dynamic dashboards that automatically update KPIs, financial ratios, and projections without human input. This is a game-changer for CFOs, startup founders, and FP&A teams.
4. Scenario Planning with AI
Instead of manually testing every “what-if” situation, AI-powered tools can simulate thousands of scenarios in seconds, helping businesses plan for market crashes, inflation, or sudden demand surges.
5. Valuation of Startups and Complex Assets
Traditional valuation models often fall short for startups or unconventional business models. AI algorithms are now being trained on comparable deal data and real-time metrics to build smarter, adaptive valuation models.
Why Finance Professionals Must Adapt
As AI becomes more embedded in financial decision-making, professionals who resist this transition risk becoming obsolete. But those who embrace AI—and pair it with strong financial modelling fundamentals—will be in high demand across:
Investment banking
Corporate finance
Equity research
Fintech startups
Risk management
Venture capital and private equity
To thrive in this new landscape, learning how to build models, understand valuation logic, and integrate AI-driven insights is critical. That’s exactly what the best Financial Modelling Course in Pune aims to deliver.
What You’ll Learn in a Modern Financial Modelling Course
Traditional modelling courses are now evolving to include AI and automation tools. By joining the best Financial Modelling Course in Pune, you can expect to learn:
3-statement modelling (income statement, balance sheet, cash flow)
DCF, LBO, and relative valuation techniques
Sensitivity analysis and scenario testing
Excel automation and VBA basics
Introduction to AI in finance (Excel Copilot, ChatGPT, Python integration)
Use of AI tools for forecasting, budgeting, and risk modeling
With these skills, you won’t just be crunching numbers—you’ll be building intelligent, scalable, and adaptable models that make you stand out in any financial role.
How AI is Changing the Finance Job Market
According to a 2024 Deloitte report, over 60% of finance functions will incorporate AI tools in daily operations by 2026. Roles like FP&A Analyst, Financial Controller, and Valuation Specialist will require a working knowledge of both finance and AI-enabled analytics.
That means future job descriptions will expect candidates to:
Interpret outputs from AI forecasting tools
Integrate financial models with AI dashboards
Understand bias and limitations in AI predictions
Collaborate with data scientists and tech teams
This blend of finance and tech is creating a new type of professional: the “AI-savvy financial analyst”—someone who understands business and balance sheets but also speaks the language of algorithms and data.
Why Pune is Emerging as a Financial Learning Hub
Pune is fast becoming a hotspot for finance and technology education, with a growing number of professionals and students seeking specialized training in financial modelling, data analysis, and AI. With its startup culture, proximity to Mumbai's financial hub, and vibrant tech ecosystem, Pune offers the perfect launchpad for a future-proof finance career.
The best Financial Modelling Course in Pune combines expert faculty, real-world case studies, and AI-enabled training modules to prepare learners for this next wave of financial innovation.
Final Thoughts
AI is no longer a buzzword—it's a business reality, especially in the world of finance. From faster forecasts to smarter risk models, artificial intelligence is reshaping how we build, analyze, and interpret financial data.
Finance professionals who pair AI tools with strong modelling skills will have an unparalleled edge in the job market. Whether you’re a student, an analyst, or an aspiring CFO, there’s no better time to upskill.
If you’re ready to build smarter models, make better predictions, and future-proof your career, start with the best Financial Modelling Course in Pune—and become the AI-powered financial expert every company needs.
0 notes
Text
Design Smarter with ZWCAD and SketchUp: The Modern Choice for 2D & 3D CAD Excellence
In today’s fast-paced digital design landscape, professionals across architecture, engineering, and construction are always on the lookout for efficient, affordable, and powerful CAD tools. Choosing the right design software is more than just about creating visuals—it's about productivity, accuracy, and seamless communication.
ZWCAD and SketchUp have emerged as top-tier solutions for 2D drafting and 3D modeling, trusted by millions of users globally. Both tools offer user-friendly interfaces, extensive toolsets, and flexible licensing models, making them ideal for businesses and professionals seeking high-value design platforms. Let’s explore what makes these software options stand out and how they can enhance your workflow.

ZWCAD: A Trusted Solution for 2D Design and Drafting
ZWCAD is a professional-grade 2D CAD software that has earned the trust of over 900,000 users across 90 countries. It delivers an impressive balance between functionality and affordability, offering features comparable to industry leaders but with significant long-term cost benefits.
Familiar User Interface
One of ZWCAD’s most appreciated strengths is its intuitive interface. Users can seamlessly switch between Classic and Ribbon layouts, catering to both traditional CAD users and those familiar with newer design environments. This flexibility ensures that users experience a minimal learning curve, allowing them to focus on productivity right from day one.
Compatibility with Popular CAD Standards
ZWCAD supports DWG/DXF file formats, making it highly compatible with files from other CAD platforms. If you’re transitioning from another tool, there’s no need to worry about file compatibility or losing valuable project data. Most commands and aliases remain the same, which means there's virtually no re-learning cost.
Performance and Precision
Designed with a powerful engine, ZWCAD ensures smooth operation even with large files. Features like SmartMouse, SmartSelect, and File Compare boost productivity by reducing repetitive tasks. With native support for LISP, VBA, and ZRX, it’s also highly customizable.
Perpetual Licensing Model
Unlike subscription-only software, ZWCAD offers a perpetual license—a one-time payment that gives you lifetime access. This model is especially valuable for small businesses and freelancers looking to avoid recurring costs.
SketchUp: Bringing Your Ideas to Life in 3D
While ZWCAD handles precision 2D drafting with excellence, SketchUp takes creativity to the next dimension. It’s known globally for its simplicity, speed, and versatility in 3D modeling.
Intuitive 3D Modeling Tools
SketchUp is designed to be the most intuitive way to model in 3D. Whether you're sketching out a new architectural concept or refining product designs, its interface lets you focus on your idea—not on navigating a complex toolset. This means faster iterations, better collaboration, and more efficient project development.
Versatile Design Applications
From architecture, interior design, and construction, to landscape design, film set modeling, and even game development, SketchUp finds applications across a wide array of industries. Its flexibility makes it an ideal fit for both conceptual designs and detailed construction models.
Accuracy from the Start
SketchUp isn’t just for aesthetic presentations. It allows users to design with real-world dimensions and accuracy. You can define materials, set shadows based on geographic coordinates, and even create construction documents from your 3D models. This makes it not just a design tool but a comprehensive project planning solution.
Perfect Combo for Modern Designers
When combined, ZWCAD and SketchUp offer a powerful synergy: 2D precision from ZWCAD paired with the visual storytelling and 3D capabilities of SketchUp. This makes them a dynamic duo for AEC professionals, design studios, educators, and product developers alike.
Whether you're preparing floor plans, creating construction documents, visualizing interior layouts, or building prototypes, the integrated use of both tools can streamline workflows, reduce rework, and enhance collaboration.
Why This Matters to Businesses
Choosing the right tools can significantly impact team performance, project timelines, and overall costs. Here's how ZWCAD and SketchUp provide a competitive edge:
Lower Total Cost of Ownership with perpetual licenses and no mandatory subscriptions.
Quick onboarding due to intuitive UIs and familiar command structures.
Cross-platform compatibility with popular CAD and 3D model file formats.
Scalability for growing design teams with flexible deployment options.
These features make ZWCAD and SketchUp accessible to startups, educational institutions, and large-scale enterprises alike.
Supported and Distributed by Tridax Solution
These industry-standard tools are provided and supported by Tridax Solution, a reputed name in CAD/CAM/CAE services. Tridax ensures seamless deployment, training, and support for its clients, making it easier for organizations to adopt these tools with confidence.
For more information, specifications, demo requests, or purchase inquiries, you can https://www.tridaxsolutions.com/product/zwcad/
Final Thoughts
In a world where design timelines are shrinking and client expectations are rising, adopting the right tools can make a world of difference. ZWCAD and SketchUp are two such tools that empower designers, engineers, and creatives to work smarter, faster, and more efficiently.
Whether you're just starting in design or are an experienced professional looking for a cost-effective upgrade, these platforms are well worth considering. Invest in performance, precision, and flexibility—with ZWCAD and SketchUp, you’re not just drafting or modeling; you’re shaping the future of your creative potential.
#ZWCAD software#SketchUp 3D modeling#CAD software with perpetual license#2D drafting tools#3D modeling software for architects#Tridax Solution CAD#Best alternative to AutoCAD#Professional CAD tools#SketchUp architecture design#CAD software for engineers
0 notes
Text
Build a Dynamic Dashboard Using VBA and Excel
In today’s fast-paced business world, data visualization and automation have become essential tools for professionals. One of the most powerful ways to combine both is by creating dynamic dashboards using VBA in Excel. With the right VBA (Visual Basic for Applications) skills, you can automate data processing and build interactive dashboards that update with just one click.
In this blog, we'll explore how you can build a dynamic Excel dashboard using VBA, step-by-step. We’ll also show you how you can upgrade your skills with expert training from Innozant Institute, a leading name in smart tech learning.
🧩 What is a Dynamic Dashboard?
A dynamic dashboard is an interactive visual representation of your data that updates in real-time or with minimal manual effort. It includes charts, pivot tables, buttons, drop-downs, and reports that respond to user inputs like date selection, product filter, or region.
Unlike static reports, dynamic dashboards can be reused, refreshed, and reused with just a few clicks. And when combined with Excel VBA automation, they become even more powerful.
🛠️ Why Use VBA in Dashboards?
While Excel’s native tools like PivotTables and slicers are helpful, VBA offers added flexibility. Here’s what VBA can do:
Automate data import and cleanup
Dynamically refresh charts and PivotTables
Hide/show sheets, rows, and columns based on selections
Trigger actions with buttons or UserForms
Save or send dashboard reports in PDF or email
In short, VBA gives life to your static Excel files and makes your dashboards dynamic and intelligent.
📊 Step-by-Step: Build a Dynamic Dashboard Using VBA
Let’s look at how to build a simple yet dynamic sales dashboard using Excel and VBA.
Step 1: Prepare the Data
First, get your data ready. It could be from an Excel sheet, a database, or even an imported CSV file. Make sure it’s well structured — rows for records and columns for fields like Date, Region, Product, Sales, etc.
Step 2: Insert PivotTables and Charts
Use Excel’s built-in PivotTable feature to summarize your data — total sales by region, top products, monthly sales trends. Then, insert PivotCharts based on these tables.
To make the dashboard dynamic, we’ll now connect it with VBA.
Step 3: Add Form Controls (Buttons, Drop-downs)
Go to the Developer Tab in Excel and insert buttons and drop-downs. For example:
Combo box to select Region
Button to refresh data
Button to export dashboard as PDF
Name these controls so you can reference them in your VBA code.
Step 4: Open VBA Editor and Write Code
Press ALT + F11 to open the VBA editor. Create a new module and add code like:
Sub RefreshDashboard()
Sheets("Dashboard").PivotTables("SalesPivot").PivotCache.Refresh
MsgBox "Dashboard Updated!"
End Sub
You can also automate chart updates, formatting, and data filters. Connect your buttons to the macros via "Assign Macro."
Step 5: Add Export or Email Option
Want to share your dashboard? Try this code:
Sub ExportDashboardToPDF()
Sheets("Dashboard").ExportAsFixedFormat Type:=xlTypePDF, Filename:="Sales_Report.pdf"
MsgBox "Dashboard Exported as PDF!"
End Sub
This allows users to download or email the dashboard as a professional PDF report — all from within Excel.
Step 6: Build a UserForm for Advanced Control
Using a VBA UserForm, you can let users select multiple filters (like date range, region, or category) and click a button to view updated results. This adds a sleek, app-like feel to your Excel file.
🎯 Real-World Uses of Dynamic Dashboards
Sales Teams: Track targets, product performance, and regional trends
HR Departments: Monitor hiring status, attrition, and employee engagement
Finance Teams: Compare monthly expenses, profits, and forecasts
Project Managers: View project timelines, milestones, and risks
With just a bit of VBA, your Excel file becomes a powerful business intelligence tool.
📚 Learn Excel VBA Dashboard Design at Innozant Institute
Want to master the art of Excel VBA dashboards? Join Innozant Institute, the fastest-growing training hub for data, digital, and tech skills. Our Excel VBA course covers:
Macro recording and editing
VBA syntax, loops, and conditions
Working with charts, forms, and events
Creating real-time dashboards
Automating reports and emails
✅ Live Projects ✅ Expert Trainers ✅ Hybrid (Online + Offline) Classes ✅ Placement Support
Whether you’re a student, working professional, or business owner, Innozant Institute can help you upgrade your skills and boost your career.
🚀 Final Thoughts
Creating a dynamic dashboard using VBA in Excel is not only fun but also incredibly useful in real-world business situations. It gives you more control, automation, and speed.
If you want to go beyond the basics and become an Excel automation expert, start learning VBA today — and there’s no better place than Innozant Institute to begin that journey.
0 notes
Text
Explore the easiest and most effective ways to scrape website data and transfer it directly to Excel. Whether you're a marketer, researcher, or data analyst, this blog from Zyneto breaks down the best tools and techniques to simplify your workflow. Learn step-by-step methods using tools like Python, browser extensions, and no-code platforms. 👉 Read now: Best Methods to Scrape Page Information and Add It to Excel
0 notes
Text
Excel Like a Pro: The Ultimate Guide to Microsoft Excel Mastery
If you've ever felt overwhelmed looking at an Excel spreadsheet, you're not alone. Microsoft Excel can look intimidating with all its formulas, charts, tables, and tabs. But here’s the thing — once you master it, Excel becomes one of the most powerful tools you’ll ever use. Whether you're managing personal finances, analyzing data, or building dashboards for work, Excel has you covered.
So, how do you go from being an Excel rookie to someone who uses pivot tables in their sleep?
Simple. By learning from the Microsoft Excel: Ultimate Mastery from Beginner to Pro course — a comprehensive program designed to turn even the most hesitant users into Excel power users.
Let’s break down why this course is worth your time and how it can transform your skills from basic to brilliant.
Why Excel Mastery Matters in 2025 (and Beyond)
Excel is not just a tool. It’s practically a language spoken across all industries — from finance and marketing to healthcare and logistics. Here's what makes it essential:
Universal Application: Almost every job requires some level of data entry, reporting, or analysis.
Efficiency & Productivity: Mastering Excel helps you complete tasks faster and more accurately.
Career Advancement: Proficiency in Excel is a highly sought-after skill that can help you stand out.
Smarter Decision Making: With Excel, you can visualize data, forecast trends, and make data-driven decisions.
So, whether you're job hunting, starting a business, or looking to automate repetitive tasks, mastering Excel is a smart move.
What Makes This Excel Course So Effective?
There are tons of Excel tutorials out there, so why choose this one? The Microsoft Excel: Ultimate Mastery from Beginner to Pro course on Korshub is different. Here’s how:
✅ All-in-One Learning Path
Instead of bouncing between YouTube videos and random blog posts, this course gives you a structured, progressive roadmap. It starts with the basics like formatting cells and quickly moves into advanced territory like macros and data analysis.
✅ Hands-On Learning with Real-Life Examples
You won’t just learn how to use VLOOKUP or SUMIF — you’ll use them in real-world scenarios that simulate actual workplace tasks. That means what you learn is immediately applicable.
✅ Latest Excel 2021 Features Covered
With tools and techniques updated for Microsoft Excel 2021, this course ensures you're learning the most relevant and up-to-date content. Features like dynamic arrays, XLOOKUP, and improved charting functionalities are all part of the package.
✅ Lifetime Access with Future Updates
Once enrolled, you’ll have lifetime access to the course. Whenever there’s a new Excel update, you’ll be the first to know and learn how to use it.
What You’ll Learn — A Peek into the Curriculum
Here’s a quick overview of the skills you'll gain from beginner to pro level:
🟢 Beginner Essentials
Navigating Excel’s interface
Formatting cells and worksheets
Basic formulas and functions (SUM, AVERAGE, COUNT)
Sorting and filtering data
Creating and formatting simple charts
🔵 Intermediate Proficiency
Conditional formatting
Data validation
Pivot tables and Pivot charts
Logical functions like IF, AND, OR
Lookup functions (VLOOKUP, HLOOKUP, XLOOKUP)
🟣 Advanced Excel Techniques
Data visualization dashboards
Advanced charts (combo, waterfall, histogram)
What-If analysis (Goal Seek, Scenario Manager)
Named ranges and data tables
Working with large datasets
🔴 Excel Power Tools
Power Query & Power Pivot
Macros and VBA basics
Automating reports
Connecting Excel to other data sources
Advanced data modeling and forecasting
Real-World Applications: How Excel Helps You Every Day
You might be wondering, "Will I really use all this?" The short answer: YES.
Here’s how Excel shows up in real life:
For Students: Organize study schedules, calculate GPA, track expenses.
For Freelancers: Invoice clients, calculate earnings, manage projects.
For Office Workers: Analyze sales data, create performance dashboards, generate automated reports.
For Small Business Owners: Track inventory, monitor cash flow, create financial projections.
And the best part? Once you’ve taken the Microsoft Excel: Ultimate Mastery from Beginner to Pro course, you’ll be doing all this with ease and speed.
Who Is This Course For?
This course is designed for everyone — regardless of your background or experience. Here's who will benefit most:
Absolute Beginners: No prior Excel knowledge needed.
Intermediate Users: Fill in knowledge gaps and explore new features.
Business Professionals: Improve productivity and data analysis.
Job Seekers: Boost your resume with a high-demand skill.
Entrepreneurs: Manage and grow your business more efficiently.
Key Features That Set This Course Apart
🌟 20+ Hours of Engaging Video Content
Packed with digestible lessons that keep you motivated.
🌟 Downloadable Resources & Workbooks
Practice what you learn with ready-to-use files.
🌟 Quizzes & Real-World Projects
Put your skills to the test with interactive assignments.
🌟 Certificate of Completion
Showcase your achievement and add it to your LinkedIn profile.
What Students Are Saying
"I thought Excel was only for accountants. After taking this course, I use it for everything — budgeting, planning, even my side hustle. Totally worth it!" — Priya M., Freelancer
"I landed a job partly because of the Excel dashboard I built as part of this course. Hiring managers were impressed!" — Jason T., Data Analyst
"This course is like having a mentor walk you through Excel step-by-step. I finally understand formulas, charts, and even macros!" — Alisha R., College Student
How to Get Started
Ready to transform how you work with data?
It only takes a few minutes to enroll in the Microsoft Excel: Ultimate Mastery from Beginner to Pro course. From there, you can start learning at your own pace — pause, rewind, practice — and gradually build mastery.
Excel Tips to Keep in Your Back Pocket
To give you a head start, here are a few tips that’ll instantly improve your Excel game:
CTRL + Arrow Keys: Jump quickly across large datasets.
Use Named Ranges: They make formulas easier to read and manage.
Combine Functions: Nest IF, AND, OR for powerful logical analysis.
Flash Fill: Excel predicts and completes repetitive entries for you.
Use Tables for Dynamic Ranges: Automatically updates data references when new rows are added.
Of course, all these tricks (and hundreds more) are covered inside the course!
Final Thoughts: Excel Isn’t Optional Anymore
Whether you're building your career, managing your own business, or simply trying to stay organized, Excel is one skill that pays for itself many times over. And you don’t need to spend months trying to figure it all out.
With the Microsoft Excel: Ultimate Mastery from Beginner to Pro course, you’ll go from confused to confident — unlocking the full power of spreadsheets, dashboards, and data automation.
0 notes
Text
Is an Data Analytics Certification Course Worth It in 2025? Job Market Insights, Excel, VBA, SQL, MS Access, MS Power BI, Tableau. Alteryx, R Programming, "Business Analytics Certification Course in Delhi", 110004 -"Summer Offer 2025" Free Python Data Science Course" by SLA Consultants India,
A data analytics certification course in 2025 is unquestionably worth the investment for anyone looking to secure a stable, high-paying, and future-proof career. The job market for data analysts is thriving, with demand surging across industries such as finance, healthcare, retail, and technology. According to the U.S. Bureau of Labor Statistics, the job market for data analysts is projected to grow by 23% by 2032, reflecting the critical role these professionals play in helping organizations make data-driven decisions. Entry-level salaries have seen a significant jump, now averaging $90,000 in the U.S., while experienced analysts can command upwards of $111,000 annually—a clear indicator of the value employers place on analytical skills. Business Analyst Course in Delhi
Employers are actively seeking candidates who are proficient in a suite of essential tools, including Excel, VBA, SQL, MS Access, MS Power BI, Tableau, Alteryx, and R Programming. These skills are consistently highlighted in job postings, with Excel referenced in over 40% of listings, and data visualization tools like Tableau and Power BI also in high demand. The ability to bridge the gap between raw data and actionable business insights is especially prized, making analysts who combine technical expertise with business acumen highly sought after. The integration of AI and automation has not diminished the need for human analysts; instead, it has elevated their strategic importance, with 87% of analysts reporting they feel more valuable than ever before.
A Business Analytics Certification Course in Delhi, 110004 – Summer Offer 2025” with a Free Python Data Science Course by SLA Consultants India, are designed to equip learners with these in-demand skills. These programs offer hands-on training in both foundational and advanced analytics tools, including Python—a language that is increasingly required for automation, machine learning, and advanced analytics. The practical, project-based approach ensures that graduates are job-ready and able to tackle real-world business challenges from day one.
Business Analyst Training Course in Delhi
Beyond technical skills, a data analytics certification provides several additional benefits. It signals to employers your commitment to professional development and your readiness to adapt to new technologies. Many certification programs also offer placement support, helping graduates connect with top employers and secure roles in multinational companies or as freelancers for global clients. With the rise of remote work and the global nature of data-driven roles, certified analysts can access high-paying opportunities regardless of their location, further enhancing the value of these credentials.
Business Analyst Programme Modules Module 1 - Basic and Advanced Excel With Dashboard and Excel Analytics Module 2 - VBA / Macros - Automation Reporting, User Form and Dashboard Module 3 - SQL and MS Access - Data Manipulation, Queries, Scripts and Server Connection - MIS and Data Analytics Module 4 - Tableau | MS Power BI ▷ BI & Data Visualization Module 5 - Python | R Programing ▷ BI & Data Visualization Module 6 - Python Data Science and Machine Learning - 100% Free in Offer - by IIT/NIT Alumni Trainer
In summary, a data analytics certification course in 2025 is a smart investment for anyone seeking career growth, job security, and financial success. The combination of strong market demand, rising salaries, and the increasing strategic importance of data analysts makes this field one of the most promising career paths available today. By enrolling in a comprehensive program like the one offered by SLA Consultants India, you position yourself for long-term success in a rapidly evolving, data-driven world. For the more details Call: +91-8700575874 or Email: [email protected]
0 notes
Text
Inside the Course: What You'll Learn in GVT Academy's Data Analyst Program with AI and VBA

If you're searching for the Best Data Analyst Course with VBA using AI in Noida, GVT Academy offers a cutting-edge curriculum designed to equip you with the skills employers want in 2025. In an age where data is king, the ability to analyze, automate, and visualize information is what separates good analysts from great ones.
Let’s explore the modules inside this powerful course — from basic tools to advanced technologies — all designed with real-world outcomes in mind.
Module 1: Advanced Excel – Master the Basics, Sharpen the Edge
You start with Advanced Excel, a must-have tool for every data analyst. This module helps you upgrade your skills from intermediate to advanced level with:
Advanced formulas like XLOOKUP, IFERROR, and nested functions
Data cleaning techniques using Power Query
Creating interactive dashboards with Pivot Tables
Case-based learning from real business scenarios
This strong foundation ensures you're ready to dive deeper into automation and analytics.
Module 2: VBA Programming – Automate Your Data Workflow
Visual Basic for Applications (VBA) is a game-changer when it comes to saving time. Here’s what you’ll learn:
Automate tasks with macros and loops
Build interactive forms for better data entry
Develop automated reporting tools
Integrate Excel with external databases or emails
This module gives you a serious edge by teaching real-time automation for daily tasks, making you stand out in interviews and on the job.
Module 3: Artificial Intelligence for Analysts – Data Meets Intelligence
This is where things get futuristic. You’ll learn how AI is transforming data analysis:
Basics of machine learning with simple use cases
Use AI tools (like ChatGPT or Excel Copilot) to write smarter formulas
Forecast sales or trends using Python-based models
Explore AI in data cleaning, classification, and clustering
GVT Academy blends the power of AI and VBA to offer a standout Data Analyst Course in Noida, designed to help students gain a competitive edge in the job market.
Module 4: SQL – Speak the Language of Databases
Data lives in databases, and SQL helps you retrieve it efficiently. This module focuses on:
Writing SELECT, JOIN, and GROUP BY queries
Creating views, functions, and subqueries
Connecting SQL output directly to Excel and Power BI
Handling large volumes of structured data
You’ll practice on real datasets and become fluent in working with enterprise-level databases.
Module 5: Power BI – Turn Data into Stories
More than numbers, data analysis is about discovering what the numbers truly mean. In the Power BI module, you'll:
Import, clean, and model data
Create interactive dashboards for business reporting
Use DAX functions to create calculated metrics
Publish and share reports using Power BI Service
By mastering Power BI, you'll learn to tell data-driven stories that influence business decisions.
Module 6: Python – The Language of Modern Analytics
Python is one of the most in-demand skills for data analysts, and this module helps you get hands-on:
Python fundamentals: Variables, loops, and functions
Working with Pandas, NumPy, and Matplotlib
Data manipulation, cleaning, and visualization
Introduction to machine learning with Scikit-Learn
Even if you have no coding background, GVT Academy ensures you learn Python in a beginner-friendly and project-based manner.
Course Highlights That Make GVT Academy #1
👨🏫 Expert mentors with industry experience
🧪 Real-life projects for each module
💻 Live + recorded classes for flexible learning
💼 Placement support and job preparation sessions
📜 Certification recognized by top recruiters
Every module is designed with job-readiness in mind, not just theory.
Who Should Join This Course?
This course is perfect for:
Freshers wanting a high-paying career in analytics
Working professionals in finance, marketing, or operations
B.Com, BBA, and MBA graduates looking to upskill
Anyone looking to switch to data-driven roles
Final Words
If you're looking to future-proof your career, this course is your launchpad. With six powerful modules and job-focused training, GVT Academy is proud to offer the Best Data Analyst Course with VBA using AI in Noida — practical, placement-driven, and perfect for 2025.
📞 Don’t Miss Out – Limited Seats. Enroll Now with GVT Academy and Transform Your Career!
1. Google My Business: http://g.co/kgs/v3LrzxE
2. Website: https://gvtacademy.com
3. LinkedIn: www.linkedin.com/in/gvt-academy-48b916164
4. Facebook: https://www.facebook.com/gvtacademy
5. Instagram: https://www.instagram.com/gvtacademy/
6. X: https://x.com/GVTAcademy
7. Pinterest: https://in.pinterest.com/gvtacademy
8. Medium: https://medium.com/@gvtacademy
#gvt academy#data analytics#advanced excel training#data science#python#sql course#advanced excel training institute in noida#best powerbi course#power bi#advanced excel#vba
0 notes