#Waveanalysis
Explore tagged Tumblr posts
Visit Tumblr Blog
Explore Tumblr blogs with no restrictions, modern design and the best experience.
Last Seen Tumblr Blogs


Fun Fact
In Q3 of 2020, 31% of US users access the Tumblr app daily.
Text
PEPE Price Analysis: Approaching Long-Term Resistance Amid Bullish Sentiment
The price of PEPE has rebounded from a short-term descending resistance line but remains below the long-term resistance line. PEPE Approaching Long-Term Resistance Technical analysis on the weekly timeframe indicates that the price of PEPE has been declining beneath a long-term descending resistance line since May 2023. The decline led to a low of $0.00000059 in September. So far, the meme coin has made three unsuccessful breakout attempts (red markers) and is preparing for the fourth. The weekly Relative Strength Index (RSI) provides bullish signals: the indicator has risen above 50 and continues to climb. Analyst Insights Well-known crypto traders and analysts maintain a positive outlook on PEPE's prospects. Bluntz Capital believes that the meme coin has completed its correction and started a new upward movement. JJcycles speculates that PEPE will lead the upcoming meme coin season, while Crypto Michael notes the descending resistance line, stating that its breakout could accelerate the upward movement. PEPE Price Forecast: Will the Rally Continue? Analysis on the daily timeframe supports further growth due to price action and wave analysis. The chart below shows that PEPE has bounced off the descending resistance line and confirmed it as support. Wave analysis suggests that the asset has completed an upward movement and subsequent correction. If both upward movements have equal lengths, PEPE could rise by another 40% and reach the next resistance at $0.00000200. Despite the bullish forecast, a close below the $0.00000105 level could trigger a 55% decline to the nearest support at $0.00000060. Disclaimer All information published on our website is intended for general informational purposes only. The reader bears full responsibility for any actions taken based on the information provided on our website. Read the full article
#breakout#bullishforecast#bullishsentiment#cryptotraders#memecoin#PEPE#priceanalysis#RelativeStrengthIndex(RSI)#resistanceline#support#TechnicalAnalysis#waveanalysis
0 notes
Video
youtube
"Join us in the upcoming episode of WaveTalks & outlook for 26thJune2023 | BankNifty WaveAnalysis | कोटक 1625 की खरीद में छुपे असलियत का पता लगाएं | कोटक 1625 की खरीद में 'छुपे राज' का पता लगाएं As we dive deep into the performance of Kotak stock, which has been moving sideways between 2050 to 1600 for the last two years. When will this sideways journey end and why should we consider buying at 1625? We'll delve into these questions through wave perspective. A big thank you to all who participated in our poll (https://twitter.com/TalksWave/status/1672449094537842691). With 41% votes, Kotak Bank stood out among AUSmallFinance Bank, TCS, and Larsen & Toubro, making it the star of our Sunday special episode. As an Elliottician, I'll present an in-depth analysis of Kotak Bank stock, providing an outlook for the coming months and years. Additionally, we'll also discuss the Bank Nifty's projections for Monday's or tomorrow's session using wave analysis. If you enjoyed the fall in Tata Motors as per our last episode, stay tuned for more insights!"
0 notes
Photo

Gold Waves 9th July Consolidation Range 1818-1807/1801 Subscribe : $21 per Month Gold waves Chart Telegram Contact : UltimateForexSupport #forextrader #gold #xauusdsignals #waveanalysis https://www.instagram.com/p/CCZ5_SMBy3C/?igshid=e0qov4cg976o
1 note
·
View note
Text
Crypto Total Market Cap Intraday: Elliott Wave Analysis

#crypto#crypto trading#cryptowithraj#elliotwave#waveanalysis#brainmassfinance#brainmasstraders#tradewithraj#brainmasscommunity#chartbyraj
0 notes
Photo

Save your account by avoiding these costly mistakes.
#tradingforex#currencytrading#captial#tradingmistakes#tradenews#tradeevents#forexmentor#waveanalysis#traderpulse
0 notes
Photo

What is Scalping in Forex?
Forex scalping is a short-term trading strategy that attempts to make a profit out of small price movements within the forex market. Scalpers will buy and sell a foreign currency pair, only holding the position for a period of a few seconds or minutes.
.Follow Trade Global Market for more daily tips and analysis.
Leave a like if you want us to create more posts like this.
Get free live training for International trading (forex trading, CFD, commodities, indices, oil trading, etc)
www.tradeglobalmarket.com
#forextrading#forexeducation#forexmentor#waveanalysis#priceaction#financialfreedomtrading#foex#forextrader#swingtrading#forexprofit#technicalanalysis#priceactiontrading#tgm#tradeglobalmarket
0 notes
Photo

The range of electromagnetic wavelength seen by the human eye is very small. With advances in technology, we're able to gain great insight into the universe by studying it in the wavelength not detected by naked eye. NASA's Solar Dynamic Observatory (SDO) has instrument capable of capturing a wide range of wavelengths. This colorful image shown the sun in 10 different wavelengths . How amazing!! . Photo credit:@nasa . . Follow @atomstalk . . . . #light #electromagnetism #electromagnetic #lightspectrum #astronomyphotos #astronomylovers #astronomylover #astronomyart #spacelover #spacelovers #optics #waveanalysis #wavelength https://www.instagram.com/p/CB8SngRD-8M/?igshid=1vtd5b1w5bfre
#light#electromagnetism#electromagnetic#lightspectrum#astronomyphotos#astronomylovers#astronomylover#astronomyart#spacelover#spacelovers#optics#waveanalysis#wavelength
0 notes
Text
The Fourier Transform Theorem
This weekend I was bold enough to dive into the Fourier Transform Theorem and try to understand why it is considered one of the most useful and powerful algorithms used in the world today. As I was researching this area, in a way I opened up a Pandora’s Box as I kept going down countless rabbit holes without gaining a complete understanding of topic. As a result, I received a valuable, big picture understanding of the area of data transmission by waves and the Fourier Transform theorem. I will provide a brief overview of some of the key concepts I learned so far.
First, I want to dive into the Fourier Transform Theorem. This theorem is fairly abstract and takes some time to wrap your head around it so please bear with me. Before we get into the details, it is important to understand that the key principle of the Fourier Transform Theorem is that it takes a complex wave which oscillates over time and transforms the wave into a wave which is in the frequency domain. By completing this transformation, we are able to find the frequencies of all of the waves which are combined together to create the original, complex wave. Bellow is a great video which explains the basics of the Fourier Transform Theorem.
youtube
As shown in the video above, the frequency of the original complex wave which is measured in the time domain can be wrapped around a central point in the x-y plane. The amplitude of the wave is measured through the radial distance from the point of origin, and time is represented through the polar cordinates in the angular direction. When the wave is wrapped around a point of origin is this form, the tightness and looseness of the representation may be altered in order to provide useful information (To understand how this alteration occurs, I recommend watching the video above). As the wave is represented in this new form, the center of mass (the origin) hovers around the origin. When the cycles per second (rate at which the wave was wrapped around the origin) matches the frequency of one of the fundamental waves which was used to create the complex wave, the center of mass takes a serious deviation from the origin. As the deviation from the center of mass is recorded we are able to find the frequency of ALL of the waves which are complied together to create the complex, original wave. To accurately complete this analysis, the bellow formulas must be applied. Fourier was able to write these formulas by using the Euler’s formula for complex numbers. This formula not only allows the frequency to be recovered from the original wave, but also allows the amplitude to be found.

This theorem is extremely useful when transferring information through waves. For example, when audio is recorded a scientist can use the Fourier Transform Theorem to break down the complex audio wave into multiple sub waves of different frequencies and amplitudes. As these broken down sub waves are far simpler, a scientist can produce sound which represents them and by combing them all together the original audio may be replicated thus creating a synthesizer. Furthermore, certain waves may be excluded when bringing the sub waves together therefore filtering out any sound which may be preferred to be left out. This may be used to enhance sound or save space.
Audio only serves as one example of when the Fourier Transform Theorem may be applied. Others include, MRIs, X-Ray, differential equations and signal processing.
0 notes
Video
youtube
✨ AbraKaDabra 43700: BankNifty's Magical Bounce 📅 22nd June 2023 📺 Upcoming video on WaveTalks YouTube
🌊 Dive into the world of #WaveAnalysis! 🎯 Index dropped to 43700 & bounced back to 43950
Get ready for goosebumps! 👀 Stay tuned & don't miss out 👉 youtube.com/WaveTalks https://youtu.be/JyGEGXz9nAs via @YouTube
0 notes
Photo
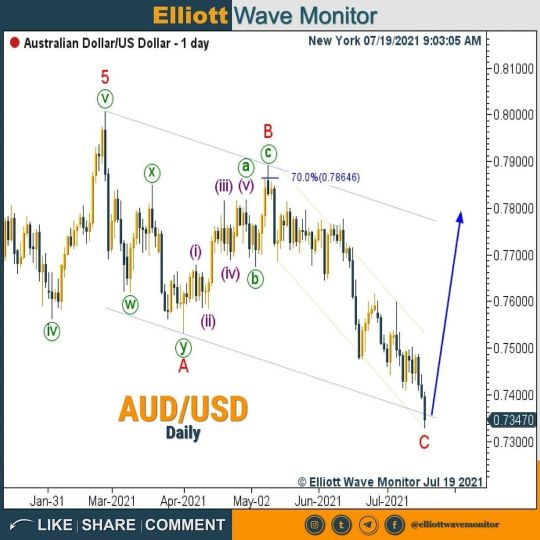
AUD/USD TimeFrame Daily ○ Daily Trend: Sideward Trend & 4 Hours Trend: Downward Trend ● Key Level: 0.72500 / Reflection Zone To Buy & Long/Above 0.75000 ○ Elliott Wave Patterns: Flat Disclaimer Investing carries risk of losses and trading futures are especially risky & may not be suitable for all the traders because they can lose more than their initial margin funds, therefore you should consider your investment experience as well as financial condition before deciding if trading is suitable for you. Information provided by @elliottwavemonitor is expressed in good faith The market service that never makes mistakes never exist and investing in market demands recognition that errors are part of any effort to evaluate future probabilities. #audusd #audcad #audnzd #audjpy #audnzd #gbpaud #audchf #investing #market #elliottwavemonitor #trendanalysis #tradingview #forexanalysis #technicalanalysis #analysis #fundamentalanalysis #chartanalysis #stockanalysis #marketanalysis #financialanalysis #waveanalysis #fxanalysis #tradinganalysis #forex #australia #australiagram #australianshepherd #elliottwave #tesla #teslastock #fb https://www.instagram.com/p/CRgpdKHspGq/?utm_medium=tumblr
#audusd#audcad#audnzd#audjpy#gbpaud#audchf#investing#market#elliottwavemonitor#trendanalysis#tradingview#forexanalysis#technicalanalysis#analysis#fundamentalanalysis#chartanalysis#stockanalysis#marketanalysis#financialanalysis#waveanalysis#fxanalysis#tradinganalysis#forex#australia#australiagram#australianshepherd#elliottwave#tesla#teslastock#fb
1 note
·
View note
Photo

Make more profits in your forex trading! Get Pipbreaker, the successful indicator, which has been performing with high accuracy for a long time. The real-time, no repaint indicator is a favorite fx tool for many successful traders. You would like to get proofs for the performances and here is a one for 85 pips in USD/CHF.
Reach us anytime! https://wetalktrade.com/best-indicator-for-mt4/
#pipbreaker#usdchf#forextrading#priceaction#technicalanalysis#waveanalysis#tradingaccounts#daytrader#forex#wetalktrade
0 notes
Link
A blog is about Stockmarket,forex,Commodity technical analysis ,Chart patterns , Gann theory analysis and Vedic Levels
0 notes
Photo

 1927 views 68 22 trendanalysis waveanalysis oscillator btcusd btcusdt divergence eliotwave Hi every one Bitcoin / U.S. Dollar If we use the Elliot wave principle on the BTC chart we can learn that the upward cycle of the BTC is far from over! the market has completed the first 3 Impulse waves and now on It's way to complete the 4th wave so the market will of course experience a good amount of decrease in it's price! after the completion of the 4th wave we shall see that will BTC starts to pump or not! there is a strong support at the end of the 4th wave so if it can make the pump we shall see that the price reaches 68k! Traders, if you liked this idea or have your opinion on it, write in the comments, We will be glad. Things can change... The markets are always changing and even with all these signals, the market changes tend to be strong and fast!! Thank you for seeing idea . Have a nice day and Good luck. https://www.instagram.com/p/CLtioDSjeAM/?igshid=1bc0jejdcaq8
0 notes
Text
XAUUSD to the floor
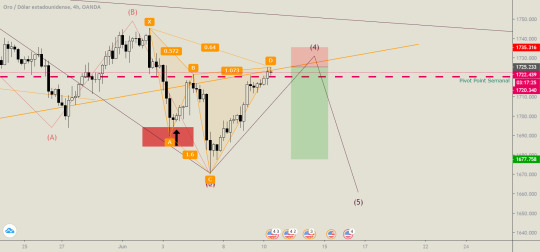

Corto Oro / Dólar estadounidense (OANDA:XAUUSD) VMTH OANDA:XAUUSD Oro / Dólar estadounidense Chart Patterns Wave Analysis Beyond Technical Analysis XAUUSD 115 visitas 4 3 chartpattern waveanalysis beyondta xauusd Vamos a ver cuantos barre hacia arriba, sean generosos con el sl por fa jajaja Comentario: y aún veo que sube un chance más, aguanten compeitors xD Read the full article
0 notes
Photo

"Technical Analysis Institute - Chartking Stock Market Analysis and Courses"
Mumbai Batch Memorable Picture. New Batch Starting In Delhi - 7 July 2018
CHARTKING - INSTITUTE PVT. LTD.
C - 133, first floor, Ramesh Nagar, Near Metro Station Gate No - 03, New Delhi - 110015 Contact No - +91 - 9911381731 Email ID - [email protected] Website - www.chartking.in/ Twitter - www.twitter.com/cifminstitute Instagram - www.instagram.com/chartkinginstitute/
0 notes
Photo

It's the luxury of entering early in a trade. Sit back and count the profits, that's it. 450 pip profit yielded so far, it's still running! Want such an experience? Get our premium analysis now! Android: https://play.google.com/store/apps/details?id=com.traderpulse.analysis IOS: https://apps.apple.com/app/forex-analysis/id1358603638 Web: https://analysis.traderpulse.com
#gold#waveanalysis#analysisapp#forexanalysis#metals#technicalanalysis#premiumanalysis#forextrading#forexperformance#chartpattern#forexmarket#traderpulse
0 notes