#What are the 7 data types in Tableau?
Explore tagged Tumblr posts
Visit Tumblr Blog
Explore Tumblr blogs with no restrictions, modern design and the best experience.
Last Seen Tumblr Blogs


Fun Fact
There are dozens of funny blogs to kill time on Tumblr.
Text
Understanding Tableau Data Types: The Key to Effective Visualizations

If you’re diving into Tableau, one of the most important concepts to grasp early on is how Tableau handles different types of data. Data types are fundamental because they tell Tableau how to interpret your information, which directly influences everything from filtering and grouping to analysis and dashboard design.
Whether you’re a beginner or enrolled in the Best Tableau Training in Chandigarh, mastering data types will help you avoid common pitfalls and build accurate, insightful dashboards. In this guide, we’ll explore Tableau’s key data types with clear examples and practical advice on when and how to use each.
Why Do Data Types Matter in Tableau?
Before getting into the details, let’s understand why data types are so important. Each field in Tableau is assigned a data type, guiding the software on how to treat the data. When your data types are set correctly, you’ll be able to perform precise calculations, apply the right filters, and create visualizations that truly represent your data story.
Imagine trying to calculate total sales from a field that Tableau mistakenly treats as text. This would lead to errors and confusion. Similarly, mapping location data won’t work properly unless Tableau recognizes it as geographic data.
Correct data types mean your dashboards run smoothly, your insights are trustworthy, and your analysis is meaningful.
The Six Main Data Types in Tableau
Here’s a straightforward look at the primary data types you’ll encounter in Tableau and how they fit into your projects.
1. String (Text)
String data includes any combination of letters, numbers, or symbols treated as text. This typically covers names, codes, or categorical labels.
Example: Customer Name, Region, Product Code.
You’ll use strings mainly for grouping, labeling, and filtering. For example, if you want to show sales by region, “Region” will be a string field to categorize the data correctly.
Tip: Keep an eye on case sensitivity with strings, as Tableau treats “USA” and “usa” differently. Consistent formatting here is essential.
2. Number (Integer and Decimal)
Numbers are vital for calculations and metrics. Tableau distinguishes between whole numbers (integers) and decimals (floating-point).
Example: Order Quantity (100), Revenue (250.75).
Numbers allow you to calculate totals, averages, percentages, and more. These fields form the backbone of KPIs and trend charts.
Tip: Always verify that Tableau recognizes your numbers correctly. Mistaking decimals for whole numbers can skew your calculations.
3. Date and Time
Date/time data lets Tableau understand when events occur, enabling powerful chronological analysis.
Example: Order Date (“2024-06-01”), Time (“12:30 PM”).
Using date and time fields, you can analyze trends over days, months, or years, spot seasonal patterns, and compare performance across periods.
Tip: Tableau automatically groups dates into years, quarters, months, or days, making it easier to explore data at different time scales.
4. Boolean
Boolean data has only two values: TRUE or FALSE. It’s perfect for yes/no or on/off situations.
Example: Is Active, Is New Customer.
Boolean fields are useful for filters and logical calculations, such as isolating all active customers or highlighting overdue payments.
Tip: You can create Boolean fields with calculated formulas like [Sales] > 1000 to flag high-value transactions.
5. Geographic
Tableau shines with geographic data, automatically mapping locations for spatial analysis.
Example: Country, State, ZIP Code, Latitude/Longitude.
Geographic data types enable map visualizations that reveal patterns by region, helping with customer distribution, sales territories, and more.
Tip: While Tableau often auto-detects geographic roles, verify and adjust them to ensure your maps are accurate and meaningful.
6. Cluster or Mixed Data Type
Sometimes, Tableau encounters fields that mix data types, often in raw or unstructured datasets.
Example: A field containing both text and numbers.
Mixed data types can slow down analysis or cause errors, so it’s best to clean or split these fields before visualizing.
Tip: Use data preparation tools or calculated fields to separate mixed types for smoother Tableau performance.
How to Identify and Change Data Types in Tableau
Tableau typically assigns data types automatically when you connect your data source, but it’s not always perfect. You can easily check and change data types by:
Right-clicking the field in the Data Pane
Selecting “Change Data Type”
Choosing the correct type from the dropdown list
Correcting data types early prevents errors, improves dashboard speed, and helps Tableau recommend the best visualization types for your data.
Conclusion
Data types are the foundation of effective data visualization in Tableau. Knowing how to identify, modify, and apply them correctly sets you apart as a skilled user who builds dashboards that are not only visually attractive but also accurate and insightful.
Whether you’re learning on your own or taking the Best Tableau Training in Chandigarh, start by practicing with sample datasets and focusing on data types. This small but vital step will unlock clearer insights and smoother analysis.
Remember, great dashboards begin with great data management. Master data types today, and watch your Tableau skills—and your data’s impact—grow.
0 notes
Text
Data Analysis: Turning Information into Insight
In nowadays’s digital age, statistics has come to be a vital asset for businesses, researchers, governments, and people alike. However, raw facts on its personal holds little value till it's far interpreted and understood. This is wherein records evaluation comes into play. Data analysis is the systematic manner of inspecting, cleansing, remodeling, and modeling facts with the objective of coming across beneficial information, drawing conclusions, and helping selection-making.
What Is Data Analysis In Research

What is Data Analysis?
At its middle, records analysis includes extracting meaningful insights from datasets. These datasets can variety from small and based spreadsheets to large and unstructured facts lakes. The primary aim is to make sense of data to reply questions, resolve issues, or become aware of traits and styles that are not without delay apparent.
Data evaluation is used in truely every enterprise—from healthcare and finance to marketing and education. It enables groups to make proof-based choices, improve operational efficiency, and advantage aggressive advantages.
Types of Data Analysis
There are several kinds of information evaluation, every serving a completely unique purpose:
1. Descriptive Analysis
Descriptive analysis answers the question: “What happened?” It summarizes raw facts into digestible codecs like averages, probabilities, or counts. For instance, a store might analyze last month’s sales to decide which merchandise achieved satisfactory.
2. Diagnostic Analysis
This form of evaluation explores the reasons behind beyond outcomes. It answers: “Why did it occur?” For example, if a agency sees a surprising drop in internet site visitors, diagnostic evaluation can assist pinpoint whether or not it changed into because of a technical problem, adjustments in search engine marketing rating, or competitor movements.
3. Predictive Analysis
Predictive analysis makes use of historical information to forecast destiny consequences. It solutions: “What is probable to occur?” This includes statistical models and system getting to know algorithms to pick out styles and expect destiny trends, such as customer churn or product demand.
4. Prescriptive Analysis
Prescriptive analysis provides recommendations primarily based on facts. It solutions: “What have to we do?” This is the maximum advanced type of analysis and often combines insights from predictive analysis with optimization and simulation techniques to manual selection-making.
The Data Analysis Process
The technique of information analysis commonly follows those steps:
1. Define the Objective
Before diving into statistics, it’s essential to without a doubt recognize the question or trouble at hand. A well-defined goal guides the entire analysis and ensures that efforts are aligned with the preferred outcome.
2. Collect Data
Data can come from numerous sources which includes databases, surveys, sensors, APIs, or social media. It’s important to make certain that the records is relevant, timely, and of sufficient high-quality.
3. Clean and Prepare Data
Raw information is regularly messy—it may comprise missing values, duplicates, inconsistencies, or mistakes. Data cleansing involves addressing these problems. Preparation may include formatting, normalization, or growing new variables.
Four. Analyze the Data
Tools like Excel, SQL, Python, R, or specialized software consisting of Tableau, Power BI, and SAS are typically used.
5. Interpret Results
Analysis isn't pretty much numbers; it’s about meaning. Interpreting effects involves drawing conclusions, explaining findings, and linking insights lower back to the authentic goal.
6. Communicate Findings
Insights have to be communicated effectively to stakeholders. Visualization tools including charts, graphs, dashboards, and reports play a vital position in telling the story behind the statistics.
7. Make Decisions and Take Action
The last aim of statistics analysis is to tell selections. Whether it’s optimizing a advertising marketing campaign, improving customer support, or refining a product, actionable insights flip data into real-global effects.
Tools and Technologies for Data Analysis
A big selection of gear is available for facts analysis, each suited to distinct tasks and talent levels:
Excel: Great for small datasets and short analysis. Offers capabilities, pivot tables, and charts.
Python: Powerful for complicated facts manipulation and modeling. Popular libraries consist of Pandas, NumPy, Matplotlib, and Scikit-learn.
R: A statistical programming language extensively used for statistical analysis and statistics visualization.
SQL: Essential for querying and handling information saved in relational databases.
Tableau & Power BI: User-friendly enterprise intelligence equipment that flip facts into interactive visualizations and dashboards.
Healthcare: Analyzing affected person statistics to enhance treatment plans, predict outbreaks, and control resources.
Finance: Detecting fraud, coping with threat, and guiding investment techniques.
Retail: Personalizing advertising campaigns, managing inventory, and optimizing pricing.
Sports: Enhancing performance through participant records and game analysis.
Public Policy: Informing choices on schooling, transportation, and financial improvement.
Challenges in Data Analysis
Data Quality: Incomplete, old, or incorrect information can lead to deceptive conclusions.
Data Privacy: Handling sensitive records requires strict adherence to privacy guidelines like GDPR.
Skill Gaps: There's a developing demand for skilled information analysts who can interpret complicated facts sets.
Integration: Combining facts from disparate resources may be technically hard.
Bias and Misinterpretation: Poorly designed analysis can introduce bias or lead to wrong assumptions.
The Future of Data Analysis
As facts keeps to grow exponentially, the sector of facts analysis is evolving rapidly. Emerging developments include:
Artificial Intelligence (AI) & Machine Learning: Automating evaluation and producing predictive fashions at scale.
Real-Time Analytics: Enabling decisions based totally on live data streams for faster reaction.
Data Democratization: Making records handy and understandable to everybody in an business enterprise
2 notes
·
View notes
Text
Top 10 Career Options After MBA in Digital Marketing (2025)
As businesses shift to digital platforms, there’s never been a better time to build a career in digital marketing. Companies need skilled professionals who can help them grow online. That’s where an MBA in Digital Marketing makes a big difference.
This program is more than just marketing — it teaches strategy, tools, trends, and how to lead digital teams. If you're planning to pursue this MBA, you're opening doors to some of the most rewarding and in-demand roles in 2025.

In this blog, let’s explore the top 10 career options after MBA in Digital Marketing. We’ll also take a look at Digital Scholar, a top digital marketing institute that offers an advanced MBA-style program designed to help you succeed in today’s competitive job market.
What is an MBA in Digital Marketing?
An MBA in Digital Marketing is a professional program focused on online business growth. It blends marketing concepts with digital strategies such as:
SEO (Search Engine Optimization)
SEM (Search Engine Marketing)
Social Media Management
Email Campaigns
Content Creation
Web Analytics
Brand Building
This type of MBA prepares you to lead marketing campaigns, analyze data, and manage digital projects across industries.
Why Choose Digital Scholar for Your MBA Journey?
Founded by Sorav Jain, one of India’s leading digital marketers, and co-founded by Rishi Jain, Digital Scholar offers a 1-Year MBA-style Digital Marketing program that stands out.
What makes it different?
Practical Learning – Real-time projects and industry simulations
Online & Offline Options – Study from anywhere or attend in Chennai
Certifications – Google, Meta, HubSpot & more
Placement Support – 100% placement assistance with top brands
Agency-Style Training – Work like you're in a real agency
If you're looking for an institute that offers the right mix of theory and real-world skills, Digital Scholar is the place to go.
Location: 1st Floor, 8/37, Rajasekaran Street, T. Nagar, Chennai – 600017 Phone: +91-9169231231 Website: www.digitalscholar.in
Top 10 Career Options After MBA in Digital Marketing (2025)
Let’s take a closer look at the most promising career paths available after this MBA.
1. Digital Marketing Strategist
In this role, you design and plan online marketing strategies. You’ll decide which platforms to use, how to target the audience, and what tools can help achieve business goals.
Skills Needed: Market analysis, consumer behavior, channel planning Salary Range: ₹8–14 LPA
2. Search Engine Marketing (SEM) Specialist
SEM Specialists manage paid ads on platforms like Google and Bing. You'll monitor ad budgets, create campaigns, and analyze ROI (Return on Investment).
Skills Needed: Google Ads, keyword research, A/B testing Salary Range: ₹6–12 LPA
3. Social Media Marketing Manager
As a Social Media Manager, you’ll build a brand’s voice on platforms like Instagram, Facebook, LinkedIn, and YouTube. From content creation to engagement tracking, it’s a full creative role.
Skills Needed: Trend research, campaign management, content planning Salary Range: ₹5–10 LPA
4. Marketing Analyst
Marketing Analysts dive deep into customer behavior and campaign performance. They use data to guide decisions and improve results.
Skills Needed: Google Analytics, Excel, Tableau, data storytelling Salary Range: ₹7–13 LPA
5. E-Commerce Marketing Manager
If you enjoy online shopping platforms, this is your domain. E-Commerce Managers focus on increasing traffic, conversions, and revenue through digital channels.
Skills Needed: Shopify, WooCommerce, PPC, analytics Salary Range: ₹7–15 LPA
6. Content Strategy Manager
Good content drives traffic and sales. As a Content Strategy Manager, you’ll plan blog topics, video ideas, social media posts, and ensure everything aligns with brand goals.
Skills Needed: SEO writing, brand voice, editorial calendar Salary Range: ₹6–11 LPA
7. Email Marketing Manager
Emails may be old, but they’re still gold! This role involves planning email campaigns, building subscriber lists, and tracking performance.
Skills Needed: Email tools (like Mailchimp), segmentation, copywriting Salary Range: ₹5–9 LPA
8. Performance Marketing Manager
These experts manage results-driven campaigns, especially in paid advertising. Their goal? Maximum ROI using minimal budget.
Skills Needed: Google Ads, Facebook Ads, landing page optimization Salary Range: ₹8–16 LPA
9. Influencer Campaign Manager
Brands use influencers to connect with niche audiences. This role involves selecting the right influencers, managing campaigns, and tracking engagement.
Skills Needed: Influencer discovery, campaign planning, social trends Salary Range: ₹5–10 LPA
10. Digital Marketing Consultant / Agency Owner
If you dream of running your own business, this one’s for you. As a consultant or agency owner, you can offer services like SEO, branding, content marketing, and more to clients worldwide.
Skills Needed: Business planning, service development, client communication Income: Depends on clients/projects – can go above ₹15 LPA
Bonus Roles to Explore
The world of digital marketing keeps expanding. With the right skills, you can also become a:
Affiliate Marketing Expert
Mobile Marketing Manager
Product Marketing Manager
Digital Media Buyer
Brand Strategist
Each of these roles rewards creativity, strategy, and a strong understanding of digital tools — exactly what you learn during an MBA in Digital Marketing.
The Future of Digital Marketing Careers (2025 and Beyond)
With AI, automation, and voice search becoming common, digital marketing is evolving fast. Companies need professionals who can adapt, think critically, and use the latest tools effectively.
By 2025:
80% of customer interactions will be digital-first
AI tools will dominate campaign planning and reporting
Data-driven roles will see 2x job growth
Freelancing and remote digital jobs will become mainstream
An MBA in Digital Marketing ensures you're not just part of this future — you're leading it.
Build Your Career with Digital Scholar’s MBA-Style Program
Digital Scholar’s 1-Year MBA Program in Digital Marketing is designed with one goal: to make you industry-ready.
What Makes It Unique?
Agency-Style Training Live Projects & Case Studies Offline + Online Learning Modes Global Certifications Soft Skill & Interview Coaching Personal Branding Sessions 100% Placement Assistance
This program is ideal for students, working professionals, and entrepreneurs who want to stand out in the digital space.
How to Enroll at Digital Scholar
Getting started is easy. Simply connect with the Digital Scholar team and get personalized guidance for your digital journey.
Address: Digital Scholar, 1st Floor, 8/37, Rajasekaran Street, T. Nagar, Chennai, Tamil Nadu 600017
Phone: +91-9169231231 Website: www.digitalscholar.in
Conclusion
An MBA in Digital Marketing gives you more than just a degree — it opens the door to powerful career paths. From leading paid campaigns to managing social media, from writing high-converting content to consulting global brands, the opportunities are limitless.
But the key is choosing the right institute. With Digital Scholar, you get mentorship from the best, practical training that works, and the confidence to take on the digital world.
So, if you're ready to unlock your potential and build a career that’s future-proof, start your journey with Digital Scholar today.
0 notes
Text
The Best Data Visualization Techniques and Tools for Strategic Decision-Making
In the age of big data and real-time analytics, the ability to extract insights and communicate them clearly is paramount. Data visualization has emerged as a mission-critical function for business leaders, analysts, and strategists across all industries. But with an abundance of tools, techniques, and design frameworks available, identifying the best data visualization practices is essential for effective decision-making.
This guide explores the most impactful data visualization methods, best-in-class tools, and professional standards to elevate your organization's data strategy in 2025 and beyond.
What is Data Visualization?
Data visualization is the graphical representation of information and data through visual elements such as charts, graphs, infographics, and interactive dashboards. It enables stakeholders to interpret complex datasets, discover trends, and make data-driven decisions with clarity and speed.
High-quality visualizations transform abstract numbers into actionable intelligence, aligning decision-makers across departments and accelerating strategic outcomes.
Why Data Visualization is a Strategic Priority
As organizations generate massive volumes of structured and unstructured data, traditional reporting methods fall short. The best data visualization practices offer significant advantages:
Clarity – Translate complex analytics into digestible visual narratives.
Speed – Enable faster comprehension of trends, anomalies, and correlations.
Alignment – Facilitate clear communication between technical teams and executives.
Actionability – Highlight areas for improvement, opportunity, or intervention.
Engagement – Elevate stakeholder interest and retention through compelling visuals.
In an increasingly competitive landscape, companies that leverage data visualization effectively gain a measurable edge in agility and innovation.
Top Data Visualization Techniques for Business Intelligence
Professionals must select the appropriate visualization type based on the context, audience, and objective of the data. Below are some of the most effective and widely applied methods:
1. Bar and Column Charts
Ideal for comparing discrete categories or values. They are simple, versatile, and suitable for most business dashboards.
2. Line Graphs
Best for tracking changes over time. Common in financial reporting, forecasting, and operational monitoring.
3. Heatmaps
Used for identifying patterns or intensity within data sets. Often deployed in website analytics, correlation matrices, and customer behavior analysis.
4. Scatter Plots
Illustrate relationships and correlations between two variables. Useful in market research, statistical modeling, and quality control.
5. Geographic Maps
Essential for location-based data. Businesses use these to analyze regional performance, logistics networks, or demographic distributions.
6. Treemaps and Sunburst Charts
Efficient in displaying hierarchical data within a compact space. Frequently used in portfolio breakdowns and organizational data.
7. Gantt Charts
Used for project planning and tracking. Visualize tasks, timelines, dependencies, and resource allocation.
8. Interactive Dashboards
Combine multiple visualizations into a single, dynamic interface for real-time monitoring and analysis. Often employed in executive reporting and enterprise-wide KPIs.
Best Data Visualization Tools in 2025
Selecting the right tool is just as important as choosing the right chart. Here are the top-tier platforms professionals use to create powerful visualizations:
Tool
Key Strengths
Use Case Scenarios
Tableau
Enterprise-grade analytics, drag-and-drop UI
Corporate BI, executive dashboards
Microsoft Power BI
Seamless integration with Microsoft ecosystem
Internal reporting, financial data modeling
Looker (Google Cloud)
Embedded analytics, real-time metrics
Cloud-native dashboards, SaaS products
D3.js
Fully customizable via JavaScript
Advanced, interactive, web-based visualizations
Qlik Sense
Associative data model for self-service BI
Departmental analytics, ad hoc exploration
Plotly / Dash
Python-based, high-quality visuals
Scientific research, custom applications
Google Data Studio
Free and easy to use for Google users
Marketing and digital analytics
Infogram
Fast, design-driven infographics
Content marketing, reports, presentations
Best Practices for Professional Data Visualization
Even with the best tools, poor execution can undermine the message. Apply these professional best practices for optimal impact:
✅ Design for the Audience
Tailor visualizations to the data literacy level and expectations of the target audience—executives, analysts, or customers.
✅ Prioritize Clarity Over Aesthetics
Avoid unnecessary embellishments. Every design element should serve a purpose and support data interpretation.
✅ Select the Right Chart for the Right Story
Match the chart type to the analytical question: comparison, composition, distribution, or relationship.
✅ Maintain Data Integrity
Ensure that all visualizations are statistically accurate and contextually honest. Misleading scales or incomplete data can erode trust.
✅ Tell a Story with the Data
Use titles, annotations, and progressive layout to guide the viewer toward the insight—not just the image.
✅ Use Color Intelligently
Colors should highlight key insights, not distract. Stick to accessible palettes and maintain consistency across dashboards.
Industry Applications: Real-World Use Cases
📈 Financial Services
Risk analysis, portfolio monitoring, and regulatory reporting with real-time dashboards and trend visualizations.
🏥 Healthcare
Visualizing patient outcomes, clinical trials, and resource allocation for enhanced operational decisions.
🛒 Retail & E-Commerce
Sales performance tracking, inventory optimization, and customer segmentation through dynamic charts and heatmaps.
🚀 Technology & SaaS
User behavior, product engagement, and A/B test results visualized to inform product and marketing strategies.
🌍 Supply Chain & Logistics
Route optimization, delivery efficiency, and supplier performance monitored through geospatial and temporal data.
Conclusion: Elevating Strategy Through the Best Data Visualization
In an environment where speed, clarity, and precision drive results, the best data visualization practices empower businesses to harness the full potential of their data. By combining the right techniques, tools, and storytelling strategies, organizations can transform raw data into a strategic asset.
0 notes
Text
Essential Skills for Digital Jobs

In today’s fast moving digital world, businesses are evolving, and also jobs. Whether you want to work remotely, freelance, or a full-time role in a growing tech company, digital jobs are everywhere. Employers and clients are looking for people with the right skills, mindset, and adaptability to thrive in a fast changing environment. So, what skills do you really need to succeed in digital careers today?
Let��s break it down.
1. Digital Literacy
Digital literacy means being confident and efficient with technology. It’s not just about typing fast or checking email. It’s about knowing how to navigate digital tools like-
Basic Computer Proficiency - Microsoft Office, Google Workspace
Cloud Computing - Google Drive, Dropbox, AWS
Collaboration Tools - Trello, Zoom
These basic tools can put you ahead.
2. Adaptability & Willingness
Digital industries evolve quickly. One day it's SEO, and the next it’s AI driven content or no code tools.

You don’t have to know it all, but you need to be open to learning and adapting these skills. The best digital professionals are lifelong learners.
3. Time Management & Self-Discipline
No one is watching you when you work from home, that freedom is great, but only if you know how to manage your time well. Managing your schedule, staying focused, and hitting deadlines without being micromanaged sets professionals apart. Tools like Notion and Google Calendar can help, but discipline starts with you.
4. Critical Thinking & Problem Solving
Digital jobs often involve unexpected challenges like glitches in code,campaign issues, UX hurdles, performance drops and unclear feedback. Employers love those people who take initiative, think critically, identify the root of a problem and find solutions, not just follow instructions.
5. Communication Skills
Whether you're writing an email, leading a Zoom call, or giving feedback, communication is everywhere. Whether you're a designer, developer, or marketer, being able to express your thoughts clearly both in writing and verbally is a superpower in digital jobs, especially remote ones.
6. Data Analysis
You don’t need to be a data analyst, but should know how to read metrics. Whether it’s website analytics, social media insights or ad performance to understanding data helps you make smarter decisions. Knowing how to track performance and adjust strategies based on data gives you a huge advantage.
7. Technical Skills
Depending on the career path, you might need specific technical skills like:
For marketers - SEO, email marketing, paid ads, CRM tools
For developers - Coding languages like Python, PHP, JavaScript, JAVA, .NET, CSS, HTML
For designers - Tools like Figma, Canva, WordPress, Adobe Creative Suite
For analysts - Excel, SQL, data visualization tools like Tableau
Focusing on the right technical skills for your industry will make you even more job ready.
Conclusion
Digital jobs are exciting, rewarding, and full of potential but they require a mix of skills. Digital Literacy, Adaptability, Communication, Time Management, Data Analysis and some Technical knowledge. So, if you’re dreaming of a flexible, future-proof career, start building these digital Skills today.
1 note
·
View note
Text
Top Data Analysis Methods in 2025: A Complete Guide for Beginners and Professionals

🚀 Introduction: Why Data Analysis Methods Matter Today
We live in a world overflowing with data—from social media stats and website clicks to sales transactions and customer feedback. But raw data alone is meaningless. It’s only through the use of data analysis methods that we can extract actionable insights and make informed decisions.
Whether you’re a business owner, student, analyst, or entrepreneur, understanding data analysis methods is no longer optional—it’s essential.
In this article, we’ll explore the most widely used data analysis methods, their benefits, tools, use cases, expert opinions, and FAQs—all written in a human-friendly, easy-to-understand tone.
🔍 What Are Data Analysis Methods?
Data analysis methods are systematic approaches used to examine, transform, and interpret data to discover patterns, trends, and insights. These methods range from simple descriptive statistics to complex predictive algorithms.
By using the right method, businesses and analysts can:
📈 Identify trends
💡 Solve business problems
🔮 Forecast future outcomes
🎯 Improve performance
📘 Types of Data Analysis Methods
Here’s a detailed breakdown of the major types of data analysis methods you should know in 2025:
1. Descriptive Analysis
Goal: Summarize historical data to understand what has happened. Example: Monthly revenue report, user growth trends.
Techniques Used:
Mean, median, mode
Frequency distribution
Data visualization (charts, graphs)
Best Tools: Excel, Tableau, Google Data Studio
2. Exploratory Data Analysis (EDA)
Goal: Explore the dataset to uncover initial patterns, detect outliers, and identify relationships. Example: Discovering patterns in customer purchase history.
Techniques Used:
Box plots, scatter plots, heat maps
Correlation matrix
Data cleaning
Best Tools: Python (Pandas, Matplotlib), R, Power BI
3. Inferential Analysis
Goal: Make predictions or generalizations about a larger population based on sample data. Example: Predicting election results based on sample polling.
Techniques Used:
Hypothesis testing
Confidence intervals
T-tests, chi-square tests
Best Tools: SPSS, R, Python (SciPy)
4. Diagnostic Analysis
Goal: Determine the causes of a past event or outcome. Example: Why did the bounce rate increase last month?
Techniques Used:
Root cause analysis
Regression analysis
Data mining
Best Tools: SQL, Power BI, SAS
5. Predictive Analysis
Goal: Forecast future outcomes based on historical data. Example: Predicting next month’s sales based on seasonal trends.
Techniques Used:
Machine learning (decision trees, random forest)
Time series analysis
Neural networks
Best Tools: Python (Scikit-learn, TensorFlow), IBM Watson
6. Prescriptive Analysis
Goal: Recommend actions based on predicted outcomes. Example: Suggesting product pricing for maximum profitability.
Techniques Used:
Optimization
Simulation modeling
Decision trees
Best Tools: MATLAB, Excel Solver, Gurobi
7. Quantitative Analysis
Goal: Focus on numerical data to understand trends and measure outcomes. Example: Measuring website conversion rates.
Techniques Used:
Statistical modeling
Data aggregation
Regression
8. Qualitative Analysis
Goal: Analyze non-numerical data like text, images, or videos. Example: Analyzing customer reviews or survey responses.
Techniques Used:
Sentiment analysis
Thematic coding
Content analysis
Best Tools: NVivo, Lexalytics, Google NLP API
💼 Use Cases of Data Analysis Methods in the Real World
Here’s how businesses use these methods across industries:
🛍 Retail
Method Used: Predictive & diagnostic
Purpose: Forecast demand, understand sales dips
💳 Banking
Method Used: Inferential & prescriptive
Purpose: Detect fraud, assess risk
🏥 Healthcare
Method Used: Diagnostic & descriptive
Purpose: Patient outcome analysis, treatment optimization
📱 Tech Companies
Method Used: Exploratory & predictive
Purpose: App usage patterns, churn prediction
🛠 Best Tools for Applying Data Analysis Methods
Tool NameKey FeaturesSuitable ForExcelCharts, pivot tables, formulasBeginnersPythonML, EDA, statistical analysisIntermediate to ExpertR LanguageStatistical modeling, data visualizationIntermediateTableauVisual dashboardsBusiness analystsPower BIIntegration with Microsoft appsEnterprisesSQLQuerying large datasetsData engineers
🌟 Real Reviews From Experts
“I started with Excel for simple descriptive analysis and gradually moved to Python for predictive modeling. The transition was smoother than I expected.” – Neha D., Data Analyst at a Startup
“We used prescriptive methods in Power BI to optimize our logistics routes. Saved us 20% in transport costs within three months.” – Arjun K., Supply Chain Manager
“Using EDA methods helped us detect user drop-off points in our app, which we quickly fixed.” – Priya S., UX Designer
📌 Step-by-Step Guide to Choosing the Right Data Analysis Method
Define Your Objective: What do you want to find out?
Identify Data Type: Is it qualitative or quantitative?
Choose Your Tool: Based on your team’s skill level.
Clean the Data: Remove duplicates, null values, outliers.
Apply the Method: Use the appropriate model/technique.
Visualize & Interpret: Create charts to simplify interpretation.
Take Action: Use insights to make data-driven decisions.
❓ Frequently Asked Questions (FAQs)
🔹 Q1. What is the difference between data analysis methods and data analysis techniques?
A: Methods refer to the broad approach (e.g., descriptive, predictive), while techniques are specific tools or processes (e.g., regression, clustering).
🔹 Q2. Which data analysis method should I use as a beginner?
A: Start with descriptive and exploratory analysis. These are easy to learn and highly insightful.
🔹 Q3. Do I need coding skills to use these methods?
A: Not always. Tools like Excel, Tableau, and Power BI require minimal to no coding. For advanced analysis (e.g., machine learning), coding helps.
🔹 Q4. Can I use multiple methods in one project?
A: Absolutely! Many real-world projects use a combination of methods for deeper insights.
🔹 Q5. Which is the most powerful data analysis method?
A: That depends on your goal. For forecasting, predictive analysis is powerful. For decision-making, prescriptive analysis works best.
🧠 Tips to Master Data Analysis Methods in 2025
📝 Take online courses (Coursera, Udemy, DataCamp)
💻 Practice with real datasets (Kaggle, Google Dataset Search)
🧮 Understand the math behind techniques
📊 Visualize findings to communicate better
👥 Collaborate with other analysts and teams
✅ Conclusion: Your Data, Your Power
Data is no longer just for analysts or IT professionals. In 2025, knowing how to use data analysis methods can set you apart in virtually any profession. From optimizing marketing campaigns to launching new products, these methods empower you to make data-driven decisions with confidence.
So whether you’re just starting out or looking to level up, keep experimenting, keep analyzing, and let your data tell the story.
🌐 Read more expert data analysis content at diglip7.com 📩 Have questions? Drop a comment or connect with us for consultation.
0 notes
Text
Essential Skills Every Data Scientist Must Learn in 2025

The world of data science is evolving faster than ever, and staying ahead of the curve in 2025 requires a strategic approach to skill development. As businesses rely more on data-driven decision-making, data scientists must continuously refine their expertise to remain competitive in the field. Whether you're an aspiring data scientist or an experienced professional, mastering the right skills is crucial for long-term success.
1. Mastering Programming Languages
At the core of data science lies programming. Proficiency in languages like Python and R is essential for handling data, building models, and deploying solutions. Python continues to dominate due to its versatility and rich ecosystem of libraries such as Pandas, NumPy, Scikit-learn, and TensorFlow.
Key Programming Skills to Focus On:
Data manipulation and analysis using Pandas and NumPy
Implementing machine learning models with Scikit-learn
Deep learning and AI development with TensorFlow and PyTorch
Statistical computing and data visualization with R
2. Strong Foundation in Statistics and Probability
A deep understanding of statistics and probability is non-negotiable for data scientists. These concepts form the backbone of data analysis, helping professionals derive meaningful insights and create predictive models.
Why It’s Important:
Enables accurate hypothesis testing
Supports decision-making with probability distributions
Strengthens machine learning model evaluation
3. Expertise in Machine Learning and Deep Learning
With AI and automation becoming more prevalent, machine learning and deep learning skills are in high demand. Data scientists need to stay updated with advanced techniques to develop intelligent models that can solve complex problems.
Key Areas to Focus On:
Supervised and unsupervised learning techniques
Reinforcement learning and neural networks
Hyperparameter tuning and model optimization
Understanding AI ethics and bias mitigation
For those looking to upskill in machine learning, the Machine Learning Course in Kolkata offers practical, hands-on training. This program is designed to equip learners with the latest industry knowledge and techniques to advance their careers.
4. Data Wrangling and Preprocessing Skills
Data in its raw form is often messy and incomplete. Being able to clean, structure, and preprocess data is a vital skill that every data scientist must master.
Essential Data Wrangling Skills:
Handling missing and inconsistent data
Normalization and standardization techniques
Feature selection and engineering for improved model performance
5. Knowledge of Big Data Technologies
The rise of big data has made it essential for data scientists to work with tools and frameworks designed for handling massive datasets efficiently.
Tools Worth Learning:
Apache Spark for large-scale data processing
Hadoop for distributed storage and computation
Google BigQuery for cloud-based data analytics
6. Data Visualization and Storytelling
Turning raw data into actionable insights requires effective communication. Data scientists should be adept at using visualization tools to present findings in a compelling and understandable way.
Best Practices:
Choose the right visualization type (e.g., bar charts, scatter plots, heatmaps)
Keep charts clean and easy to interpret
Use tools like Matplotlib, Seaborn, Tableau, and Power BI
7. Cloud Computing and MLOps
Cloud platforms are transforming the way data scientists build and deploy models. A strong understanding of cloud-based tools and MLOps practices is crucial in modern data science workflows.
What You Should Learn:
Deploying ML models on cloud platforms like AWS, Google Cloud, and Azure
Implementing MLOps for model lifecycle management
Using Docker and Kubernetes for scalable deployments
8. Domain Knowledge and Business Acumen
While technical skills are critical, understanding the industry you work in can set you apart. A data scientist with domain expertise can develop more impactful and relevant solutions.
Why It Matters:
Helps tailor data-driven strategies to specific industries
Improves collaboration with stakeholders
Enhances problem-solving with business context
9. Soft Skills: Critical Thinking and Effective Communication
Technical know-how is just one part of the equation. Data scientists must also possess strong analytical and problem-solving skills to interpret data effectively and communicate findings to both technical and non-technical audiences.
Key Soft Skills to Develop:
Clear and concise storytelling through data
Adaptability to emerging technologies and trends
Collaboration with cross-functional teams
10. Ethics in AI and Data Governance
As AI systems influence more aspects of daily life, ethical considerations and regulatory compliance have become increasingly important. Data scientists must ensure fairness, transparency, and adherence to privacy regulations like GDPR and CCPA.
Best Practices for Ethical AI:
Identifying and mitigating bias in machine learning models
Implementing robust data privacy and security measures
Promoting transparency in AI decision-making processes
Final Thoughts
In the ever-changing landscape of data science, continuous learning is the key to staying relevant. By mastering these essential skills in 2025, data scientists can future-proof their careers and contribute to the advancement of AI-driven innovations. If you're looking to gain practical expertise, the Data Science Program offers industry-focused training that prepares you for real-world challenges.
Whether you're just starting or looking to refine your skills, investing in these areas will keep you ahead of the curve in the dynamic world of data science.
#best data science institute#data science course#data science training#ai training program#online data science course#data science program#Best Data Science Programs#Machine Learning Course in Kolkata
0 notes
Text
What are the top Python libraries for data science in 2025? Get Best Data Analyst Certification Course by SLA Consultants India
Python's extensive ecosystem of libraries has been instrumental in advancing data science, offering tools for data manipulation, visualization, machine learning, and more. As of 2025, several Python libraries have emerged as top choices for data scientists:
1. NumPy
NumPy remains foundational for numerical computations in Python. It provides support for large, multi-dimensional arrays and matrices, along with a collection of mathematical functions to operate on them. Its efficiency and performance make it indispensable for data analysis tasks. Data Analyst Course in Delhi
2. Pandas
Pandas is essential for data manipulation and analysis. It offers data structures like DataFrames, which allow for efficient handling and analysis of structured data. With tools for reading and writing data between in-memory structures and various formats, Pandas simplifies data preprocessing and cleaning.
3. Matplotlib
For data visualization, Matplotlib is a versatile library that enables the creation of static, animated, and interactive plots. It supports various plot types, including line plots, scatter plots, and histograms, making it a staple for presenting data insights.
4. Seaborn
Built on top of Matplotlib, Seaborn provides a high-level interface for drawing attractive statistical graphics. It simplifies complex visualization tasks and integrates seamlessly with Pandas data structures, enhancing the aesthetic appeal and interpretability of plots. Data Analyst Training Course in Delhi
5. Plotly
Plotly is renowned for creating interactive and web-ready plots. It offers a wide range of chart types, including 3D plots and contour plots, and is particularly useful for dashboards and interactive data applications.
6. Scikit-Learn
Scikit-Learn is a comprehensive library for machine learning, providing simple and efficient tools for data mining and data analysis. It supports various machine learning tasks, including classification, regression, clustering, and dimensionality reduction, and is built on NumPy, SciPy, and Matplotlib. Data Analyst Training Institute in Delhi
7. Dask
Dask is a parallel computing library that scales Python code from multi-core local machines to large distributed clusters. It integrates seamlessly with libraries like NumPy and Pandas, enabling scalable and efficient computation on large datasets.
8. PyMC
PyMC is a probabilistic programming library for Bayesian statistical modeling and probabilistic machine learning. It utilizes advanced Markov chain Monte Carlo and variational fitting algorithms, making it suitable for complex statistical modeling.
9. TensorFlow and PyTorch
Both TensorFlow and PyTorch are leading libraries for deep learning. They offer robust tools for building and training neural networks and have extensive communities supporting their development and application in various domains, from image recognition to natural language processing. Online Data Analyst Course in Delhi
10. NLTK and SpaCy
For natural language processing (NLP), NLTK and SpaCy are prominent libraries. NLTK provides a wide range of tools for text processing, while SpaCy is designed for industrial-strength NLP, offering fast and efficient tools for tasks like tokenization, parsing, and entity recognition.
These libraries collectively empower data scientists to efficiently process, analyze, and visualize data, facilitating the extraction of meaningful insights and the development of predictive models.
Data Analyst Training Course Modules Module 1 - Basic and Advanced Excel With Dashboard and Excel Analytics Module 2 - VBA / Macros - Automation Reporting, User Form and Dashboard Module 3 - SQL and MS Access - Data Manipulation, Queries, Scripts and Server Connection - MIS and Data Analytics Module 4 - MS Power BI | Tableau Both BI & Data Visualization Module 5 - Free Python Data Science | Alteryx/ R Programing Module 6 - Python Data Science and Machine Learning - 100% Free in Offer - by IIT/NIT Alumni Trainer
Regarding the "Best Data Analyst Certification Course by SLA Consultants India," I couldn't find specific information on such a course in the provided search results. For the most accurate and up-to-date details, I recommend visiting SLA Consultants India's official website or contacting them directly to inquire about their data analyst certification offerings. For more details Call: +91-8700575874 or Email: [email protected]
0 notes
Text
Top Data Visualization Tools for Financial Data Analysis
In the finance industry, data is everything. Making sense of complex financial metrics, stock trends, and economic indicators requires robust financial data visualization tools. These tools help analysts, investors, and business leaders make data-driven decisions quickly and accurately. But with so many options, how do you choose the right one?
In this article, we will explore the top data visualization tools for financial data analysis, discuss key data visualization components, and analyze the latest data visualization trends. Whether you’re a data visualization consultant or an industry professional, this guide will help you navigate the best tools available today.

1. What is Financial Data Visualization?
Financial data visualization refers to the graphical representation of financial metrics, stock performance, market trends, and economic indicators. It helps businesses and investors understand patterns and insights more effectively than raw numbers.
2. Why is Data Visualization Important in Finance?
Finance professionals deal with huge datasets that can be overwhelming. Data visualization tools simplify complex data, allowing quicker decision-making, risk analysis, and forecasting. Would you rather analyze thousands of numbers in a spreadsheet or quickly spot trends in a well-designed chart?
3. Key Features of Financial Data Visualization Tools
Real-time data updates for stock market tracking
Interactive dashboards to drill down into specifics
Customizable graphs and charts for deeper analysis
Integration with financial databases for seamless reporting
Predictive analytics for forecasting trends
4. Top Data Visualization Tools for Finance
Let's dive into the best financial data visualization tools that are widely used in the industry.
5. Power BI: Best for Business Analytics
Power BI by Microsoft is a top-tier tool with AI-powered insights, automated reporting, and seamless Excel integration. It is widely used for financial dashboards in enterprises.
6. Tableau: Advanced Data Exploration
Tableau is ideal for finance professionals who need interactive dashboards and in-depth data exploration. It offers drag-and-drop functionality and advanced analytics for detailed insights.
7. D3.js: Customizable and Powerful
D3.js is a JavaScript library that enables highly customized, dynamic visualizations. Financial analysts who need specific, tailored visual representations benefit the most from this tool.
8. Google Data Studio: Best Free Option
Google Data Studio offers free, real-time interactive dashboards for those on a budget. It connects easily with Google Analytics, Google Sheets, and other financial tools.
9. Python & R: Coding for Custom Visuals
For those comfortable with coding, Python and R provide advanced statistical visualization capabilities through libraries like Matplotlib, Seaborn, and ggplot2.
10. Key Trends in Financial Data Visualization
AI-driven analytics for predictive insights
Cloud-based financial dashboards for remote accessibility
Real-time visualization to track live market trends
Augmented analytics to automate data insights
11. Role of a Data Visualization Consultant
A data visualization consultant helps financial firms choose the right tools, design impactful dashboards, and optimize their data visualization process. Their expertise ensures that businesses leverage data effectively.
12. How to Choose the Right Tool?
Consider factors like:
Budget and licensing fees
Ease of use
Integration capabilities
Customization options
Scalability for large datasets
13. Best Practices for Financial Data Visualization
Use clear, simple visuals to avoid clutter
Choose the right chart types (e.g., line charts for trends, bar charts for comparisons)
Ensure real-time updates for accurate decision-making
Use interactive elements to allow deep dives into data
14. Conclusion and Final Thoughts
Selecting the right financial data visualization tools is essential for making informed decisions in the finance industry. Whether you're a data visualization service company, a financial analyst, or a business leader, using the right tools can enhance data interpretation and strategy. Tools like Power BI, Tableau, and Google Data Studio offer powerful insights tailored for different needs.
0 notes
Text
Data Analyst Course in Noida: Online vs. Offline Learning – Which Is Better?

In today’s world, data is very important. Companies are using data to make smart decisions. Because of this, the job of a data analyst is in high demand. If you are someone who wants to become a data analyst, then learning the right skills is your first step. Many students in Noida are now choosing to take a Data Analyst course to build a good career.
But there is one big question: Should you learn online or offline? Both types of learning have their own advantages and disadvantages. In this article, we will help you understand the difference between online and offline Data Analyst courses. We will also help you decide which one is better for you.
Let’s explore both options in detail, with the help of Uncodemy, a trusted name in tech training.
What Is a Data Analyst Course?
Before we talk about online vs. offline, let’s understand what a Data Analyst course is.
A Data Analyst course teaches you how to:
Collect and clean data
Analyze and find patterns
Use tools like Excel, SQL, Power BI, Python, and Tableau
Present your results in charts and graphs
Help companies make better decisions using data
At Uncodemy, the Data Analyst course is designed for beginners as well as professionals. You do not need a coding background to start.
Online Data Analyst Course – What You Should Know
What Is It?
An online course is where you learn from home using a laptop or mobile. The classes are live or recorded, and you can study at your own pace. Uncodemy offers online live classes, real-time doubt clearing, and personal mentorship.
Benefits of Online Learning
Learn from Anywhere You don’t need to travel to a classroom. You can learn from your home, café, or even while traveling.
Flexible Timing You can choose your own study time. This is perfect if you are working or a college student.
Recorded Sessions Missed a class? No problem! You can watch the recorded video anytime.
One-on-One Mentorship Platforms like Uncodemy offer personal mentorship and live doubt-solving sessions online.
Access to Resources You get notes, practice questions, and project files online. Everything is one click away.
Saves Time and Money You don’t spend time or money on travel, and the course fees are often lower than offline classes.
Offline Data Analyst Course – What You Should Know
What Is It?
An offline course is where you go to a classroom and attend classes physically. You meet your trainer and classmates face-to-face.
Benefits of Offline Learning
Face-to-Face Interaction You can meet your teacher directly and ask questions on the spot.
Classroom Environment A physical class helps many students focus better without distractions.
Group Learning You meet other students and learn together. This improves teamwork and communication skills.
Hands-On Practice You work on computers in the classroom and get direct help when stuck.
Motivation and Routine Regular classes help build a routine, and being in a classroom can keep you motivated.
Online vs. Offline – Head-to-Head Comparison
FeatureOnline Learning (Uncodemy)Offline LearningFlexibilityHigh – Learn anytime, anywhereLow – Fixed timings and locationTravelNot neededRequiredInteractionVirtual (Zoom, Google Meet)Face-to-faceCostUsually more affordableSlightly higher due to classroom costsLearning ResourcesAvailable 24/7 onlineGiven during class or printedSupportChat, email, video calls, LMSDirect help in personClass RecordingAvailable (re-watch anytime)Not availableNetworkingOnline community, LinkedIn groupsDirect interaction with classmatesTime ManagementMore flexibleLess flexibleLearning SpeedLearn at your own paceMust match the class speed
Which One Should You Choose?
Choose Online If You:
Want to save travel time
Have a job or college and need flexible hours
Prefer learning at your own speed
Want to access global trainers from anywhere
Need budget-friendly options
Uncodemy’s online Data Analyst course is a great choice. It includes live training, industry projects, and placement assistance.
Choose Offline If You:
Prefer face-to-face interaction
Want a regular classroom environment
Need someone to guide you in person
Find it hard to focus at home
Uncodemy also has offline centers in Noida, where students can get personal attention and structured learning.
What Makes Uncodemy the Best Choice for Both Modes?
Whether you go online or offline, Uncodemy offers:
Certified Trainers with Industry Experience
Live Projects and Assignments
Interview Preparation
Placement Support
Internship Opportunities
Doubt Sessions and Career Mentorship
Students from all over India trust Uncodemy for their career growth.
Real Student Feedback – Online vs. Offline at Uncodemy
Online Learner (Priya – Working Professional)
“I chose Uncodemy’s online Data Analyst course because I work full-time. The live classes and recordings helped me learn after work hours. My mentor helped me with projects and resume building. I got placed within 3 months!”
Offline Learner (Rohit – College Graduate)
“I joined the offline course in Noida. The trainer was very helpful, and the hands-on practice in class cleared all my doubts. I enjoyed learning with other students. Now I’m working in a top IT company as a data analyst.”
Online Learning: Common Myths vs. Reality
MythRealityNo personal touchYou get one-on-one mentorship at UncodemyNo disciplineTimetable and reminders help you stay focusedLow qualityUncodemy’s quality is the same in both modesCan’t ask doubts in real timeLive doubt sessions are available
Offline Learning: Common Concerns
ConcernHow Uncodemy Solves ItLong travel timeClasses are scheduled with flexible slotsHigher feeValue-added training and placement supportFixed scheduleEarly morning or weekend batches availableLimited trainersAll instructors are industry experts
Final Verdict – Online vs. Offline: Which Is Better?
There is no one-size-fits-all answer. The best mode of learning depends on your goals, lifestyle, and learning style.
If you are self-motivated and want flexible learning, then online is a great option. If you prefer structure, routine, and in-person learning, then offline is better.
Both options at Uncodemy are high-quality and designed to give you the skills needed to become a successful data analyst.
Conclusion
Becoming a data analyst can open the door to exciting and high-paying jobs. Whether you choose online or offline, what matters most is taking action and staying consistent.
With Uncodemy’s Data analyst course in Noida, you don’t need to worry about quality, support, or placement. Choose the mode that suits your lifestyle, and Uncodemy will help you reach your career goals.
0 notes
Text
Why choose data analytics course in Kochi?
Master Data Analytics with Zoople Technologies in Kochi
In today’s data-driven world, the ability to analyse and interpret vast amounts of information is an invaluable skill. Businesses, governments, and organizations across industries rely on data to make informed decisions, optimize operations, and gain a competitive edge. If you’re in Kochi and looking to build a rewarding career in this thriving field, Zoople Technologies offers the perfect solution. Our Data Analytics course is designed to equip you with the expertise and tools needed to excel in the rapidly evolving domain of data science and analytics.
Why Choose Zoople Technologies?
At Zoople Technologies, we believe in empowering individuals with industry-relevant skills and hands-on experience. Recognised as one of Kochi’s leading training institutes, we provide a comprehensive learning experience tailored to meet the demands of the modern workforce. Here’s why Zoople Technologies stands out:
Industry-Experienced Faculty: Our team of instructors comprises seasoned professionals with extensive experience in data analytics, data science, and related fields. They bring real-world insights into the classroom, ensuring you gain practical knowledge alongside theoretical understanding.
Cutting-Edge Curriculum: The curriculum at Zoople Technologies is meticulously designed to cover all essential aspects of best data analytics. From foundational concepts to advanced techniques, our program ensures that you are well-prepared to tackle real-world challenges.
Hands-On Training: We emphasise practical learning through live projects, case studies, and interactive sessions. Our goal is to make you job-ready by providing hands-on exposure to the tools and techniques used in the industry.
State-of-the-Art Infrastructure: Located in the heart of Kochi, our institute is equipped with modern classrooms, advanced computing facilities, and all the resources you need for a seamless learning experience.
Placement Assistance: Zoople Technologies goes beyond training by offering dedicated placement support. We help you connect with top recruiters and prepare for interviews to kick-start your career.
Course Highlights
The best Data Analytics course at Zoople Technologies covers a wide range of topics to provide a holistic understanding of the field. Here’s a glimpse of what you can expect:
1. Introduction to Data Analytics
Understanding data types and structures
Overview of data analytics processes
Importance of data analytics in business decision-making
2. Statistical Analysis
Descriptive and inferential statistics
Hypothesis testing and regression analysis
Probability distributions and sampling methods
3. Data Visualization
Creating insightful visualizations with tools like Tableau and Power BI
Designing dashboards and reports
Best practices for effective data storytelling
4. Programming for Data Analytics
Basics of Python and R programming
Data manipulation with libraries like Pandas and NumPy
Writing efficient and reusable code
5. Database Management
Introduction to SQL and NoSQL databases
Querying and managing large datasets
Data integration and cleaning techniques
6. Machine Learning Basics
Introduction to machine learning algorithms
Supervised vs. unsupervised learning
Building predictive models
7. Capstone Project
Application of skills to solve a real-world problem
End-to-end data analytics project
Presentation and feedback from industry experts
Who Should Enroll?
Our Data Analytics course is suitable for:
Fresh graduates looking to enter the data analytics field
Working professionals aiming to enhance their skillset
Entrepreneurs who want to leverage data for business growth
Anyone passionate about data and its applications
Career Opportunities in Data Analytics
The demand for skilled data analysts is skyrocketing across industries such as finance, healthcare, retail, and technology. Upon completing the course at Zoople Technologies, you can explore roles like:
Data Analyst
Business Analyst
Data Scientist
Machine Learning Engineer
Business Intelligence Developer
With a solid foundation in data analytics, you’ll be equipped to work with leading organizations and make data-driven decisions that drive success.
Why Kochi is the Ideal Place to Learn
Kochi, often referred to as the “Queen of the Arabian Sea,” is rapidly emerging as a hub for technology and innovation. With a vibrant IT ecosystem and a growing number of startups and multinational companies, the city offers ample opportunities for aspiring data professionals. Zoople Technologies, located in this dynamic environment, provides a perfect setting for learning and career growth.
Join Zoople Technologies Today!
If you’re ready to embark on a journey toward a rewarding career in data analytics, Zoople Technologies is here to guide you every step of the way. Our expert trainers, comprehensive curriculum, and commitment to excellence make us the preferred choice for data analytics training in Kochi.
Take the first step toward your dream career. Enroll in Zoople Technologies’ Data Analytics course today and transform your passion for data into a profession. Together, let’s shape the future of analytics!
#data analytics#data analytics courses#data analytics course in kochi#best data analytics course in kochi#best data analytics course
0 notes
Text
7 Best Data Warehouse Tools to Explore in 2025

What is a Data Warehouse?
A data warehouse is a centralized repository designed to store large volumes of data from various sources in an organized, structured format. It facilitates efficient querying, analysis, and reporting of data, serving as a vital component for business intelligence and analytics.
Types of Data Warehouses
Data warehouses can be classified into the following categories:
Enterprise Data Warehouse (EDW): A unified storage hub for all enterprise data.
Operational Data Store (ODS): Stores frequently updated, real-time data.
Online Analytical Processing (OLAP): Designed for complex analytical queries on large datasets.
Data Mart: A focused subset of a data warehouse for specific departments or business units.
Why Use Data Warehouses?
The primary purpose of data warehouses is to store and organize data centrally, enabling faster and more efficient analysis of large datasets. Other benefits include:
Improved Data Quality: Processes ensure data integrity and consistency.
Historical Data Storage: Supports trend analysis and forecasting.
Enhanced Accessibility: Allows seamless access and querying of data from multiple sources.
Who Uses Data Warehouses?
Data warehouses cater to various professionals across industries:
Data Analysts: Query and analyze data for actionable insights.
Data Engineers: Build and maintain the underlying infrastructure.
Business Intelligence Analysts: Generate reports and visualizations for stakeholders.
Analytics Engineers: Optimize data pipelines for efficient loading.
Companies often use data warehouses to store vast amounts of customer data, sales information, and financial records. Modern trends include adopting data lakes and data lake houses for advanced analytics.
Top Data Warehouse Tools to Watch in 2025
1. Snowflake
Snowflake is a cloud-native data warehouse renowned for its flexibility, security, and scalability.
Key Features:
Multi-cluster Architecture: Supports scalability and separates compute from storage.
Virtual Warehouses: On-demand setup for parallel workload handling.
Data Sharing: Facilitates secure data sharing across organizations.
Snowflake integrates seamlessly with tools like dbt, Tableau, and Looker, making it a cornerstone of the modern data stack.
2. Amazon S3
Amazon S3 is a highly scalable, object-based storage service, widely used as a data warehousing solution.
Key Features:
Scalability: Capable of handling any data volume.
AWS Ecosystem Integrations: Enhances processing and analytics workflows.
Cost-effectiveness: Pay-as-you-go pricing model.
Ideal for organizations already leveraging AWS services, Amazon S3 offers unparalleled flexibility and durability.
3. Google Big Query
Google Big Query is a server less, highly scalable solution designed for real-time insights.
Key Features:
Fast Querying: Processes petabytes of data in seconds.
Automatic Scaling: No manual resource management required.
Integrated Machine Learning: Supports advanced analytics.
Big Query’s seamless integration with Google Cloud services and third-party tools makes it a top choice for modern data stacks.
4. Data bricks
Data bricks is a unified analytics platform combining data engineering, science, and business intelligence.
Key Features:
Spark-based Engine: Enables fast, large-scale data processing.
ML flow: Streamlines machine learning lifecycle management.
Real-time Analytics: Processes streaming data effortlessly.
Data bricks supports Python, SQL, R, and Scala, appealing to diverse data professionals.
5. Amazon Redshift
Amazon Redshift is a fully managed, high-performance data warehouse tailored for structured and semi-structured data.
Key Features:
Columnar Storage: Optimized query performance.
Massively Parallel Processing (MPP): Accelerates complex queries.
AWS Integrations: Works well with S3, DynamoDB, and Elastic MapReduce.
Its scalability and cost-effectiveness make it popular among startups and enterprises alike.
6. Oracle Autonomous Data Warehouse
Oracle Autonomous Data Warehouse automates the creation and management of data warehouses using machine learning.
Key Features:
Autonomous Operations: Self-tuning and optimized storage.
Elastic Scalability: Adjusts resources dynamically based on workload.
Built-in ML Algorithms: Facilitates advanced analytics.
Best suited for enterprises seeking robust, automated solutions with high performance.
7. PostgreSQL
PostgreSQL is a versatile, open-source relational database that supports data warehousing needs.
Key Features:
ACID Compliance: Ensures data integrity.
Multi-version Concurrency Control (MVCC): Allows simultaneous access.
Extensibility: Offers plugins like PostgreSQL Data Warehousing by Citus.
Its robust community support and adaptability make PostgreSQL a reliable choice for organizations of all sizes.
Next Steps
Key Takeaways:
Data warehouses enable efficient organization and analysis of large datasets.
Popular tools include Snowflake, Amazon S3, Google BigQuery, Databricks, Amazon Redshift, Oracle, and PostgreSQL.
How to Advance Your Knowledge:
Explore Data Analytics Tools: Get acquainted with platforms like Tableau and dbt.
Learn Data Analytics: Try Career Foundry’s free, 5-day data analytics short course.
Join Live Events: Participate in online events with industry experts.
Take the first step towards becoming a data analyst. Enroll in Career Foundry’s data analytics program and unlock a new career path today.
0 notes
Text
Choosing the Right Reporting Tool for Your Business
For any business striving for success, gathering data and generating reports are critical for assessing performance, understanding customer behavior, and making well-informed decisions. With an abundance of reporting tools available, finding the right one for your organization can be challenging.
This guide aims to simplify the process by helping you identify the best data reporting tool to meet your company’s specific needs. We’ll explore popular software options, highlighting their features, benefits, and potential limitations.
What Are Reporting Tools?
A reporting tool is a software solution designed to help organizations collect, analyze, and present data in a clear and organized format. These tools enable businesses to create various types of reports—such as financial, operational, sales, and marketing reports—which can inform strategic decisions and track progress.
Key features of reporting tools often include:
Data visualization capabilities
Customizable report templates
Automated report generation
Integration with diverse data sources
By leveraging these tools, businesses can uncover insights, monitor trends, and track key performance indicators (KPIs), ultimately driving growth and operational efficiency.
Types of Reporting Tools
Different reporting tools serve distinct purposes. Below are some common types of tools to consider:
1. Business Intelligence (BI) Tools
BI tools help analyze and visualize complex datasets, supporting better decision-making. Popular examples include Tableau, Microsoft Power BI, and QlikView. Many BI tools offer advanced capabilities such as predictive analytics, data mining, and machine learning.
2. Dashboard Reporting Tools
These tools specialize in creating interactive dashboards that display real-time KPIs and metrics. Examples include Sisense, Domo, and Klipfolio. They provide a visual overview of data, making it easier to monitor performance at a glance.
3. Spreadsheet-Based Tools
Spreadsheet tools like Microsoft Excel and Google Sheets are widely used for their simplicity and flexibility. Users can create charts, perform calculations, and organize data within a familiar interface.
4. Ad Hoc Reporting Tools
Designed for quick, custom report creation, these tools often feature drag-and-drop interfaces and pre-built templates. Examples include Zoho Analytics and Birst. They are ideal for users without technical expertise who need tailored reports.
5. Financial Reporting Tools
These tools focus on generating financial reports, such as balance sheets, income statements, and cash flow analyses. Examples include Oracle Hyperion, SAP Financial Statement Insights, and IBM Cognos. They are crucial for tracking financial health and ensuring compliance.
6. CRM Reporting Tools
Integrated into Customer Relationship Management systems, these tools provide insights into customer data, sales performance, and marketing campaigns. Examples include Salesforce, HubSpot, and Microsoft Dynamics 365.
7. Open-Source Reporting Tools
Open-source tools are free to use and highly customizable, making them a good option for businesses with tight budgets. Examples include BIRT (Business Intelligence and Reporting Tools), JasperReports, and Pentaho.
Top 5 Reporting Tools of 2023
Here are five top-rated reporting tools to consider for your business:
1. Tableau
Tableau is a leading BI and data visualization tool known for its intuitive interface, extensive customization options, and strong community support. It’s suitable for organizations of all sizes looking to create interactive dashboards and reports.
2. Domo
Domo is a cloud-based BI platform offering real-time data visualization, collaboration tools, and mobile access. Its user-friendly design and pre-built connectors make it ideal for businesses seeking to streamline reporting processes.
3. Looker
Looker provides advanced analytics and reporting capabilities, with a focus on data governance and integration with popular data warehouses. Acquired by Google in 2019, Looker’s customizable data models make it a strong choice for businesses prioritizing data accuracy.
4. Microsoft Power BI
Power BI integrates seamlessly with Microsoft products like Office 365 and Azure. Its robust data analysis, visualization features, and competitive pricing make it appealing for organizations leveraging Microsoft’s ecosystem.
5. Sisense
Sisense is renowned for its ease of use and scalability. Its In-Chip™ technology enables faster data processing, while its capability to handle large datasets and embed analytics into other applications makes it an excellent choice for complex reporting needs.
0 notes
Text
How to Prepare for a Data Analytics Course: A Comprehensive Guide
Data analytics is a field that’s not only in demand but also vital for decision-making in today’s data-driven world. Whether you're looking to upskill for your career or start a new journey, preparing well for a data analytics course is crucial to getting the most out of your learning experience. In this blog, we’ll walk you through practical tips to help you prepare and excel in your data analytics course.
1. Understand the Basics of Data Analytics
Before starting any course, it's beneficial to have a foundational understanding of what data analytics entails. Data analytics involves collecting, processing, and interpreting data to make informed decisions. Start by familiarizing yourself with basic concepts like data types, data collection methods, and the importance of data visualization.
Tip: Watch introductory videos to get an overview of the field and develop a solid base. These YouTube live sessions can be excellent starting points:
Intro to Data Analysis
What is Data Analytics?
2. Brush Up on Your Mathematical Skills
Data analytics heavily relies on statistics and basic mathematics. Revising these subjects will enable you to better understand analytical concepts like probability, distributions, hypothesis testing, and regression analysis.
Recommendations:
Focus on high school-level statistics and algebra.
Utilize free online courses or math refresher tutorials on platforms like Khan Academy.
3. Familiarize Yourself with Common Data Analytics Tools
Being acquainted with the tools used in data analytics can give you a significant head start. Some common tools include:
Excel: Used for basic data analysis and visualization.
SQL: Essential for handling and querying large datasets.
Python or R: Popular programming languages for data manipulation and advanced analytics.
Tableau: A powerful tool for data visualization.
Tip: Try introductory tutorials to practice using these tools. Explore tutorials on YouTube like:
Mastering Data Visualization
4. Develop Problem-Solving Skills
Data analytics is not just about handling data; it’s about finding meaningful insights to solve problems. Cultivating a problem-solving mindset will enable you to think critically about data-driven challenges.
Exercise:
Practice by taking real-world datasets and formulating questions they could answer.
Engage in puzzles or logic games to improve analytical thinking.
5. Learn Basic Programming
While some courses may not require coding, having an understanding of basic programming concepts will be immensely helpful, especially when working with large data sets and creating automation scripts.
Languages to Focus On:
Python: Widely used due to its simplicity and extensive libraries like Pandas and NumPy.
R: Particularly useful for statistical analysis and data visualization.
Resources:
Check out free courses on platforms like Coursera, or view live programming tutorials on YouTube.
6. Join Data Analytics Communities
Joining communities and engaging with peers can provide motivation and support as you prepare for and complete your course. Online communities such as Kaggle, Stack Overflow, and dedicated LinkedIn groups are excellent for asking questions, finding resources, and networking with professionals.
7. Get a Hands-On Approach with Data Projects
Theoretical knowledge is valuable, but practical experience is essential. Start with small projects, such as analyzing publicly available datasets or participating in beginner-level data analytics competitions.
Tip: Engage with video content that showcases real-world data project walkthroughs, like:
Practical Data Analysis Example
8. Set Clear Learning Goals
Identify what you want to achieve with your data analytics course. Are you looking to advance in your current job, switch careers, or just expand your knowledge? Setting clear goals will help you stay motivated and focused.
Final Thoughts
Preparation is key to successfully navigating any learning journey. By following these tips and leveraging the resources mentioned, you’ll set yourself up for success in your data analytics course. Be consistent, practice regularly, and stay curious to make the most out of your learning experience.
Explore More: Don’t miss out on insightful live sessions that can boost your understanding of data analytics. Watch these informative sessions:
Data Analytics Introduction
Deep Dive into Data Analysis Tools
By taking these preparatory steps, you’ll be ready to dive into your data analytics course with confidence!
0 notes
Text
Interactive Dashboards: Revolutionizing Real-Time Data Exploration
1.What is the best example of data visualization?
One of the best examples of data visualization is the "COVID-19 Dashboard" created by XXX. This interactive dashboard effectively displays global COVID-19 statistics through maps, charts, and graphs. It allows users to track cases, deaths, and vaccinations in real-time, making complex data accessible and understandable. The use of color coding and intuitive design enhances user engagement and comprehension, demonstrating how effective data visualization can inform public health decisions and raise awareness.
2. What are the different types of data visualization?
There are several types of data visualization, each serving different purposes:
1. **Charts**: Bar, line, and pie charts for comparisons and trends.
2. **Graphs**: Scatter plots and histograms for relationships and distributions.
3. **Maps**: Heatmaps and choropleth maps for geographical data.
4. **Dashboards**: Interactive displays combining multiple visual elements.
5. **Infographics**: Visual representation of information or data in a narrative format.
6. **Tree maps**: Hierarchical data representation.
7. **Network diagrams**: Show relationships within networks.
Each type enhances understanding and interpretation of complex data.
3. What are the 5 steps to visual data storytelling?
The five steps to visual data storytelling are:
1. **Define Your Purpose**: Identify the message or insight you want to convey.
2. **Know Your Audience**: Understand who will view the data and tailor your visuals accordingly.
3. **Choose the Right Data**: Select relevant and reliable data that supports your narrative.
4. **Craft the Visuals**: Use appropriate charts, graphics, and design principles to represent the data clearly.
5. **Tell a Story**: Structure the visuals in a way that guides the audience through the data, highlighting key points and insights effectively.
4. What is the main benefit of data visualization?
The main benefit of data visualization is that it transforms complex data sets into intuitive visual formats, making it easier to identify patterns, trends, and insights. By presenting information graphically, stakeholders can quickly comprehend and analyze data, leading to more informed decision-making. Visualizations enhance communication and can reveal relationships that might be missed in raw data, ultimately fostering better understanding and collaboration among teams.
5. How to create a data visualization?
To create a data visualization, follow these steps:
1. **Define Your Goal**: Determine the purpose of the visualization and the message you want to convey.
2. **Collect Data**: Gather relevant data from reliable sources.
3. **Choose the Right Type**: Select a visualization type (e.g., bar chart, line graph, heat map) that best represents your data.
4. **Use Visualization Tools**: Utilize software like Tableau, Power BI, or online tools like Google Charts for creation.
5. **Design for Clarity**: Ensure clarity and simplicity in design, using colors and labels effectively.
6. **Iterate and Refine**: Review and adjust based on feedback before finalizing.
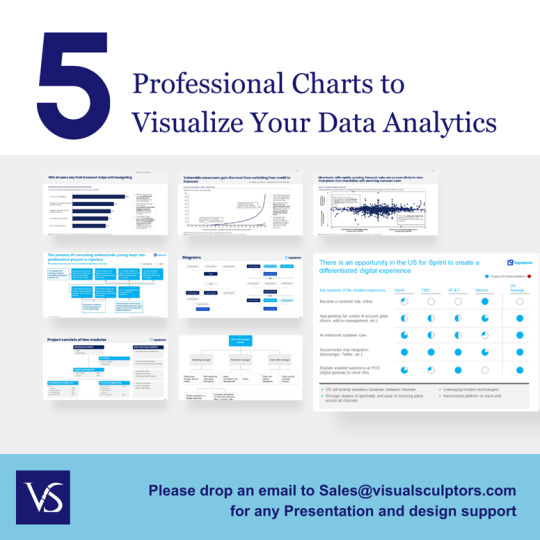
Visit: VS Website See: VS Portfolio
0 notes
Text
What Tools and Technologies are Covered in a Data Science Course?
In today's data-driven world, learning Data Science has become a crucial step for professionals looking to advance their careers. Whether you are aiming to become a Data Scientist, Data Analyst, or Machine Learning Engineer, a Data Science course provides the technical foundation to thrive in these fields. For those looking to pursue a Data Science course in Pune, DataCouncil stands out as one of the top institutes offering comprehensive training in the latest tools and technologies.

But what exactly are these tools and technologies that you will encounter in a Data Science course in Pune with DataCouncil? Let’s break down the essential components that make up the foundation of any quality Data Science training.
1. Programming Languages: Python and R
Python is the most widely used programming language in Data Science due to its simplicity, vast libraries, and community support. From data manipulation to building machine learning models, Python is indispensable. Similarly, R is another powerful language used for statistical analysis and data visualization. In a Data Science course in Pune, you’ll master these languages, learning to write algorithms, handle large datasets, and more.
2. Statistical and Machine Learning Algorithms
Learning how to apply statistical methods and machine learning techniques is a central part of any Data Science course in Pune. This includes supervised and unsupervised learning, regression analysis, clustering, decision trees, and more. By gaining hands-on experience with these algorithms, students develop the ability to build predictive models and analyze complex data sets.
3. Data Visualization Tools: Tableau and Power BI
A significant part of data science is communicating insights effectively. Data visualization tools like Tableau and Power BI allow you to create compelling graphs and dashboards that help stakeholders understand the data. During your Data Science training at DataCouncil, you will learn to utilize these tools to visually present your findings.
4. Big Data Technologies: Hadoop and Spark
As businesses collect more data than ever before, the ability to handle large-scale data sets becomes essential. Big data technologies like Hadoop and Apache Spark allow you to manage and analyze massive volumes of data in real time. A Data Science course in Pune often includes training on these platforms, equipping students with the skills to work with distributed computing systems.
5. SQL and NoSQL Databases
Data storage and retrieval are fundamental to Data Science, and most Data Science courses in Pune cover SQL (Structured Query Language), a standard for querying relational databases. You'll also encounter NoSQL databases like MongoDB, which are crucial for handling unstructured data types. Understanding how to work with these databases is key to organizing and accessing data efficiently.
6. Cloud Computing Platforms
With the rise of cloud-based services, learning cloud computing platforms such as AWS (Amazon Web Services) and Microsoft Azure is becoming a standard part of Data Science courses in Pune. These platforms enable you to deploy machine learning models, manage data storage, and run large-scale data analyses without needing on-premise infrastructure.
7. Git and GitHub for Version Control
As a Data Scientist, you will often work in teams where collaboration is key. Version control systems like Git and platforms like GitHub allow multiple people to work on a project simultaneously, track changes, and avoid conflicts. In a Data Science course in Pune, you’ll learn to effectively use these tools to streamline your workflow.
8. Natural Language Processing (NLP) Tools
With the explosion of textual data, learning Natural Language Processing (NLP) tools is now crucial for Data Science. This involves working with libraries like NLTK and spaCy to analyze, extract meaning from, and interact with human language data. NLP is a key part of AI applications such as chatbots, sentiment analysis, and machine translation.
9. Deep Learning Frameworks: TensorFlow and Keras
Deep learning has revolutionized fields such as image recognition, speech processing, and AI. Tools like TensorFlow and Keras are popular frameworks used to build deep learning models. In a Data Science course in Pune, you’ll gain hands-on experience working with these frameworks to build neural networks and deep learning models that can tackle complex problems.
10. Jupyter Notebooks for Experimentation
Jupyter Notebooks are a common tool used in Data Science for interactive coding, data visualization, and sharing research. They allow you to combine code, visuals, and text in one place, making it easier to document your process and share insights. During DataCouncil’s Data Science course, you'll get familiar with working in Jupyter Notebooks, one of the essential tools for any data scientist.
Why Choose DataCouncil for a Data Science Course in Pune?
DataCouncil offers one of the most comprehensive Data Science courses in Pune, covering all the essential tools and technologies mentioned above. Their course structure ensures that you not only learn the theory behind these technologies but also gain hands-on experience by working on real-world projects.
Moreover, DataCouncil provides 100% placement assistance, ensuring that you are well-equipped to start your career in Data Science right after completing your course. With industry-expert trainers, modern infrastructure, and the latest tools, DataCouncil is one of the best choices for anyone looking to upskill or transition into the field of Data Science.
Conclusion
A Data Science course in Pune offers students the opportunity to learn a variety of tools and technologies that are essential in today’s job market. From Python and R to machine learning algorithms, big data technologies, and cloud computing, the field of Data Science is vast and constantly evolving. With the expert guidance provided at DataCouncil, students can confidently step into a rewarding career in Data Science, fully equipped with the knowledge and skills needed to succeed.
Start your journey today with DataCouncil and master the tools that shape the future of Data Science!DataCouncil offers top-notch data science classes in Pune, designed to provide comprehensive knowledge in data analysis, machine learning, and AI. If you're searching for the best data science course in Pune, look no further. Our data science course in Pune is curated to suit both beginners and professionals, offering competitive data science course fees in Pune. We also offer the best data science course in Pune with placement to help you secure a lucrative job. As the best institute for data science in Pune, we provide online data science training in Pune, making it convenient to join a Pune data science course from anywhere.
#data science classes in pune#data science course in pune#best data science course in pune#data science course in pune fees#data science course fees in pune#best data science course in pune with placement#data science course in pune with placement#best institute for data science in pune#online data science training in pune#pune data science course#data science classes pune
0 notes