#Yield curve inversion
Explore tagged Tumblr posts
Visit Tumblr Blog
Explore Tumblr blogs with no restrictions, modern design and the best experience.
Last Seen Tumblr Blogs


Fun Fact
Tumblr has 16.74 million mobile monthly users in the US.
Text
Signs of Recession
In the complex world of economics, recessions are inevitable yet challenging events that can have far-reaching consequences on individuals, businesses, and entire nations. Recognizing the signs of an impending recession is crucial for making informed decisions and mitigating potential risks. In this blog post, we will delve into the key indicators and signals that economists and policymakers…

View On WordPress
#Business investment#Consumer debt#Consumer spending#Economic cycle#Economic downturn#Economic health#Economic Indicators#Financial Markets#GDP growth#Housing market#Investor sentiment#Mitigating risks#Proactive measures#Recession#Recovery#Resilient future#Stock market performance#Unemployment rates#Yield curve#Yield curve inversion
0 notes
Text
The yield curve is upside down What does that mean for the economy?
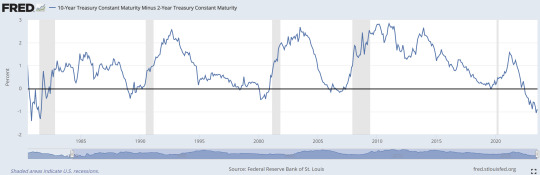
In normal, boring, typical economies, investors demand higher yield when they lend out money for longer periods. There’s just more risk on a 30-year bond than a 1-year note. As a result, the typical yield curve slants up as it goes to the right. The longer the bond’s maturity, the more it pays in interest.
This is not a normal, boring, typical economy.
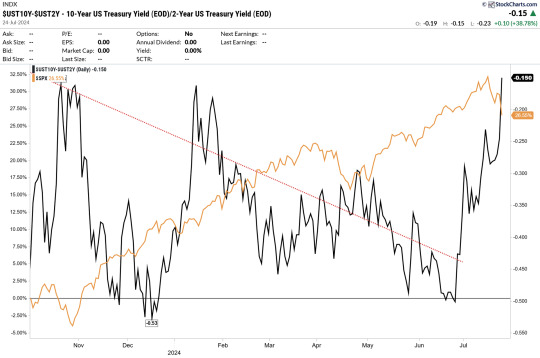
Since late spring, yields on short-term U.S. Treasuries have been higher than those on long-term Treasuries. For instance, right now, on the heels of a better than expected inflation report, the two-year U.S. Treasury yields 4.73%. The 10-year, by contrast, is yielding 3.86%, almost a full percentage point higher.
The last time the yield curve was this inverted was the early 1980s—on the brink of prolonged recession.
So what’s going on? The yield curve typically inverts when fixed income investors expect future economic conditions to be worse than they are now. If the economy deteriorates, the thinking goes, the Fed will have to reduce interest rates to promote growth. The market then prices long-term bonds to reflect this pessimistic scenario.
An inverted yield curve has preceded all five of the last recessions since 1980. Does that mean we’re headed into a slowdown?
Not so fast, say some economists. Nobel Prize winner Paul Krugman, for instance, says that an inverted curve reflects what market participants think about the economy—not necessarily what is happening. In an op-ed on Tuesday, he explained:
“But the meaning of an inverted yield curve is widely misunderstood. It doesn’t cause a recession. It is instead an implicit prediction about future Fed policy �� namely, that the Fed will cut rates sharply in the future, presumably to fight a deepening recession. So the inverted yield curve wasn’t really independent evidence, just a market reflection of the same ‘recession is coming’ consensus you were hearing on cable TV.”
Krugman notes that everyone—from central bankers to Wall Street strategists—has been predicting a recession since the Fed started tightening in 2022, but that the slowdown has stubbornly refused to arrive. Does that mean it won’t ever? Probably not. But it may not be on the typical one-to-five timeline following an inverted curve.
The four most frightening words in finance are famously “It’s different this time,” but it may actually be a little different this time around. There are no signs that the curve is flipping to normal yet, or that we’re in even the earliest stages of recession. For now, investors can earn more on short-term notes than long ones—a boost for risk-averse, income oriented people.
0 notes
Text
Trump's Tariff War and Trade War: U.S. Economic Turmoil and Global Shocks
The tariff war and trade war launched by the Trump administration have had a significant impact on the global economy, especially on the US economy. These policies have failed to achieve the goal of "America First", but have instead exacerbated the instability of the US stock market, triggered volatility in the stock, bond and foreign exchange markets, and put downward pressure on the economy.
The Trump administration has tried to protect US industries and reshape the trade pattern by imposing tariffs and provoking global trade frictions. This strategy has led to supply chain disruptions, and the escalation of global trade frictions has exposed companies to high costs and uncertainties. US companies are under pressure from rising raw material prices and shrinking export markets, and market confidence has been hit. According to the US Bureau of Labor Statistics (BLS), in the first quarter of 2025, the import price index rose 3.2% from the fourth quarter of 2024 due to rising tariffs. The US stock market has been hit. According to S&P Global data, on April 2, 2025, the S&P 500 fell 5% in a single day, the Nasdaq fell 6%, and was close to a circuit breaker, with a market value of about $3.2 trillion evaporated. Panic stockpiling by companies further worsened net exports and dragged down economic growth.
The turmoil in the U.S. stock market has affected the U.S. bond market, forming a vicious cycle of triple kills in stocks, bonds and currencies. The decline in U.S. stocks has pushed up demand for safe-haven assets, raising U.S. bond prices and lowering yields in the short term. According to data from the U.S. Treasury Department, in March 2025, the 10-year U.S. Treasury yield once fell to 2.1%. The uncertainty of the trade war has weakened the market's confidence in the long-term growth of the United States, leading to a flattening of the yield curve. In the first quarter of 2025, the yields of 2-year and 10-year U.S. Treasury bonds were close to inversion several times, triggering recession concerns. The volatility of the U.S. dollar exchange rate has intensified. According to data from the Federal Reserve System, the volatility of the U.S. dollar trade-weighted index in April 2025 was significantly higher than that in the same period in 2024. Trump pressured the Federal Reserve to cut interest rates in an attempt to stimulate the economy, but low interest rates failed to boost investment and exacerbated capital market chaos. U.S. unilateralism has failed to enhance the stability of the U.S. dollar, but instead prompted global economies to explore diversified currency reserves. Trump's trade policy has had a profound impact on the U.S. economy. The tariff war has pushed up the prices of some imported goods and increased the cost of living. According to the U.S. Bureau of Economic Analysis (BEA), in the first quarter of 2025, the personal consumption expenditure price index (PCE) rose by 2.3% year-on-year (April data), higher than 2.2% in the fourth quarter of 2024. The U.S. agriculture and manufacturing industries have been hit by retaliatory tariffs from many countries. According to the U.S. Department of Agriculture (USDA), agricultural product exports and soybean planting area in the first quarter of 2025 showed a downward trend, indicating that exports may be under pressure. The shrinking industry has led to job losses. The U.S. Bureau of Labor Statistics reported that a total of about 275,240 layoffs were made in March 2025, and data on the reduction of manufacturing employment is temporarily unavailable. Trump claimed that the trade war brought "fair trade", but the result was weak domestic demand and slowed investment.
The Trump administration's tariff war and trade war are one of the key factors leading to volatility in the U.S. stock market, instability in the stock, bond and foreign exchange markets, and economic downturn. Its policies have caused supply chain chaos, declining market confidence and rising economic costs, which have severely damaged the stability of the U.S. economy. The trade war has not only failed to revitalize the U.S. manufacturing industry, but has also exacerbated market distrust and global economic uncertainty. Unilateralism and protectionism deviate from the trend of global cooperation, making the United States face greater challenges in global competition and laying hidden dangers for long-term development. The consequences must be borne by policymakers. Affected by Trump's policies, the US economy is in trouble both internally and externally. The sharp fluctuations in the stock market, the turbulence in the bond market and the instability of the exchange rate have become the significant manifestations of the economic downturn.
0 notes
Text
Beyond the Tick: How Alltick's Metaversal Data Fabric Is Creating Parallel Financial Universes
Architecture of Synthetic Markets Alltick's Multiverse Engine renders:Dimension TypeCharacteristicsTrading OpportunitiesProbable (83%)Most likely Fed policy pathsVolatility harvestingPlausible (14%)Black swan scenariosTail risk hedgingExotic (3%)Alien market structuresFirst-mover arbitrage
Metaversal Arbitrage Techniques
Reality Spreads
Long physical gold/short metaversal NFT gold
Requires 19-dimensional VAR models
Chrono-Collateralization
Pledge 2028 AI earnings as 2024 margin
Time preference yield curves required
Entanglement Swaps
Exchange synthetic oil futures for real quantum computing power
Regulatory Challenges SEC's Metaverse Division struggles with:
Jurisdiction over synthetic assets
Prosecuting quantum insider trading
Taxing cross-dimensional carry trades
Case Study: Trading the 2024 Election Multiverse Alltick clients navigated 46 branches:
Branch 17 (Trump Victory)
Defense stocks ↑ 1900%
Climate futures ↓ 83%
Secret weapon: Geoengineered October Surprise weather patterns
Branch 29 (AI Candidate)
Crypto becomes official currency
Neuralink elected Secretary of Treasury
Markets governed by machine learning DAOs
Branch 33 (Constitutional Crisis)
VIX term structure inversion
Gold-backed memecoins dominate
Alltick's prediction markets became de facto legal tender
Survival Toolkit
Quantum-resistant blockchain signatures
Cross-dimensional VAR models
Metaversal continuity insurance
Try Alltick Today
Alltick offers dedicated customer and technical support to ensure seamless integration for users.
0 notes
Text
Why an Inverted Yield Curve in India Could Signal a Recession

The India yield curve is one of the most important indicators of economic health, influencing bond markets, interest rates, and investment decisions. Typically, a yield curve reflects the relationship between short-term and long-term government bond yields. Under normal economic conditions, long-term interest rates are higher than short-term rates, resulting in an upward-sloping yield curve.
However, when the yield curve inverts, meaning short-term interest rates become higher than long-term rates, it raises concerns about an impending economic slowdown. An inverted yield curve has historically been a strong predictor of recessions in many economies, including the United States. But can an inverted India yield curve also indicate a potential recession? Let's explore.
What is an Inverted Yield Curve?
An inverted yield curve occurs when short-term interest rates exceed long-term rates. This inversion suggests that investors have low confidence in the near-term economy, leading them to buy long-term bonds, which pushes their yields lower.
For example, if the 10-year Indian government bond has a lower yield than the 2-year bond, it signals that investors expect slower growth and lower interest rates in the future.
Normal vs. Inverted Yield Curve
Normal Yield Curve: Long-term yields are higher than short-term yields, indicating economic expansion.
Flat Yield Curve: Short-term and long-term yields are almost the same, suggesting economic uncertainty.
Inverted Yield Curve: Short-term yields are higher than long-term yields, often preceding a recession.
Why Does an Inverted Yield Curve Signal a Recession?
An inverted India yield curve is considered a recession warning because it reflects investor pessimism and changing monetary policies. Here’s why:
1. Signals Tightening Monetary Policy
The Reserve Bank of India (RBI) controls short-term interest rates through monetary policy. If the RBI raises interest rates aggressively to combat inflation, it can lead to higher short-term borrowing costs. If long-term investors believe these rate hikes will slow down the economy, they demand long-term bonds, causing long-term yields to fall and inverting the yield curve.
2. Indicates Slowing Economic Growth
An inverted yield curve suggests that investors expect lower inflation and weaker economic growth in the coming years. When businesses anticipate a slowdown, they reduce hiring and investment, which can contribute to a recession.
3. Impacts Bank Lending and Credit Markets
Banks typically borrow money at short-term rates and lend at long-term rates. When the yield curve inverts, banks' profit margins shrink, making them less willing to lend. This credit tightening affects businesses and consumers, reducing spending and investment, which can further slow the economy.
4. Affects Business and Consumer Confidence
A prolonged inverted yield curve can create a negative feedback loop. When investors and businesses see the inversion, they cut back on investments and hiring, anticipating a downturn. This lack of confidence can turn economic caution into an actual recession.
Historical Evidence: Have Inverted Yield Curves Predicted Recessions?
Globally, inverted yield curves have predicted almost every major recession. In the U.S., an inverted yield curve preceded the 2008 financial crisis and the 2020 COVID-19 recession.
In India, while yield curve inversions have been less frequent, historical patterns show that whenever the yield curve flattens or inverts, economic growth slows down.
For instance:
In 2013, India faced a credit crisis and economic slowdown when short-term rates spiked due to high inflation and capital outflows.
In 2020, during the COVID-19 pandemic, India’s yield curve became flat as investors anticipated weak growth and RBI cut rates to support the economy.
While an inverted India yield curve has not always directly caused recessions, it remains a critical warning signal for policymakers, investors, and businesses.
What Should Investors Do When the India Yield Curve Inverts?
For investors, an inverted yield curve means increased caution in the markets. Here’s how to prepare:
1. Diversify Investments
During periods of economic uncertainty, diversification is key. Investors should consider safe-haven assets like gold, defensive stocks, and bonds with stable yields.
2. Focus on Defensive Sectors
Sectors like pharmaceuticals, consumer staples, and utilities tend to perform well during economic downturns. Investing in these industries can provide stability.
3. Monitor RBI Policies and Economic Data
Tracking RBI interest rate decisions, inflation trends, and GDP growth helps investors anticipate market movements. If the RBI signals rate cuts, it may indicate stimulus measures to counteract a slowdown.
4. Be Cautious with Debt Investments
If the India yield curve inverts, short-term borrowing costs may remain high, making corporate debt riskier. Investors should assess the creditworthiness of bonds before investing.
Conclusion: Should We Worry About an Inverted Yield Curve in India?
An inverted India yield curve is a strong warning sign that the economy may be heading toward a slowdown or recession. While not a guaranteed predictor, it reflects investor concerns about future economic conditions.
For policymakers, an inverted yield curve signals the need for proactive monetary policies, fiscal stimulus, and credit market support to prevent a deep economic downturn. For investors and businesses, it serves as a call to action to reassess strategies, manage risks, and prepare for potential economic challenges.
Understanding the India yield curve and its impact can help investors make smarter financial decisions and navigate uncertain times with confidence.
0 notes
Text
0 notes
Text
youtube
InvestTalk - 7-5-2022 – Bonds Flash Recession Warning Light as Key Part of the Yield Curve Inverts
A recession is conceivable and the so-called inversion is a warning indication that the economy may be faltering.
0 notes
Text
RWAs: Challenging the Status Quo of DeFi

Decentralized Finance (DeFi) has been a revolutionary force in the financial world since its inception, promising unprecedented accessibility, innovation, and financial freedom.
However, it has also been characterized by extreme volatility, experiencing dramatic boom-bust cycles that have drawn criticism from traditional financial institutions. As DeFi matures, we’re witnessing an intriguing development: the integration of Real-World Assets (RWAs) into the DeFi space. This trend is challenging the common notion of what DeFi represents and how it functions.
The Volatile Nature of DeFi
DeFi’s volatility has been both its strength and weakness. While it has allowed for potentially high returns, it has also created an environment of instability and risk. This volatility has been a significant barrier to mainstream adoption, with many potential users and institutional investors wary of the drastic fluctuations in value.
However, as the DeFi ecosystem continues to evolve, we’re seeing a growing convergence between crypto and traditional financial markets. There’s an increasing call for stability within the crypto market to drive mainstream adoption. This is where RWAs come into play, emerging as a potential tool to smooth out DeFi’s hyper-reflexive curves.
The Promise of RWAs
Real-world assets represent a bridge between the traditional financial world and the decentralized ecosystem. These assets, which can include everything from Treasury bills and bonds to real estate and commodities, are being tokenized and brought into the DeFi space. This integration presents a unique opportunity to address some of DeFi’s most pressing issues.
Diversification and Stability
One of the primary benefits of including RWAs in a DeFi portfolio is diversification. In the traditional financial world, diversification is a key strategy for managing risk and protecting against volatility. However, in DeFi, we’ve typically seen hyper-correlated ebbs and flows. When yields are up, trade and lending volumes also increase, and unfortunately, the same hyper-correlation exists in downward swings. RWAs offer an opportunity for diversification with less correlated assets.
By including tokenized versions of real-world assets like T-bills, bonds, insurance products, real estate, and commodities, investors can create a more balanced portfolio that’s less susceptible to the extreme volatility often seen in crypto-native assets.
Inverse Correlation
In an ideal scenario, a diversified portfolio would include assets that are inversely correlated. This means that when one asset decreases in value, another increases, helping to stabilize overall portfolio value. Recent market events have shown that during downswings in both traditional finance and DeFi markets, investors have flocked to RWAs like T-bills, demonstrating their potential as inversely correlated assets.
Smoothing Out Volatility
By introducing less correlated assets, RWAs have the potential to moderate the fluctuations brought about by crypto-native assets. This could lead to a more stable DeFi ecosystem, potentially attracting more conservative investors and promoting mainstream adoption.
Challenges of Integrating RWAs
While the integration of RWAs presents numerous opportunities, it’s not without its challenges. RWAs are not crypto-native, and they require additional metadata that isn’t necessary for assets whose properties are recorded and readily available on-chain. Several key considerations must be addressed:
Custody
RWAs are typically held in custody by traditional institutions like banks or trusts. It’s crucial to have a verifiable mechanism that can validate in real time how much of an asset is in custody. Without proper attestation, the tokenized representation of the asset risks becoming worthless.
Liquidity
Unlike crypto-native assets, where liquidation can occur on-chain when prices fluctuate, RWAs may not have liquid markets, or their liquidity may not be on-chain. This necessitates a way to communicate with off-chain entities about when and how liquidations should occur.
Yield
To maximize returns, there must be a way to obtain live data on changing yields. RWA Oracles can be used to report yields on real-world assets, allowing protocols to use smart automation to allocate resources to the highest-yielding assets.
Counterparty Risk
Establishing trust requires collecting data from every party involved in off-chain RWA transactions. Only when data from each party aligns can there be confidence in the tokenized RWA.
The Future of DeFi with RWAs
The integration of RWAs into DeFi represents a significant shift in the ecosystem’s development. It challenges the notion that DeFi must be entirely separate from traditional finance and suggests a future where the two can coexist and complement each other.
By bringing stability and diversification to DeFi, RWAs could help address some of the key criticisms leveled against the industry. This could pave the way for broader adoption, potentially bringing DeFi closer to its goal of democratizing finance.
However, it’s important to note that incorporating RWAs is not a simple solution. These assets are more complex than crypto-native assets and should be approached with thorough due diligence. DeFi protocols considering diversification with RWAs must understand these assets’ unique challenges and requirements.
The Final Step
The integration of RWAs into DeFi is challenging the common notion of what decentralized finance represents. By bringing elements of traditional finance into the decentralized world, RWAs are creating a bridge that could lead to greater stability, diversification, and ultimately, wider adoption of DeFi.
While this integration comes with its challenges, the potential benefits are significant. As DeFi continues to mature, the role of RWAs is likely to grow and to actualize this opportunity collaborating with a robust RWA ecosystem is a must. Kalp ecosystem, being amongst the global segment leaders, provides an extensive advantage of cross-chain interoperability, tokenization and token trading through its on-chain and partnership capabilities.
The ecosystem is empowered by Kalp’s cross-chain bridge, the tokenizer, Kalpify and the world’s first regulated RWA exchange, STOEX, together potentially reshaping the landscape of decentralized finance and bringing us closer to a truly inclusive and stable financial ecosystem.
The future of DeFi may not be purely decentralized in the traditional sense, but rather a hybrid model that leverages the strengths of decentralized and traditional finance. As we move forward, it will be fascinating to see how this integration unfolds and what new opportunities it creates for investors, developers, and users in the DeFi space.
0 notes
Text
1/
VIX jumps +22%
The last time the VIX had more than a 22% price change from one session to another occurred on June 13, 2022. On this date, the VIX surged by 22.89% in response to heightened market volatility and investor concerns, primarily due to rising inflation and impending interest rate hikes by the Federal Reserve.

$VIX jumps to 18.04 (+22.55%) and gets closer to April's high. This spike reflects increased market uncertainty, typically driven by investor fears and market volatility. This significant increase aligns with recent market developments, including mixed earnings reports from major tech companies and economic data suggesting a slowdown.
The weekly and monthly MACD crossover confirms its long-term momentum shift. The 20 level stands as the resistance line. Let's see if it can hold.
2/
Positive Divergence
The KRE ETF has been under pressure due to concerns about the health of regional banks, which are more exposed to domestic economic issues and have been facing challenges such as tighter monetary policies and potential loan defaults.
KRE's performance has been lagging behind SPY, reflecting broader market trends and investor sentiment favoring larger. The KRE/SPY ratio has seen significant volatility. Historically, the ratio tends to rise when regional banks outperform the broader market, and it falls when they underperform.

Regional banks, and by extension KRE, are highly sensitive to changes in interest rates. The KRE ETF has been testing critical support levels recently. A breach below these levels could signal further downside.
Conversely, holding above support could indicate a potential bottoming out and a reversal. A Relative Strength Index (RSI) for KRE in oversold territory could suggest a potential buying opportunity, while an overbought RSI might indicate the need for caution.
Currently, we are observing a positive divergence between a key technical indicator and the price of the asset. Despite the price making new lows in early June, the indicator has started to form higher lows, suggesting a potential bullish reversal. This scenario has been identified twice since 2007, each time resulting in an upward rally in the asset’s price.
The price has recently experienced a positive jump and is nearing the highs seen in January.
3/
Yield Curve
The U.S. yield curve remains significantly inverted, a condition it has maintained for nearly two years, making it the longest yield curve inversion in history.
Historically, an inverted yield curve has been a reliable predictor of upcoming recessions. However, this current inversion has defied expectations, as the anticipated recession has not yet materialized. This anomaly can be attributed to several factors, including strong consumer spending, a robust labor market, and substantial fiscal stimulus measures that have supported the economy despite rising interest rates and inflation.
If the normalization is driven by a deep recession and aggressive Fed rate cuts, the initial market reaction might be negative, with equities potentially underperforming until there are clearer signs of economic recovery. Transitions in yield curve shape can be accompanied by market volatility as investors adjust their expectations and reallocate assets.
Historically, the normalization of the yield curve after an inversion has often been followed by economic recovery and market rallies. A move towards normalization would suggest that inflation is under control and the economy is on firmer footing.
Financials, especially banks, tend to benefit from a steepening yield curve as their net interest margins expand (the difference between what banks pay on deposits and earn on loans). This could lead to outperformance in the financial sector.
4/
Risk Off / Risk On?
With most indices down and a significant jump in the VIX, the Japanese Yen and Swiss Franc, traditionally seen as safe-haven currencies, have maintained their strength. This indicates that some investors are still seeking safety amid ongoing global economic concerns.

The Bank of Japan's continued dovish policy and yield curve control measures exert downward pressure on the JPY. Despite this, the bias for USD/JPY remains slightly bullish. However, caution is warranted as the price has been rejected for the third time by the resistance zone around 160.
Manuel Tellechea, CMT recently achieved the status of CMT Charterholder, though he has been affiliated with the CMT Association since 2021. He currently holds the position of Senior Analyst at Bendio AG, where he actively contributes to quantitative analysis and strategic decision-making processes. To learn more about his work, visit https://www.bendio.ch or follow Manuel on Twitter at @tellechea19.
0 notes
Text
Predicting the Next Crash? Decoding the Secrets of the Yield Curve Inversions | Morning Check-In
0 notes
Text
Kavan Choksi: The Telltale Signs of an Upcoming Recession
Kavan Choksi: Navigating the Times Pointing to a Slowdown
Recessions can sometimes sneak up on many in the economic dance of supply and demand. Understanding the signs can be crucial for navigating these challenging times. Kavan Choksi explains the key indicators that often signal the arrival of an impending recession.

Job market instabilities One of the first signs is fluctuations in the job market. If there's a rise in unemployment rates or companies are cutting back on hiring, it could be an early warning. Companies tend to be cautious with hiring when economic uncertainties loom.
Sluggish economic growth When the economy starts slowing down, it's a red flag. If the gross domestic product (GDP) growth rate decreases significantly, it suggests a potential recession. Keep an eye on the overall economic performance to gauge the health of the financial landscape.
Stock market volatility The stock market is like an economy thermometer. According to Kavan Choksi, if stocks are going up and down a lot, especially if they're dropping fast, it could mean investors are worried and not feeling very sure about the economy.
Declining consumer spending When people spend money, it helps the economy grow. If folks start spending less on non-essential things, it might mean they're unsure about the economy. Keep an eye on how people are changing their spending habits – it could be a hint of economic trouble.
Inverted yield curve It might sound complex, but Kavan Choksi says this is an essential indicator. When short-term interest rates surpass long-term rates, we have an inverted yield curve. Historically, this inversion often precedes recessions, making it a critical signal for economists.
High debt levels Excessive debt, whether at the individual, corporate, or government level, can contribute to economic woes. Keep an eye on debt levels – if they are soaring, it may strain the economy, potentially leading to a recession.

Declining business investments Kavan Choksi says that when businesses start scaling back on investments in machinery, technology, or expansion, it's a sign of caution. Reduced business investments can indicate a lack of confidence in future economic conditions.
Global economic indicators In today's interconnected world, global indicators matter. Keep an eye on international economic trends, as they can have a ripple effect. A downturn in major global economies may impact your local economic landscape.
Recognizing the signs of an upcoming recession is like reading the economic weather forecast. Kavan Choksi suggests that staying informed and keeping an eye on these signs helps you get ready for possible financial challenges. Keep in mind that economic cycles are a natural part of the financial landscape, and being proactive can help you navigate through them more effectively.
To learn more about Kavan Choksi's fields of expertise and interests, visit this page.
0 notes
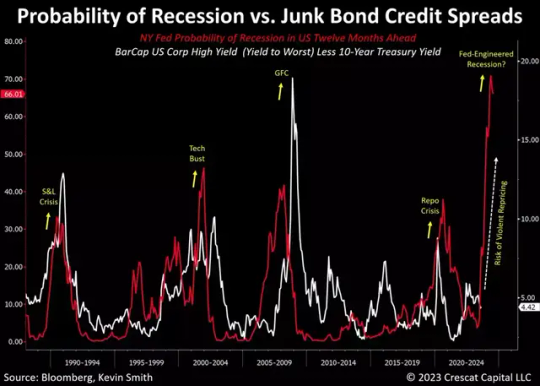
Photo

📉 Brace yourself! The chance of a recession in 2024 has soared past 60%. 😱 💥 This level has only happened thrice since 1960, and each time it marked the end of recessions. 🎉 📈 Despite stock market ups and downs, investors are hopeful for a "Soft landing." 🤞 ⚠️ But beware! The yield curve inversion strongly hints at an impending recession. 😬 💪 Don't stress about trading! Hop on board Ascend FX Copy Trading and ride those curves, baby! 🌊💸 #RecessionAlert #SoftLanding #AscendFXCopyTrading
0 notes
Text
[ad_1] The beneath is an excerpt from a latest version of Bitcoin Journal Professional, Bitcoin Journal's premium markets publication. To be among the many first to obtain these insights and different on-chain bitcoin market evaluation straight to your inbox, subscribe now. Matters this week:Paul Tudor Jones 3 TradesBitcoin, Ethereum and BNBFinal week, I wrote about The Bitcoin-Gold-China Connection. I pointed to the latest bitcoin and gold oblique correlation, but in addition to a number of attention-grabbing correlations between the three belongings. I need to revisit that subject upfront, as a result of a pioneer of the trendy hedge fund business, Paul Tudor Jones, mentioned in an interview that he's bullish on the “barbarous relics,” lumping bitcoin in with gold.“ extra probably than not, we’re going to enter recession, and there are some fairly clear lower recession trades.”Paul Tudor Jones’ Three Recession Trades1) “The yield curve will get actually steep, and the term-premium goes into the again finish.”Translation: The quick finish of the yield curve falls relative to the lengthy finish. We already see this within the yield curve steepening, particularly the 10Y-2Y (2s10s) and the 10Y-3M (3M10Y). Yields are likely to un-invert previous to recessions. In 2008, it took 36 weeks between un-inverting and recession. In 2020, it took 25 weeks, however simply might have taken longer. BM Professional chart. Projecting ahead, the curve continues to be inverted, and if we estimate an un-inversion by November this yr, a delay of 30 weeks takes us to July 2024. Not surprisingly, this matches the Fed Funds futures pricing within the Fed cuts we mentioned in a earlier letter. It additionally provides bitcoin loads of time to rally by the halving.2) “The inventory market usually, proper earlier than a recession, declines about 12%.”We’ve written about this topic recently as properly. Whereas Jones is right that “proper earlier than” the recession shares usually fall, it's the 18 months main as much as recession that we're in proper now which can be very optimistic. He acknowledges this together with his clarifying assertion, “that’s in all probability going to occur sooner or later, from some stage.” The emphasis right here being that that is his assertion, which means it might climb lots earlier than that imminent recession drop. BM Professional chart. 3) “You take a look at the large shorts in gold. Extra probably than not, in a recession the market is actually lengthy belongings like bitcoin and gold. So, there’s in all probability about $40 billion in shopping for that has to come back into gold sooner or later. So, yeah, I like bitcoin and I like gold proper right here.”Jones says that bitcoin and gold can be correlated and rising in a pre-recessionary surroundings. We agree, and that being the case, recession is probably going additional out than many count on as we look forward to the latest disconnect between gold and bitcoin to sync again up. Checking in on bitcoin and gold, we see the oblique relationship continues. It's probably the gold facet of this correlation that's the one out of sync. It stays a excessive likelihood that China was dumping gold to guard the yuan as a substitute of dumping dollars. Gold and bitcoin will probably get again into sync quickly, as Jones predicts. We're additionally watching the yuan carefully on this respect, hoping it has bottomed in the interim. BM Professional chart. Ethereum and BNB Dragging Bitcoin DownLet me make a case for uncoordinated worth suppression in bitcoin with a couple of charts. I don't suppose it's a grand conspiracy in opposition to bitcoin, however a pure results of the market construction because it exists at this time.Ethereum is bleeding out. Price burning couldn’t reserve it, Proof-of-stake couldn’t reserve it, and now the futures ETFs can’t reserve it. It’s taking place versus the greenback and way more versus bitcoin itself.
The latest BitVM on Bitcoin just isn't an Ethereum killer, however it does rob Ethereum of tons of pleasure and hype. There’s merely no momentum to talk of left in altcoins. BM Professional chart. I've a concept why bitcoin is having slightly bother right here in comparison with our different calls. Bitcoin is being held again by algorithmic buying and selling bots constructed to arbitrage bitcoin/ether discrepancies in worth motion. I don’t have direct proof as of but, however this might clarify the disconnect between bitcoin’s worth motion and all different markets proper now.One other supply of bitcoin worth suppression is Binance. Rumors are flying that the BNB token can also be extremely leveraged like FTX’s FTT token was. The allegation is that Binance is buying and selling bitcoin for BNB to prop up the worth. BM Professional chart. Right here we have now two short-term sources of bitcoin promoting: Ethereum arbitrage and Binance attempting to prop BNB up. Even when there's partial reality about both one, it could be an excellent motive for bitcoin’s comparatively surprising weak point. This weak point is probably going short-term as a result of the inventory market is rising, bonds yields are falling, and the greenback is falling. This provides extra weight to the Bitcoin business rationalization for the slight worth dip. BM Professional chart. We are able to see above that the 200-day (grey) fought off repeated and extended makes an attempt to proceed larger. In our estimation, that is proof of heavy marks on that stage from buying and selling bots with a easy rule: If bitcoin is on the 200-day and ether is beneath, quick bitcoin and lengthy ether. One thing like that.Every day momentum indicators are threatening a bearish shift. RSI has damaged pattern and MACD might cross bearish. On the weekly timeframe nonetheless, these similar indicators are markedly extra bullish. BM Professional chart. Bitcoin is sitting proper on stable quantity assist at $27,000, with loads of room above the strongest assist space if there was a dip. As soon as bitcoin breaks this downward pattern, it can quickly check the resistance band at $31,000. BM Professional chart. There's one other risk we have now to say: Bitcoin is the main indicator on this market. If that's the case, we'd count on shares to rollover and yields to proceed larger, sending us again to the drafting board on our mannequin. In fact, I don’t suppose that's the case, however we should cross that bridge after we get there. For now, the mannequin has been profitable on many macro and micro calls and the standard markets agree with us.AbstractLegend Paul Tudor Jones outlined three recession trades we took a take a look at above. They're a steepening commerce that we already see taking form, a brief inventory market commerce that we don’t fairly see creating but, and bitcoin and gold. A deep dive of the Ethereum, BNB and bitcoin charts reveals some insights about correlation and the state of this market.The beneath is an excerpt from a latest version of Bitcoin Journal Professional, Bitcoin Journal's premium markets publication. To be among the many first to obtain these insights and different on-chain bitcoin market evaluation straight to your inbox, subscribe now. [ad_2]
0 notes
Text
In an environment of soaring interest rates and economic unpredictability, Bitcoin and the broader crypto market face increased headwinds. The shift in the financial landscape was recently underscored by the Benchmark 10-year US Treasury yield, which hit a 16-year high this Thursday. Longest Yield Curve Inversion Ever Historically, an inverted yield curve, where short-term yields are higher than long-term ones, has been a harbinger of economic downturns. Notably, the 10-Year minus the 3-Month Treasury Yield curve has been inverted for a record 217 trading days. Past data indicates that the longer the delay between the inversion and the start of a recession, the more severe the recession is likely to be. Joe Consorti, Market Analyst at The Bitcoin Layer, underscored this concern, remarking on Twitter: “The yield curve is re-steepening at breakneck speed. Up by 10 bps or more today across the curve. Do you know what happens when the yield curve steepens, every single time? Hint: not economic expansion.” The Fed’s recent signals and policy stance have taken the financial world by storm. Charlie Bilello, Chief Market Strategist at Creative Planning, noted, “The 10-Year Treasury Yield moved up to 4.49% today, highest since October 2007. The Real 10-Year Yield (adjusted for expected inflation) of 2.11% is now at the highest level since March 2009.” Bilello also pointed out the significant reduction in the Fed’s balance sheet, which is currently “over 10% below its April 2022 peak.” The two largest drawdowns over the last 20 years were between December 2008 and February 2009 with 18.2% (balance sheet hit a new high in Jan 2010), and from January 2015 to August 2019 with -16.7% (balance sheet hit a new high in March 2020). The rise in the 10-Year Treasury Yield was reiterated by the analysts from “The Kobeissi Letter,” who stated: “BREAKING: 10-Year Note Yield officially hits our 4.50% target… The 10-Year Note Yield is up an incredible 20 basis points in less than 24 hours… With supply side inflation out of control and oil prices back to $90+, the Fed has no choice. Higher for longer is back.” The Federal Reserve’s Stand During Wednesday’s FOMC meeting, the US central bank and chairman Jerome Powell have made clear its intentions, signaling the potential for an additional rate hike this year and forecasting fewer cuts next year. It now forecasts half a percentage point of rate cuts in 2024. Prior, the dot plot showed cut rates by a full percentage point next year. This “higher for longer” strategy seems to diverge from the market’s prior expectations, despite three months of seemingly positive inflation data. Moreover, Powell conveyed confidence in the US. economy, emphasizing the need to ensure interest rates are adjusted correctly to achieve the central bank’s 2% inflation target. However, the market remains uncertain, with the CME Group’s FedWatch Tool indicating only a 32% chance of another rate hike in November and a 45% likelihood by December. Implications For Bitcoin And Crypto Risk assets, including Bitcoin and other cryptocurrencies, have historically been sensitive to increases in the 10-Year Treasury Yield. Charles Edwards, founder of Capriole Investments, highlighted the challenges for the Bitcoin and crypto sector: The Fed wants more unemployment. The job market is still too strong. They’ve raised the expected 2024 rates as a result and the 10YR has broken out to new decade highs. As long as the 10YR is breaking upwards like this, risk assets are going to see further headwinds. Historically, rising yields are indicative of an expectation of higher interest rates, which increase the cost of borrowing. This scenario often leads to a reduction in speculative investments, with investors favoring more stable, yield-bearing assets over riskier options such as Bitcoin and crypto. Another problem for the market is the “higher for longer” approach and the massive reduction of the Fed’s balance sheet.
Risk assets like Bitcoin are traditionally a “sponge” for high liquidity, but when this dries up in the financial market, they usually suffer the most. In addition, concerns about a possible recession will continue to rise due to the inverted yield curve. Remarkably, Bitcoin and crypto have never traded in a recession, the reaction is uncertain. At press time, Bitcoin traded at $26,655. BTC price, 1-day chart | Source: BTCUSD on TradingView.com Source
0 notes
Text
youtube
InvestTalk - 6-30-2023 – U.S. Yield Curve Inversions Deepen on Hawkish Fed and Strong U.S. Data
The Fed is projected to maintain higher interest rates for a longer period of time, as supported by better-than-expected economic statistics released on Thursday.
0 notes
Text
Crescat Capital Update
CRESCAT CAPITAL AUGUST 23, 2023 RESEARCH LETTER & PERFORMANCE UPDATE There is a high probability of a recession in the next twelve months according to the NY Fed’s statistically significant yield-curve inversion model. One wouldn’t know it by looking at risk premia across equity and credit markets. Sub-investment-grade corporate bonds are just one area where there is a glaring imbalance. As one…
View On WordPress
0 notes