#chartbrew
Explore tagged Tumblr posts
Visit Tumblr Blog
Explore Tumblr blogs with no restrictions, modern design and the best experience.
Last Seen Tumblr Blogs


Fun Fact
Tumblr has a 66 index score for customer satisfaction in the US.
Text
ChartBrew
0 notes
Text
ChartBrew

BI tools are softwares that take huge amounts of data from all kinds of sources and process them to produce charts and graphs and other different types of visual media for easy understanding. There are many BI tools available on the market, both proprietary and open source, and one such tool is ChartBrew.
ChartBrew is an open source tool freely available to use. It’s licensed under MIT that means we can also modify it according to our needs. Chartbrew is a web based software, written in JavaScript. React is used to create the frontend and Node.Js framework for backend.
Features
Let’s talk about the features offered in this tool. ChartBrew supports various data sources including major databases like MongoDB, MySql, and analytics sources such as Google, Simple, Plausible. It also has support for REST API giving us the opportunity to create a custom data source if needed.
ChartBrew has a query editor to write queries to our data sources giving us more freedom in fetching data in the shape of our need. Now with the data we can create different kinds of charts and graphs and also KPIs. These charts can be set to auto update themselves, meaning they will keep fetching data from source at regular intervals and present updated information.
Next ChartBrew provides the means to embed these charts as iframes wherever needed. If we don’t want to embed charts but just want to view them, we can create a public dashboard in it, which gives us a public facing URL, accessible from anywhere.
Installation
Now let’s install it and check it out. First clone the repo:
git clone [email protected]:chartbrew/chartbrew.git
Next go to the chartbrew directory and run:
npm run setup
ChartBrew also requires mysql. So install that if you don’t already have it. Create a ‘chartbrewdev’ name database and then add the db username and password to the .env file, namely CB_DB_USERNAME_DEV and CB_DB_PASSWORD_DEV variables.
And finally start it by running:
npm run client
for frontend, and for backend,
npm run server
Creating a Project

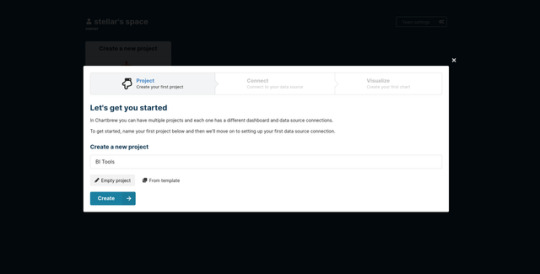
Let’s give it the name ‘BI Tools’.
Now we create a connection i.e., we choose our data source. I’m choosing MongoDB.
Fill in the usual db details for creating a db connection, test it and then save it.
Creating a Chart
Now we create a chart, first choose the chart name and click ‘Start Editing’. You can then follow the small walkthrough explaining what is what.
Now we are at the chart builder page. For our chart we need to create a dataset, so click on ‘Add the first dataset’ button choose the dataset name, save it and then select the datasource. I chose MongoDB before and saved the connections by ‘mongo-source’ name so I can see that in the list and I select it.
Now click on the ‘Make Request’ button, this will open the query editor and again a little walkthrough. In my database there is a collection ‘blogs’ which store details regarding a blog such as ‘title’, ‘author’, ‘likes’, and ‘comments’. So my query is:
connection.collection(‘blogs’).find()
On clicking ‘Test the query’, query’s response is displayed on the right side:
Next I save the query for future usage and click on the ‘Build the chart’ button. Then the chart builder page will open again, and now we choose what data should appear on the chart’s X and Y axis. I want to know t he number of likes on each blog so I choose ‘title’ for X-axis and ‘likes’ for Y-axis. And voila, our chart is ready!
As we can see there are other chart options we can choose from such as bar chart, pie chart, polar chart etc. There are some other features available here too like adding filters, modifying axis data, changing colors used on charts, exporting data to excel sheets.
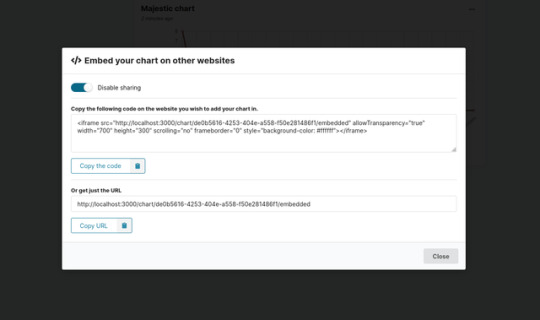
Embedding Charts
Now we want to embed our chart somewhere else, so first we remove it from draft mode by toggling ‘Draft’ mode at the top of the chart. Next go to ‘Dashboard’ from the left side nav.

Public Dashboard
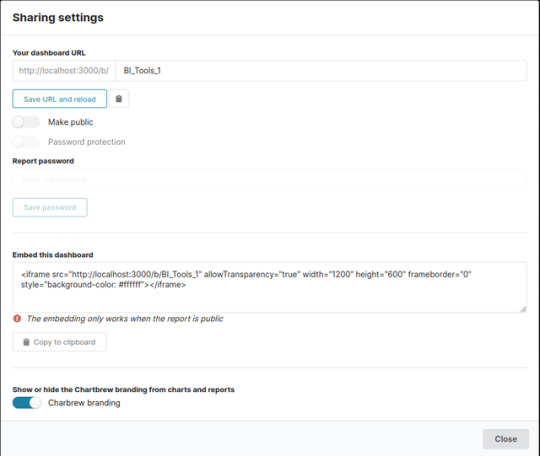
Toggle ‘Make Public’ and it’s done. As you can see we can also modify the URL to whatever we want.
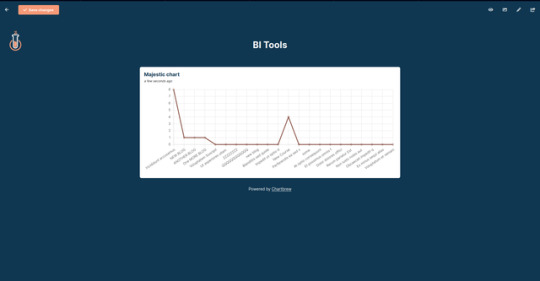
Finally our BI tool is ready!
Final thoughts
ChartBrew also has options to manage teams and a granular permission system for creating and modifying charts among other things.
This was a small tutorial on how to use ChartBrew. There are a lot of tools out there but I personally like ChartBrew because of its simplicity to use, its MIT licensing and that it’s coded in React and NodeJs. Your mileage may vary. Cheers!
0 notes
Link
電子書籍:はじめてさわるReact & JavaScript with TypeScript (アマゾン Kindle)
メルカリにおけるA/Bテスト標準化への取り組み (Mercari Analytics | note)
グーグルによるタイトルタグの書き換え率は84%超、あおり文言などが削除対象に (MarkeZine)
10年のときを経てグーグル検索にインデント結果が復活 (海外SEO情報ブログ)
様々なデータを可視化してダッシュボードで確認出来るようにする「Chartbrew」 (かちびと)
typeorm + absurd-sql on Browserのロマン構成 (mizchi | Zenn)
グーグルアナリティクスの自動レポート作成方法は?使い方を詳しく解説 (フェレット)
HTMLにちょい足しでできる!Vue.jsでサクッと動きをつける方法 (ICS MEDIA)
最近見かける、粒子の粗いグラデーション!ほんの少しのCSSとSVGで実装できるの知ってた? (コリス)
0 notes
Text
Show HN: Open-Source multi-dashboarding platform for teams and client reporting
https://github.com/chartbrew/chartbrew Comments
0 notes
Photo

Chartbrew - One Dashboard to View, Create and Share Your Data https://ift.tt/3kZzBjt
0 notes