#graphguy
Explore tagged Tumblr posts
Visit Tumblr Blog
Explore Tumblr blogs with no restrictions, modern design and the best experience.
Last Seen Tumblr Blogs


Fun Fact
If you dial 1-866-584-6757, you can leave an audio post for your followers.
Photo

US flu deaths
by graphguy/reddit
395 notes
·
View notes
Text
[OC] A beautiful mortgage rate graph

by graphguy See more http://bit.ly/34US0pJ
0 notes
Photo

Star Trek (the original series 79 episodes) summarized via @ http://www.liveinfographic.com/ graphguy, June 12, 2017 at 07:28PM
4 notes
·
View notes
Photo

10 Richest Billionaires per Year
by graphguy/reddit
188 notes
·
View notes
Photo

Locations of those fatally shot by police in 2020
by graphguy/reddit
18 notes
·
View notes
Photo

US President age graph
by u/graphguy
43 notes
·
View notes
Photo
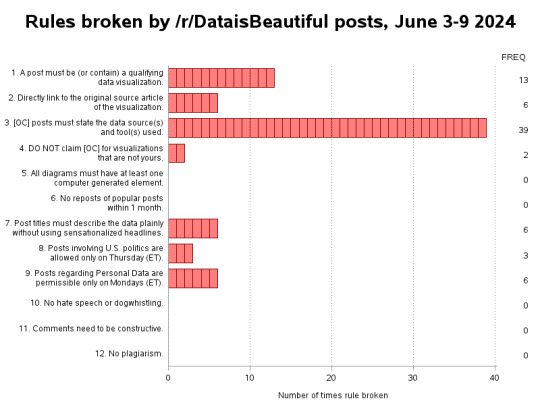
Remix: Rules broken by /r/dataisbeautiful posts 2024 June 3–9
by graphguy
23 notes
·
View notes
Photo

"[OC] #California and #Tennessee seem to currently be the #covid19 outliers"- Caption by graphguy - Detail: https://ift.tt/3pkyvRW. Filed Under: 1,000 ways to visualize Data. Curated by: www.eurekaking.com
0 notes
Photo

"[OC] 13 years of Friday the 13th!"- Caption by graphguy - Detail: https://ift.tt/36w8qaF. Filed Under: 1,000 ways to visualize Data. Curated by: www.eurekaking.com
0 notes
Photo

"[OC] 5 decades of US mortgage rates (in the style of Joy Division's album cover)"- Caption by graphguy - Detail: https://ift.tt/2HFq7vV. Filed Under: 1,000 ways to visualize Data. Curated by: www.eurekaking.com
0 notes
Photo

"[OC] A beautiful mortgage rate graph"- Caption by graphguy - Detail: https://ift.tt/2KG6MJx. Filed Under: 1,000 ways to visualize Data. Curated by: www.eurekaking.com
0 notes
Photo

"[OC] In pursuit of a better M&M bar chart!"- Caption by graphguy - Detail: https://ift.tt/2BgHk8n. Filed Under: 1,000 ways to visualize Data. Curated by: www.eurekaking.com
0 notes
Photo

"Building a better 'population pyramid' chart"- Caption by graphguy - Detail: http://bit.ly/2It9SC7. Filed Under: 1,000 ways to visualize Data. Curated by: www.eurekaking.com
0 notes
Photo

"Ages of past US presidents"- Caption by graphguy - Detail: https://ift.tt/2B9WYTX. Filed Under: 1,000 ways to visualize Data. Curated by: www.eurekaking.com
0 notes
Photo

"Visualizing Daylight Savings Time [OC]"- Caption by graphguy - Detail: https://ift.tt/2JCOE1w. Filed Under: 1,000 ways to visualize Data. Curated by: www.eurekaking.com
0 notes
Photo

"Chess ELO rating -vs- age (using "virtual X-ray glasses" on dense scatter plots) [OC]"- Caption by graphguy - Detail: https://ift.tt/2LJRNwJ. Filed Under: 1,000 ways to visualize Data. Curated by: www.eurekaking.com
0 notes