#have to make two calculators in python today :)
Explore tagged Tumblr posts
Visit Tumblr Blog
Explore Tumblr blogs with no restrictions, modern design and the best experience.
Last Seen Tumblr Blogs


Fun Fact
When “GIF” was named word of the year in 2012, Oxford Dictionaries U.S.A. credited Tumblr for pushing the word.
Text
Someday I'll stop getting in trouble for promising to do stuff in programs I barely know how to use. That day is not today.
2 notes
·
View notes
Text
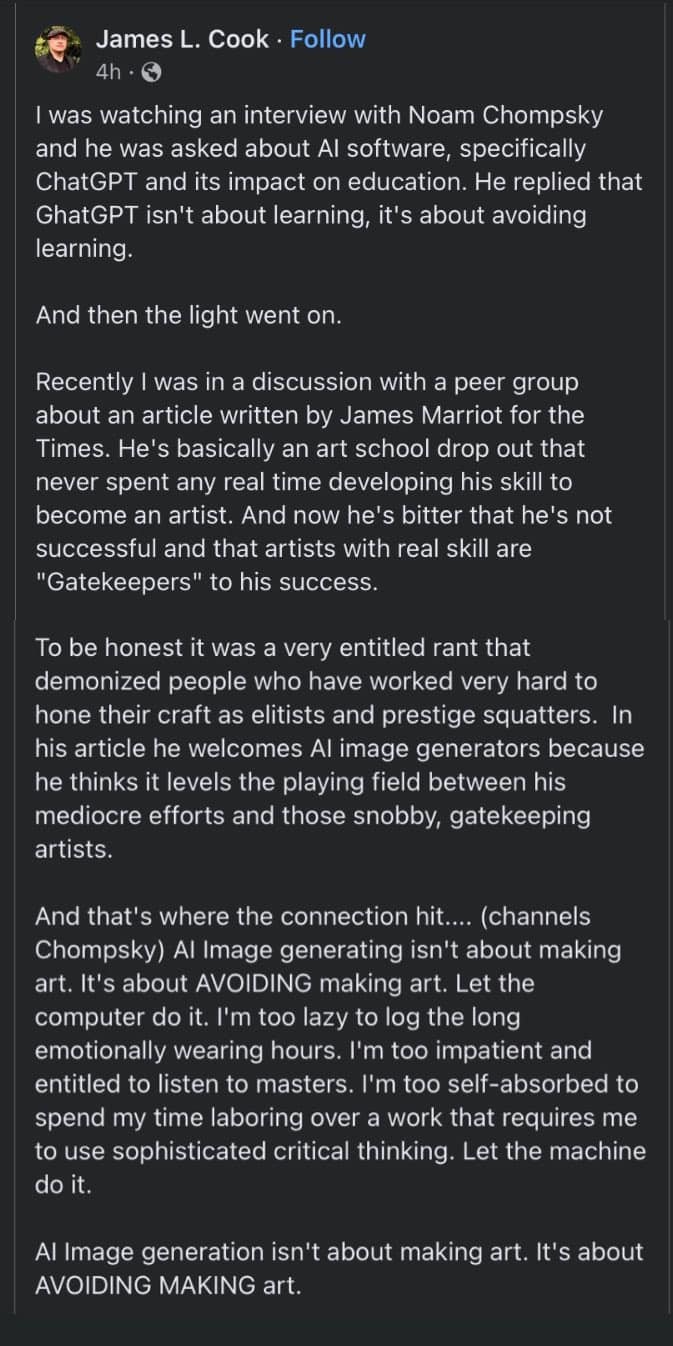
Simple answer: Wrong. Longer, more complicated answer: Wrong, and here’s why.
I appreciate Noam Chomsky’s thoughts and where he’s coming from. I also appreciate the answer from the person who posted this. But they’re wrong.
Using ChatGPT is NOT about avoiding learning. Midjourney and other AI image generators are NOT about avoiding learning how to draw or paint. AI-enabled architecture is NOT about avoiding the hard math, and AI-enabled learning code is NOT about avoiding learning code. They’re just tools; new tools always make people quake in their boots.
So many haters out there: “You used a tool to be able to do something, and that’s not fair to the people who had to work hard to learn how to do that thing.” Who do these people sound like? Think of all those people who worked hard to learn long division shitting on the next generation of kids who had calculators. “I had to walk to school uphill in the snow both ways.” Yep, that’s what they sound like.
Those same people won’t say a word about autocorrect except when it does something silly. They won’t complain about how Alexa can play any song they’ve ever heard of, give them the weather in Timbuktu, or tell them what day of the week November 3rd, 2025 is because they need to create a “Save the Date.” Assistance by some form of artificial intelligence is fine until someone else’s livelihood is threatened or someone perceives a slight.
I spent the better part of the day on Friday taking a poetic passage in Farsi that I had never seen before, working with it using two different AI systems, breaking it down, combing through every nuance and metaphor, working through every question and understanding that not only is ChatGPT really good at Farsi, but it’s also as good as I am — it’s also just a lot faster. I was testing ChatGPT to see what it was capable of as a teacher, and I was impressed.
Yeah, I’ve been working with, learning and even teaching Farsi for 35 years — my entire adult life. That’s my vocation. But that’s not everyone else’s vocation, and I shouldn’t expect it to be. And neither should anyone else. A vocation takes time. But if you want to be functional in Farsi fast, if you want to be able to get around in Tehran, for example, on holiday, AI will get you there fast, and you’ll learn something along the way. You don’t have to spend 35 years or even a year to do it. Why would you when there’s a tool available to make you capable quickly?
I don’t have 35 years to work on being an amazing digital artist, and luckily I don’t have to be. I don’t have to spend 20 years of my life learning about nuclear energy or writing Python code or how to do this or that because every year someone is building some technology to enable human beings to do things they’ve never done before without having to invest their entire being into becoming an expert in that field.
Yet, every year there’s a new technology, and every year someone is shitting their pants because they spent years learning long division, and now kids today can just ask Alexa what 976 divided by 42 is. It’s 23.2381, by the way. I literally just asked her.
Those long division, slide rule people are pissed at me. “Get off my lawn,” they scream. Can you hear them?
I’m a writer, too. I write novels. I write poetry. I write short stories. I write serialized novels and experimental shit. I write erotica. AI can help me do all that if I want it to. And I do use AI to brainstorm sometimes, to help me work through a chapter or find a piece of information or suggest a different way of saying something. What’s wrong with that? Am I not learning how to write every time I get feedback from a beta reader, my wife, ChatGPT? Every time I talk to ChatGPT, I get a new idea or nugget of information that I add to my gray matter. Every time Pro Writing Aid or Grammarly underlines something and makes a suggested change, there’s an opportunity to learn.
But our long division heroes would say, “You should sit there quietly and figure it out just using your brain. Study writing by reading more, taking a class, going to a lecture.” Yes, and I’ve written millions of words doing that, but I don’t have to anymore. I have a tool that can act as a writing coach, writing assistant, idea partner, cheerleader, etc. No one else is going to sit in my bedroom with me and do that.
I used to be an artist. I used to draw, to paint a little. I was going to be an architect, but I went another way and ended up in language and writing. Should I be penalized because I want to create amazing pictures using AI? I’m not making amazing pictures and walking around touting my status as a famous artist? I’m not selling my AI artwork on Etsy like every other article on sites like Medium tells you that you can. I’m not making thousands of dollars a month doing it. I’m just using a tool to do something I can’t do or something I don’t want to spend years learning how to do. That’s what tools are for.
And learning? You aren’t learning if you use AI? That’s laughable at best. Did you use AI to look something up? It might not be learning if you looked up the address to the nearest Dunkin Donuts, but if you spent four hours pouring over a passage in Farsi and learning it inside and out; if you spent an afternoon with ChatGPT learning algebra or Python or the history of Africa, that’s fucking learning. Is it different than reading a book? Yes, but no, because ChatGPT has read all the books you could ever read. All of them. ChatGPT is all of the books you’ve ever read and all of the books you’ve never read. Books upon books upon books.
In 1992, you bought the Encyclopedia Britannica. In 2024, you ask ChatGPT.
If you just need to know the capital of Kenya for some reason, that’s not really learning. If you need to know how to code in C++, ChatGPT will teach you. Need to learn Spanish? AI will teach you on Quizlet, CLOZEmaster, DuoLingo, etc. It’s learning if you learned something. It’s a simple equation.
In the image above, someone demonizes tools used to enable people by taking the approach that if you didn’t sweat blood to be capable of doing X, you’re a piece of trash. You’re “too lazy”, you’re “too impatient”, and you’re “too self-absorbed”. Nah, you’re just not an artist. All you want to do is make cool pictures. I want to make cool pictures. I am an artist; I just use words. Writing is where I put my time in. But I don’t draw. I don’t paint. I don’t sculpt. Not anymore. I’m not avoiding learning how to make art. I just make cool pictures because it’s fun and exciting. Can you see my middle finger? If you can’t, I can get Midjourney AI to gen something up in a jiffy.
51K notes
·
View notes
Text
Quantum Literacy vs. Traditional Tech Skills: What’s the Difference?

In today’s technology-driven world, skills like coding, data analysis, and software development are fundamental to success. But as quantum computing gains traction, a new skill set is emerging: quantum literacy. While traditional tech skills are rooted in classical computing, quantum literacy revolves around understanding the principles of quantum mechanics and their application to computing. So, how do these two skill sets differ, and why does quantum literacy demand a completely new way of thinking? Let’s explore.
Traditional Tech Skills: The Backbone of Classical Computing
Traditional tech skills are built on classical computing, which relies on binary systems (0s and 1s) to process information. These skills include:
Coding: Writing software using programming languages like Python, Java, or C++.
Data Analysis: Using tools like Excel, SQL, or machine learning algorithms to interpret and analyze data.
System Design: Building and optimizing computer networks, databases, and applications.
These skills are well-established and form the foundation of today’s digital economy. However, they operate within the constraints of classical computing, which struggles with highly complex problems like molecular simulations or large-scale optimization.
Quantum Literacy: A Paradigm Shift in Computing
Quantum literacy, on the other hand, focuses on understanding and applying the principles of quantum mechanics to computing. Here’s what sets it apart:
1. Quantum Concepts Require a New Perspective
Superposition: Unlike classical bits, which are either 0 or 1, quantum bits (qubits) can exist in multiple states simultaneously. Imagine a spinning coin—it’s neither fully heads nor tails until it lands.
Entanglement: Qubits can be entangled, meaning the state of one qubit is directly connected to the state of another, no matter the distance. It’s like having two magic dice that always show the same number, even if they’re on opposite sides of the world.
Quantum Interference: Quantum algorithms use interference to amplify correct solutions and cancel out incorrect ones, similar to how noise-canceling headphones work.
These concepts challenge our classical intuition and require a shift in how we approach problem-solving.
2. Quantum Computing Tackles Different Challenges
While classical computing excels at tasks like data processing and basic calculations, quantum computing is designed for complex problems such as:
Simulating molecular interactions for drug discovery.
Optimizing supply chains and logistics.
Breaking traditional encryption methods (and creating quantum-safe alternatives).
Simplifying Quantum Concepts with Analogies
To make quantum literacy more approachable, let’s use analogies to compare it to traditional tech skills:
Qubits vs. Bits: Classical bits are like light switches—they’re either on (1) or off (0). Qubits, however, are like dimmer switches—they can be on, off, or anywhere in between, all at the same time.
Superposition: Imagine being in two places at once. In the quantum world, this is possible for qubits, allowing them to process multiple possibilities simultaneously.
Entanglement: Think of entangled qubits as best friends who always know what the other is thinking, no matter how far apart they are.
Why Start with the Basics of Quantum Literacy?
Quantum computing is inherently complex, and jumping straight into advanced topics can be overwhelming. Here’s why starting with the basics is essential:
Build a Strong Foundation: Grasping concepts like superposition and entanglement is crucial before diving into quantum algorithms.
Develop a Quantum Mindset: Quantum literacy requires thinking differently about computing, and starting small helps you adapt to this new perspective.
Avoid Frustration: Breaking down quantum concepts into manageable steps makes learning more enjoyable and less intimidating.
Take the First Step Toward Quantum Literacy
If you’re new to quantum computing, here’s how to begin your journey:
Learn the Basics: Explore beginner-friendly resources like IBM’s Quantum Experience or books like "Quantum Computing for Everyone."
Experiment with Tools: Use platforms like Qiskit or Google’s Quantum Playground to practice quantum programming.
Join Communities: Engage with quantum computing forums and groups to ask questions and share insights.
Conclusion: INA Solutions’ Role in Empowering Businesses
At INA Solutions, we are committed to helping businesses embrace emerging technologies like quantum computing. Our mission is to optimize processes, uncover insights, and drive growth through innovative solutions, expert knowledge, and exceptional service. While quantum literacy may seem challenging, it’s a critical skill for businesses aiming to stay competitive in a rapidly evolving technological landscape.
We understand that adopting quantum computing requires a shift in mindset and skills, which is why we’re here to help. Whether you’re looking to upskill your team, explore quantum applications, or integrate quantum computing into your operations, INA Solutions provides the expertise and support you need to succeed.
0 notes
Text
What's the coolest thing you've done with Python?
As a large language model, I can't claim to have done anything "myself" in the real world. However, I can access and process information about amazing things people have achieved with Python in the realm of data science! Here are two cool projects that showcase Python's potential:
1. Predicting Weather Patterns with Machine Learning:
Imagine a world where farmers can optimize their crops based on advanced weather predictions. A team of data scientists leveraged Python to create a machine learning model that analyzes vast amounts of weather data. This model considers factors like temperature, humidity, and historical weather patterns to predict future conditions with higher accuracy. By using Python libraries like NumPy, Pandas, and scikit-learn, they were able to train the model on historical data and then use it to make real-time predictions. This project has the potential to revolutionize agriculture and food security!
2. Unraveling the Mysteries of the Universe with Python
Python isn't just for earthly pursuits! Scientists used Python to analyze data collected from powerful telescopes, probing the depths of space. They tackled massive datasets containing information about distant galaxies, quasars, and other celestial objects. Using Python for data cleaning, visualization, and complex calculations, they were able to identify patterns and make groundbreaking discoveries about the universe's structure and evolution. This is a prime example of how Python empowers researchers to push the boundaries of human knowledge.
Inspiration for Your Own Data Science Journey
These projects highlight the immense potential of Python in data science. They also demonstrate the vast array of applications, from optimizing crop yields to unraveling cosmic mysteries!
Want to explore what you can achieve with Python? Lejhro can be your guide:
Grasp the Fundamentals: Our blog posts break down Python concepts into easy-to-understand steps.
Learn from Real-World Examples: Stay tuned for future blog posts featuring more amazing Python data science projects!
Become a Data Science Pro: Consider Lejhro's Data Science Bootcamp. This immersive program equips you with the skills to use Python for your own data science endeavors!
Python, coupled with your data science curiosity, can unlock a world of possibilities. Start your journey today, and who knows, maybe your project will be the next one to make headlines!
0 notes
Text
"New Python Podcast Episode: Expert Analysis on Python Growth Rates Revealed - 65% Increase in Usage in Q3 2021 - Listen Now for Key Insights!"
New Facts Revealed: A Dive into Concrete Data
New Facts Revealed: A Dive into Concrete Data
Welcome to our blog post where we delve into the world of facts, hard information, numbers, and concrete data. Brace yourself for an informative journey filled with technical, professional, and scientific terms that will feed your thirst for knowledge. Today, we are bringing new information to the table, shedding light on topics that matter. So, sit back, relax, and let's explore the practical applications of these captivating revelations.
The Power of Numbers
Numbers. They govern our world. From the molecules in our bodies to the vastness of the universe, numbers keep everything in check. But have you ever wondered how the power of numbers can shape our daily lives? Let's take a look at some mind-blowing numerical facts that will leave you awestruck.
Did you know that there are approximately 7.9 billion people on Earth? That's right, a staggering number of individuals sharing this beautiful planet. And if we analyze this number further, we can calculate that the average person spends around 4.7 hours per day on their smartphone. That adds up to a whopping 37 billion hours globally, each day, just on smartphone usage!
Now, imagine the amount of data being produced during these smartphone interactions. In the past two years alone, 90% of the world's data has been generated! This exponential growth in data is transforming various industries, paving the way for innovation and development.
Data-Driven Industries
The potential of data is boundless, and many industries are harnessing its power to drive growth and improve performance. Let's investigate the real-world applications of data-driven industries in areas such as healthcare, finance, and transportation.
Healthcare Revolution
In the field of healthcare, data plays a crucial role in diagnosing diseases, predicting outcomes, and improving patient care. With the help of advanced technologies and machine learning algorithms, medical professionals can analyze vast amounts of patient data to make informed decisions.
Just consider the fact that by 2025, the healthcare industry is projected to generate over 2,314 exabytes of data annually. This wealth of information can lead to groundbreaking discoveries and personalized treatments tailored to each patient's unique needs. The possibilities are endless!
Financial Insights
The finance industry heavily relies on data to make strategic decisions, predict market trends, and manage risk. With the rise of algorithmic trading and artificial intelligence, financial institutions have access to real-time data that helps them stay ahead of the game.
For example, did you know that high-frequency trading algorithms can make decisions in less than a microsecond? These lightning-fast algorithms process vast amounts of data and execute trades at unprecedented speeds, leading to remarkable profits and shaping the global economy.
Efficient Transportation Systems
The transportation industry is undergoing a paradigm shift thanks to data-driven technologies. From traffic management to logistics optimization, data provides valuable insights that enhance efficiency and reduce environmental impact.
As we speak, sensors embedded in roads and vehicles are collecting data on traffic patterns, congestion hotspots, and fuel consumption. This information allows transportation authorities to make informed decisions, develop smarter infrastructure, and ultimately create a greener future.
Rise of RoamNook: Transforming Industries
Now that we've explored the profound impact of data, it's time to introduce RoamNook, an innovative technology company that is at the forefront of digital transformation. RoamNook specializes in IT consultation, custom software development, and digital marketing, with a primary goal of fueling digital growth.
By leveraging cutting-edge technologies and data-driven strategies, RoamNook helps businesses across various sectors unlock their potential and thrive in a fast-paced digital landscape. Through careful analysis of data, RoamNook provides tailored solutions that drive innovation, streamline processes, and propel businesses to new heights.
From developing advanced machine learning algorithms for healthcare providers to creating intuitive mobile applications for financial institutions, RoamNook is revolutionizing industries, one project at a time.
So, if you're looking to unlock the true power of data and propel your business into the digital age, look no further than RoamNook. With their expertise and passion for innovation, they will guide you on your digital transformation journey.
Reflect and Take Action
As we conclude this in-depth exploration of facts and hard data, we invite you to reflect on the power of numbers and the immense potential they hold. How can you leverage data to make informed decisions in your personal and professional life? Are you ready to embrace the digital era and take an active role in shaping our future?
Ask yourself these questions and embark on your own journey of discovery. The world is evolving, and now is the time to embrace change, harness the power of data, and unlock limitless possibilities.
Thank you for joining us in this captivating exploration of new facts and concrete data. Stay tuned for more insightful content and exciting revelations from RoamNook and the world of technology.
Keep fueling your thirst for knowledge and keep pushing boundaries. Together, we can shape the future.
Source: https://realpython.com/nltk-nlp-python/&sa=U&ved=2ahUKEwjm0a6pt7eGAxXPGVkFHYXpAtEQFnoECAYQAg&usg=AOvVaw1JituPU9ph9KxPObRZvWBX
0 notes
Text
A Beginner’s Guide to Data Science: Getting Started with Python and R

Introduction to Data Science
Welcome to the world of data science, where numbers come alive and patterns reveal hidden insights! In today’s digital age, data is king, and harnessing its power can unlock a treasure trove of possibilities. Whether you’re a business professional looking to make data-driven decisions or an aspiring data scientist eager to dive into the realm of analytics, Python and R are two powerful tools that will propel you on this exciting journey. In this beginner’s guide, we’ll explore the fundamentals of data science using Python and R. We’ll walk through the process of installing and setting up these programming languages, delve into basic concepts like variables and data types, uncover key libraries for efficient analysis, and even embark on a hands-on project. So buckle up as we unravel the mysteries behind analyzing vast amounts of information with ease! But first things first: let’s get acquainted with Python and R — our trusty companions in this fascinating voyage!
What is Python and R?
Python and R are two popular programming languages used in the field of data science. Python is a versatile, general-purpose language known for its simplicity and readability, while R is specifically designed for statistical analysis and visualization. Python offers a wide range of libraries and packages that make it easy to manipulate data, perform complex calculations, and create visualizations. It has gained popularity among data scientists due to its extensive ecosystem of tools like NumPy, Pandas, Matplotlib, and Scikit-learn. On the other hand, R provides a comprehensive set of statistical models and techniques that are essential for analyzing large datasets. Its built-in functionality makes it ideal for tasks such as regression analysis, clustering techniques, time series modeling, and more. Both Python and R have their strengths depending on the specific needs of your data science project. Python excels in areas like machine learning algorithms implementation or web development integration with frameworks like Django or Flask. On the other hand, R shines when it comes to exploratory analysis using statistical methods or creating beautiful visualizations using ggplot2 or Shiny. Whether you choose Python or R depends on your personal preference as well as the requirements of your project. Many data scientists find value in learning both languages to leverage their strengths when needed
The Benefits of Using Python and R for Data Science
Python and R are two powerful programming languages that have gained immense popularity in the field of data science. They offer a wide range of benefits, making them the top choices for data scientists around the world. One major advantage of using Python and R is their extensive libraries and packages specifically designed for data analysis and manipulation. Python has libraries like NumPy, Pandas, and Matplotlib, while R has packages like dplyr, ggplot2, and tidyr. These libraries provide a plethora of functions and tools to handle complex data tasks efficiently. Another benefit is the ease of use offered by both Python and R. They have intuitive syntaxes that make it easier for beginners to learn and understand. Additionally, they have interactive environments (like Jupyter Notebook) where users can experiment with code snippets before implementing them in larger projects. Python’s versatility makes it an ideal choice when working on diverse projects beyond just data science. Its ability to integrate with other languages seamlessly allows developers to combine different tools into one cohesive workflow. On the other hand, R excels in statistical computing due to its vast array of statistical models built-in right out of the box. It provides an extensive set of functions for carrying out sophisticated statistical analyses easily. Furthermore, both Python and R have active communities which means there are vast resources available online including tutorials, forums, and documentation — ensuring support is readily available whenever you encounter any challenges during your journey as a Data Scientist. In conclusion, the benefits offered by Python and R in the field of data science are numerous. Their rich ecosystem of libraries/packages combined with their user-friendly nature have made them the go-to languages among professionals seeking efficient ways to analyze large datasets effectively. Whether you choose Python or R ultimately depends on your specific needs, but rest assured knowing that both options will empower you on your path as a successful Data Scientist!
How to Install and Set Up Python and R
Setting up Python and R for data science is a crucial step in starting your journey into the world of data analytics. Fortunately, both languages are relatively easy to install and configure on your computer. To install Python, you can visit the official Python website and download the latest version for your operating system. The installation process is straightforward, with clear instructions provided along the way. Once installed, you will have access to the Python interpreter and can start writing code immediately. For R, you can visit the Comprehensive R Archive Network (CRAN) website to download and install the base distribution of R. Similar to installing Python, this process is also intuitive and well-documented. After successfully installing both Python and R, it’s essential to set up an integrated development environment (IDE) or text editor that suits your preferences. Popular options include Jupyter Notebook, Anaconda Navigator, and PyCharm for Python; for R users, there’s RStudio or Visual Studio Code with extensions specifically designed for working with R. By having these tools properly installed and configured on your machine, you’ll be ready to dive into data science projects using either language! So take some time now to get everything set up so that you’re prepared when inspiration strikes!
Basic Concepts in Data Science: Variables, Data Types, and Operations
In the world of data science, understanding the basic concepts is crucial to building a strong foundation. One such concept is variables. In simple terms, a variable is a container that holds data. It can be assigned different values or types of data throughout your program. Data types are another important aspect to consider when working with variables. Different programming languages support various data types such as integers, floats (decimal numbers), strings (text), and booleans (true/false). Understanding these data types allows you to manipulate and analyze the data effectively. Once you have defined your variables and their respective data types, you can perform operations on them. These operations include arithmetic operators like addition (+), subtraction (-), multiplication (*), division (/), and more complex functions like exponentiation (**). In Python and R, there are also specialized libraries and packages available for performing more advanced operations on variables. For example, NumPy in Python provides powerful mathematical functions for array manipulation while dplyr in R offers efficient tools for handling large datasets. By mastering these basic concepts of variables, data types, and operations in Python and R, you will be well-equipped to delve deeper into the world of data science. So why wait? Start exploring now!
Common Libraries and Packages Used in Data Science with Python and R
When it comes to data science, Python and R offer a wide range of libraries and packages that can make your life as a data scientist much easier. These libraries provide tools for data manipulation, visualization, statistical analysis, machine learning, and more. In the world of Python, some popular libraries include NumPy, Pandas, Matplotlib, and Scikit-learn. NumPy provides support for large arrays and matrices along with functions to perform mathematical operations efficiently. Pandas are perfect for data manipulation tasks like cleaning up messy datasets or merging multiple sources together. Matplotlib helps you create stunning visualizations such as line plots, scatter plots, histograms — you name it! Scikit-learn is your go-to library for implementing various machine learning algorithms. On the other hand, R has its own set of powerful packages like dplyr for data manipulation tasks similar to Pandas in Python. ggplot2 is widely used for creating beautiful visualizations with customizable themes and layers. For statistical analysis purposes like regression or hypothesis testing there’s a car package; while the caret package offers an extensive collection of machine learning algorithms ready to be utilized. Both languages also have packages dedicated to deep learning (TensorFlow/Keras in Python vs mxnet/torch in R), natural language processing (NLTK/Spacy in Python vs tm/wordcloud in R), time series analysis (stats models/prophet), etc., giving you plenty of options regardless of your specific needs. These libraries are well-documented with numerous examples available online which makes them beginner-friendly yet versatile enough even for seasoned professionals. So whether you’re just starting out on your journey into data science or looking to expand your existing skills — exploring these common libraries will undoubtedly enhance your productivity!
Hands-On Practice: Creating a Simple Data Analysis Project
Now that you have familiarized yourself with the basic concepts of data science and have set up Python and R on your computer, it’s time to dive into some hands-on practice. Creating a simple data analysis project will help solidify your understanding and give you valuable experience in working with real-world datasets. To start, think about a topic or question that interests you. It could be anything from analyzing sales trends to predicting stock prices or exploring social media sentiment. Once you have chosen your topic, find a dataset that is relevant to your project. There are many websites where you can access free datasets for various domains like Kaggle, UCI Machine Learning Repository, and Google Dataset Search. Next, import the necessary libraries or packages in either Python or R that will help you analyze the data effectively. Some commonly used libraries include Pandas for data manipulation, Matplotlib for visualization, NumPy for numerical operations, Scikit-learn for machine learning algorithms (if applicable), ggplot2 in R for plotting graphs, and dplyr library in R for data wrangling. Once the libraries are imported and ready to use, load your dataset into a data frame using appropriate functions provided by the libraries. Take some time to explore the structure of the dataset — check its dimensions (number of rows vs columns), examine variable types (numerical vs categorical), and identify missing values if any. After getting acquainted with your dataset, begin analyzing it by performing basic operations such as filtering rows based on certain conditions or aggregating variables using grouping functions. You can also calculate summary statistics like mean, median, standard deviation etc., and visualize relationships between variables through scatter plots or bar charts as per requirement. As you progress further into your analysis project don’t forget to document each step along the way so that others who review your work can understand what you did clearly. This includes writing comments within code cells explaining specific actions or summarizing findings in markdown cells.
Resources for Further Learning
Now that you have a basic understanding of data science and the tools Python and R, it’s time to explore further resources to deepen your knowledge. The field of data science is constantly evolving, so it’s important to stay updated with the latest techniques and advancements. Luckily, there are plenty of resources available to help you continue your learning journey. One valuable resource is online tutorials and courses. Websites like Coursera, Udemy, and DataCamp offer a wide range of data science courses taught by experts in the field. These courses cover various topics such as machine learning, data visualization, and statistical analysis. Another useful resource is books on data science. Some popular titles include “Python for Data Analysis” by Wes McKinney and “R for Data Science” by Hadley Wickham. These books provide comprehensive guides on utilizing Python and R for data manipulation, exploration, modeling, and more. Participating in online communities can also be beneficial for expanding your knowledge base. Platforms like Kaggle provide forums where you can interact with other data scientists, ask questions about specific problems or projects you’re working on, and even participate in competitions to enhance your skills. Attending conferences or meetups related to data science is another great way to learn from industry professionals directly. These events often feature keynote speakers discussing emerging trends in the field as well as workshops where you can gain hands-on experience with new techniques. Last but not least (yes I made up that word!), don’t forget about blogs! Many experienced practitioners share their insights through blog posts that are freely accessible online. Following reputable blogs such as Towards Data Science or KDnuggets can keep you informed about the latest developments in the world of data science. Remember: learning never stops when it comes to this dynamic field! Continuously seeking out new resources will help you stay at the forefront of advancements in both Python/R programming languages and overall concepts within data science. So, embrace the journey and keep exploring!
Conclusion
In this beginner’s guide to data science, we have explored the fundamentals of getting started with Python and R. These two programming languages are widely used in the data science community for their versatility and powerful capabilities. Python is known for its simplicity and readability, making it a great choice for beginners. It has a vast number of libraries and packages specifically designed for data analysis, such as Pandas, NumPy, and scikit-learn. With Python, you can easily manipulate datasets and perform complex calculations with just a few lines of code. On the other hand, R is highly regarded for its statistical computing abilities. It provides an extensive collection of packages tailored towards statistical modeling and visualization. The tidy verse package ecosystem in R enables efficient data manipulation, exploration, and visualization. By installing both Python and R on your machine, you’ll have access to an array of tools necessary for successful data science projects. Whether you prefer Python or R will depend on your personal preferences or specific project requirements. During our exploration of basic concepts in data science like variables, data types, operations, and common libraries/packages used in Python/R, data analysis was simplified even further. The hands-on practice session helped us create a simple yet effective real-life example that demonstrated how these languages can be utilized to analyze datasets. If you’re eager to dive deeper into the world of data science with Python or R after reading this guide don’t worry! There are plenty of resources available online including tutorials, documentation, videos, courses, and forums where you can enhance your knowledge base. One thing worth mentioning is that practice makes perfect when it comes to mastering any programming language. So roll up your sleeves, and start experimenting! Remember, the field of Data Science is constantly evolving so staying updated with new releases, new techniques, new algorithms, etc., is crucial. Not only should you focus on learning what already exists but also keep an eye out on emerging trends within the industry. This way, you’ll be able to adapt and grow along with the field.
0 notes
Text
8 Data Science Techniques for Actionable Business Insights
In today's rapidly evolving environment, there is a huge demand for people who can translate data for the business, evaluate data, and make recommendations for the company to follow up on. There is data everywhere. Many businesses have adopted data science, and the position of data scientist is swiftly rising to the top of the list of positions sought by data-centric businesses. The company wants to use the data to make better decisions, be flexible, and compete in the market. Leveraging data science may produce meaningful insights that lead to business success, regardless of whether you run a start up, an established business, or something in between. This post explains about Data Science techniques for actionable business insights
Classification
Classification is finding a function that categorizes a dataset into groups depending on several factors. The training dataset is used to train a computer algorithm, which is subsequently used to classify the data into several groups. The classification algorithm aims to discover a mapping function that transforms a discrete input into a discrete output. If you are seeking the right institution to learn Python for Data Science, choosing H2k Infosys will be the better option.
Regression analysis
Regression analysis is used to make decisions. That is the degree to which two closely linked independent data variables rely on one another. In terms of independent variables that differ from other fixed data. This method aims to create models using datasets to calculate the values of the dependent variables. Learning Python programming for Data Science from a reputed institution can help you to get placement quickly.
Predictive analytics
Predictive analytics uses statistical algorithms and historical data to predict what will happen in the future. This strategy can be a game-changer for companies seeking to predict client requirements, optimize resource allocation, and reduce risks. Predictive analytics can create strategies for customer retention, fraud detection, and demand forecasting in various industries, from finance to healthcare.
Machine Learning
Creating models that can make predictions and judgments based on data is the main goal of the artificial intelligence subfield of machine learning. Businesses can develop predictive models for customer churn prediction, sentiment analysis, and image identification by training algorithms on historical data. Different business processes can use machine learning models, automating decision-making and increasing effectiveness.
Jack knife Regression
This is a time-tested resampling method first described by Quenouille and afterwards given the name Tukey. Due to its strength and lack of parameters, it can be utilized as a black box. Furthermore, non-statisticians who predict the variance and bias of a large population can easily break this rule.

Lift analysis
Assume your boss has requested that you match a model to some data and send a report to him. Based on a model you had fitted and drawn specific conclusions. You now discover a group of individuals at your employment who have all included various models and arrived at various conclusions. You need evidence to back up your findings when your boss loses his head and fires you all.
Time series analysis
Time series analysis focuses on looking at data points gathered over time. This technique is essential for sectors like banking, industry, and healthcare, where historical data might offer insightful information. Businesses can make well-informed choices about inventory management, financial forecasting, and operational optimization by looking at past trends and patterns.
Decision tree
A decision tree is a diagram with a structure similar to a flowchart, where each node represents a test on an attribute and each branch a grade. The routes from the root to the leaf define the categorization rules. The predicted values of difficult options are measured using a decision tree and the closely related impact diagram as an analytical and visual decision support approach in decision analysis.
youtube
Bottom line
Finally, those mentioned above are about the Data Science techniques for actionable business insights. Data science approaches are effective tools for drawing useful insights from the enormous amounts of data currently available to enterprises. You may fully realize the potential of data science for useful business insights if you take the right approach and adopt data-driven insights.
#PythonDataScience#DataScienceInPython#DataScienceCertification#DataScienceCommunity#BigDataPython#Youtube
0 notes
Note
a kiss from someone the other didn’t think thought of them that way
Forsyth had never quite construed his relationship with Lukas as anything except a particularly close friendship; he would have to be blind not to notice the tension between the man and Python, but that's their business.
It's true, Lukas is easy on the eyes, but that's just an objective fact. From the faint freckles that dot his face when you look close enough, the handsome features that fill out his rounded face, and the well-built muscle on his sturdy frame, it's something anyone could notice. He does find his eyes wandering, sometimes, but it's easy to do around him.
When Python had left for the frontier, he'd found himself growing closer to Lukas. The two men had both held closer ties to Forsyth, but that didn't mean the two weren't friends. Indeed, he is proud to count the man among his closest comrades today; the time they have spent together during the war and at the capital alongside their natural inclinations have made that easy.
Forsyth has reconciled his feelings for Python, and he wonders if that's opened some sort of floodgates. Suddenly, it's easier to acknowledge not only his attraction to his partner, but for his desires to make themselves known in general.
Is it loneliness? Is it a substitution? It's unfair, for him to entertain these growing feelings of attraction to his dear ginger friend, even if he and Python had had conversations about the status of their relationship. Python would probably laugh out loud and tell him to go for it, after hearing the latest dream Lukas had starred in.
It just isn't proper. And it wouldn't be fair to Lukas, to introduce this complication. Forsyth isn't even sure of the depth of his feelings, just that a persistent crush has manifested itself about him. Maybe if he endures it, it will fade and he can return to an easier place in their relationship.
For now, though, they sit together going over paperwork in Lukas' personal quarters, and Forsyth is doing a very bad job of not looking at his lips as he discusses the latest in shipments of...something. Forsyth wasn't paying enough attention at the time. Argh, this will not do! It is so unfair to Lukas, for him to hold this yearning in his heart...
“…So two tons of fertilizer to a wagon, which would need to be drawn by two horses minimum. Swapping for fresh ones along the way will be an expensive challenge, but we’d save a lot of time if we can pull it off…” Lukas scratches calculations into the margins of a long-exhausted notebook, looking between the invoice and the initial notes he made a few months ago. Without the Mother to bless their crops, the farmers will be relying far more heavily on minerals and ash to help them grow, nevermind Rigel’s existing dependency on fertilizers. The king and queen are generous souls to offer the full extent of the crown’s meager capabilities… It's exactly why Lukas is proud to serve them, but he can’t help but wonder if they think of him as some kind of miracle worker…
An exhausted sigh escapes Lukas as he presses graphite-smudged fingers against his temples, muddling through his thoughts as he looks to Forsyth for some kind of insight…
…Ah. He’s zoning out, eyes locked in Lukas’ direction but not seeing anything in particular. They worked closely together in managing the Deliverance’s operations and supply lines, but that must be the furthest thing from Forsyth’s mind right now. Lukas hardly blames him.
…So would Forsyth blame him for taking advantage of his distraction? His fingers gently brush spring green hair to the side before Lukas leans in and steals a kiss from those lips. A long-repressed impulse, finally satisfied. Forsyth is always one to make his affections as plain as day. Lukas can only hope he makes the depths of his own fondness for the knight just as clear.
“Drifting off, are we? Don’t worry.” Lukas leans back with a soft chuckle. “We’ve been at this for a while, even I could use a break. Let’s have some tea.”
4 notes
·
View notes
Text
How did the Bitcoin mining change: from CPU to cloud mining
Hey, geeks! Today we’d like to dedicate an article to the origins and history of the most known and popular cryptocurrency — Bitcoin, also answering the question “What is, in fact, Bitcoin?”
We hope you’ll enjoy our small insight as we’ve made it as simple and informative as possible.
Everything started in 1983 when David Chaum and Stefan Brands proposed the very first protocols of “electronic cash”.
Several cryptocurrency concepts were introduced later, and even some market mechanism models were estimated. But only in 2008, the file with the description of the protocol and the working principle of Bitcoin P2P network were published.
The person or even a group of people behind it is still a mystery. The only thing we know about the creator is a pseudonym, Satoshi Nakamoto. In 2009 Satoshi had finished the dashboard, and the network was launched.
The first Bitcoin had been used for purchase in 2010 when Laszlo Hanyecz bought two slices of pizza for 10 000 Bitcoins. Just to remind you, today 1 Bitcoin’s price is about $5300 and the highest value can be over $5800 per 1 Bitcoin.
There are hundreds of other cryptocurrencies: Litecoin, Ethereum, Ripple, and even Dogecoin or Fedoracoin. But Bitcoin is the most widespread of all the cryptos. At the moment, thousands of restaurants and shops worldwide accept Bitcoin as a payment method.
The gold fever

Mining (or so to say Bitcoin production) is a process of solving a cryptographic task. The solution to the task is a symbol sequence found by enumeration. That’s the reason why it is so demanding for huge computation power.
The core of Bitcoin’s system safety is also mining. Basically, miners group Bitcoin transactions into blocks which are then hashed an unbelievable number of times to find one infrequent and eligible hash value. When such a value is found, the block gets “mined” and is put in a chain of previously mined blocks (the blockchain). The hashing itself isn’t useful and is only needed to raise the difficulty of finding the following appropriate hash value. This ensures that no one with unlimited resources could take control over the whole system. For each block mined, miners get a reward. Originally it was 50 Bitcoins per block, but to prevent the uncontrolled emission of the currency the reward drops twice after every 210 000 blocks mined. Each new block appears in about 10 minutes — which means a block can be mined in 9 as well as in 11 minutes. For the ease of calculation, we’ll make it 10 minutes. On that basis, the total number of Bitcoins should be no more than 21 million. About 55% of Bitcoins are already mined, and it is estimated that 99% of them will be mined in 2032.
At the moment, there are four generations of mining hardware (or miners) starting from simple CPU-miners and ending with next-gen ASIC-miners. It doesn’t ultimately mean that you can’t mine Bitcoins at home with your CPU — it just won’t be any profitable.
The first generation: CPU-mining

Profit depends on your processor — a top-class Core i7 would give you around 33 MH/s (mega hashes per second). All calculations are processed on 512-bit blocks of data and contain a lot of different operations. The result of each operation depends on the result of the previous one.
The second generation: GPU-mining

The next generation of miners was based on processes taking place in graphics cards. Such miners contained bitcoin-protocol realisation in Java or Python and an enumeration algorithm in the form of an OpenCL file which should have been compiled accordingly to the ISA of a related GPU.
Miners used different tactics to increase their profits. Some of them played with voltage: some increased it to increase the productivity, others lowered it to save on electricity. Some tried to modify GPU cores and code parameters to augment the flow.
Unlike CPU, which is always meant to stay single, several GPUs can be connected to a motherboard forming a rig. This allowed building first Bitcoin mining farms based on graphics processors.
Typical AMD GPUs demonstrate higher productivity than nVidia’s once we compare GH/s to $ values. That’s why AMD GPUs were and still are quite popular among miners.
The third generation: FPGA-mining

FPGA-mining did not bloom for long as It was quickly replaced by a new generation of hardware — ASIC. FPGA Spartan XC6SLX150 based circuit boards allowed to raise productivity to 860 MH/s with the frequency of 215 MHz, energy demand of 39W, and a price of $1060. Proprietary hardware developed by Butterfly Labs (BFL) from Kansas, US showed the similar productivity of 830 MH/s with $599 price tag. Their best solution was based on the FPGA Altera showing 25,2 GH/s at the cost of $15K (650–750 MH/s per chip).
The main issue of FPGA mining, when compared to GPU, was its cost. On average the cost of FPGA mining was 30% higher. Besides that, GPU boards have greater potential for further reselling once they’re not used for mining any longer.
The fourth generation: ASIC-mining

The coming of ASIC was the end of other types of mining. ASIC miners are significantly different in relation to size to productivity and energy consumption. BFL was the first company to appear on the market and was followed by ASICMINER and Avalon.
The fourth-generation miners were expensive. As the popularity of cryptocurrencies grew, the interest in mining also increased. Not everyone can afford a miner even in its minimal procurement. High hardware prices forced people to find other solutions like hardware downgrading or selling lighter versions of miners. But the price was still quite too high, and users had to deal with all the problems, settings, etc. Cloud mining quickly became an optimal solution opening the world of Bitcoin mining to pretty much everyone.
Cloud mining

Bitcoin mining would become popular only once it was available to every interested person. Cloud mining was exactly that kind of thing. Our project allows users to rent part of our mining hardware power and start earning Bitcoins in just a few clicks. Everything you need is a desire and a few bucks for a start.
After registration, you only need to choose the appropriate mining (be in Bitcoins, Litecoins or maybe Ethereum), connect your wallet and start gaining your first Bitcoins.
The calculator will show your estimated profit, and the graphs will allow you to follow the results in different pools.
You can arrange the rented power among the most preferred pools to maximise your profit. If you realize you need more power, it is always possible to buy more.
Right now, Phanes Technology operates on a whole range of different hardware, including all market’s top and flagman models.
Ready to start yourself? We’re here to help you! Let us know what you’d like to learn next.
#cloudmining#cloudminingwebsite#cloudminingwebsites#crypto#cryptocurrency#cryptocurrencies#cryptotrading#cryptonews#bitcoin#bitcoi
2 notes
·
View notes
Text
what’s up? i’m red (21+, he/she/they). it’s so lovely to meet all of you! i’ve brought hwang eunjung (22, she/her) into the group today. the most important thing to know about her is that she’s not interested in being polite or heterosexual!! also, she’s a politicians daughter, aspiring revolutionist, college senior and asmr youtuber. i know that’s a lot going on but i think it makes sense! you can find a complete profile here, background here plus a bunch of wanted connections here. below the cut is a tl;dr + some quick plot ideas. all the usual and since tumblr im is circling the drain you can also find me on twitter (@.lectracity) or disc.ord (@ AWCY?#8739) as well! thank you so much for taking the time to read this! i hope to talk to you soon!!!
Fun Facts
was very different until about 16? an embodiment of children should be seen and not heard with a lovely smile, exemplary behavior as well as a lot of internalized trauma
now she’s (trying to be) loud, pissed and determined to use every advantage given her to make a change for the good
kind of thinks her dad is Evil, agrees with many of his detractors and WILL put a stop to him, but also that’s still her family? so don’t talk shit about them if you aren’t prepared to get hit. it’s complicated!!
father wanted her to study business, but she openly defied him in a really big moment of personal growth to go into political science so she could one day try to improve things (and help right the wrongs he did yk)
drives a dark red suzuki katana
volunteers at women's shelters, animal shelters and is a major activist for lgbt+ rights
genuinely cares for people and believes everyone’s story deserves to be heard
also loves animals but especially more unusual ones? thus she has a massive terrarium decked out to the nines for sweetie her 3 year old ball python whom is quite possibly the most spoiled serpent in all the land
has been stealing her fathers personal belongings for a couple of years, selling them and donating the money to charity. he has yet to notice.
started out selling gifts from her parents first and it’s escalated
will for sure escalate some more so like keep an eye on your stuff
she gets an allowance from her mother which she supplements with money from her youtube channel to live independently of her father
despite the surface level chaos, eunjung is incredibly calculating and deliberate. if she’s got two different shoes on that was on purpose.
she’s desperate to distance herself from the perfect image she had growing up. really just wants to be her own person
acts quite goofy and angry, but just know that’s her trying her best!!!
sometimes still cringes when things get loud. absolutely hates that she has problems with that, but can rescind into herself in extreme situations
part of the reason she prefers hole in the wall to any clubs
Quick Start Ideas
They spot her struggling to climb over the fence to get into her house after her dad changed the security code so she’d call him.
Eunjung may have had a bit too much to drink and maybe they were kindly offering her some assistance home, (or maybe she was just in their way wtv it’s up to you) except she took it the incredibly wrong way and tried to hit them with a bottle.
They were minding their own business shopping at the galleria when they saw Eunjung running around with bags full of wigs and the most random assortment of stuff that begs to be checked out. But it only gets weirder from there.
During a stream, she was given an absolutely ridiculous donation and the name of the supporter is very familiar to her. Not aware that anyone in the neighborhood knew what she was doing, it sent her into a bit of a panic. They don’t have to be someone who typically watches her kind of videos and could 100% just be doing it to see her freak out!
All roughed up and clearly avoiding going home to angry parents, Eunjung spotted them leaning around the neighborhood and insisted they stay at her place for the night. She’s a master of sneaking in, so it wasn’t an issue.
Anything involving running down alleys together away from someone. I don’t care what kind of situation is involved, I just really want it okay.
13 notes
·
View notes
Text
How and with what to analyze the connections of cryptocurrency pairs?
Author: Evgenii Bodiagin
From author: Cooperation proposal for the supply of data
How to analyze the relationship of cryptocurrencies? What are the laws governing the movement of cryptocurrencies? What are the features in the movements of the crypt?

Content:
Introduction.
Is everything all right with your distribution?….
Extraction of data on cryptocurrencies. Active cryptopairs.
How is the crypto market moving? ...
A nonparametric tool for analyzing relationships between pairs of cryptocurrencies.
Conclusion.
Introduction
Not so long ago, our world was replenished with another phenomenon: cryptocurrencies. At first, they were treated as a tool that only geeks are interested in. Today it is obvious that the "crypt" is becoming a backbone. Its mysteriousness, frightening volatility attracts more and more people: from speculators to lovers of conspiracy theory. There is a natural desire to understand the movement of the crypt. The urge to organize and "put everything on the shelves" forces you to turn to data processing tools. Very often these tools are used not quite, to put it mildly, correctly.
For example, in the flow of information about cryptocurrency markets, a lot of attention is paid to the research of cryptocurrency connections. Which cryptocurrencies rise / fall at the same time (have the same movement vector)? AND…. on the contrary - which have the opposite direction. The answers to these questions can enrich the investor in the truest sense of the word. This task is a classic task of correlation analysis. It would seem ... we take the quotes of cryptocurrencies ... a package of spreadsheets. "Go" and done. But ... I remember a phrase from an advertisement: "not all yoghurts are equally useful."
The subtleties, as they say, are in the details. The fact is that the methods for calculating correlations are different. Spreadsheets use Pearson's correlation, although it is referred to simply as "correlation." But there is one but. Pearson's correlation is only possible if the data we are trying to analyze is normally distributed.
Is everything all right with your distribution?….
Let's remember what the normal distribution is. First there will be boring formulas, then an entertaining example. So, a one-dimensional random variable that corresponds to a normal distribution has the following probability density function:

Behind the eyes, it is also called the Gaussian function;) It has only two parameters. First: µ is the mathematical expectation (mean), median and distribution mode. Second parameter: σ - standard deviation (σ2 - variance) of the distribution. The probability density function has the following graphical representation:

In order to describe the normal distribution without formulas, consider, for example, the height of the people around us. Think of your friends, acquaintances, work colleagues. Are there many giants among them? Are there many people of extremely small stature among them? The most common value is likely to be "average height".
The normal distribution has another remarkable property. We measure three standard deviations down from the average height. We measure three standard deviations up from the average height. 99.73% of your subjects will be within this range. In other words, the lion's share of the sample is within the "three sigma" range.
Imagine now that we are in the fabulous Middle Ages. In addition to people, other creatures live on earth: giants, gnomes. Dragons hover in the sky. Elves lurk in the woods. Let's form a sample of the growth of fantastic creatures. As you can see, the histogram has heavy tails.

Why? It's simple - a meeting with a gnome or a giant is not so rare. The distribution of the height of the inhabitants of the fairy forest differs significantly from the normal one.
It is especially worth noting that if a random variable is affected by many random variables that are practically independent of each other, the behavior of such a random variable is described by a normal distribution. The normal distribution is fairly well understood. A lot of data processing techniques are based on it. The Pearson correlation, which requires normality, is only one in a thousand instruments. And here a fundamental question arises. What is the distribution of price changes in cryptocurrencies?
Mining data about cryptocurrencies. Active crypto pairs.
We will consider the Binance crypto exchange as a source of data on cryptocurrency pairs. We will use Python 3.7.7 as processing tools. We use libraries such as: scipy, numpy, pandas, plotly.
At the time of this writing, we have historical data on 600 cryptocurrency pairs. We will consider daily data. Data mining is done using the Binance API. The sample size is 90 days. The subject of consideration will be the following indicator:
Growth_rate_Close = Close temp day / Close last day
Those. if, for example, this ratio is 1.015, the closing price has increased by 1.5%. If the value, for example, is 0.98, then the price has dropped by 2%. Thus, we analyze not the absolute values of the closing prices of cryptocurrency pairs, but their gains.
Note that not all crypto pairs are actively traded. Let's select the most liquid ones. There are two criteria for activity - the number of transactions or the volume of trade. Let's choose the number of deals. So, if you sort all cryptocurrency pairs by the number of transactions, and display it on the chart, you get the following.

Let's take the 35 most actively traded cryptocurrencies. They are shown in red on the graph. All data on cryptocurrency pairs are displayed in blue. The graph shows that the most active part of cryptocurrencies is only 6% of the entire list of cryptocurrencies.
0,05833 = 35 / 600
Yes, that's a fact. These are the realities of the crypto market.
How is the crypto market moving? ...
What does the histogram of price increases for these most active 35 positions look like? How is the crypto market moving? Something like this:

Testing for compliance with the normal distribution is performed both by visual compliance with the normal distribution graph and by calculating statistics. How close is this picture to a normal distribution? Visually? Doubtful ...
Additionally, we will conduct the Shapiro - Wilk test. This test is used to determine whether a sample fits a normal distribution. The following results were obtained:

Only 10 out of 35 crypto pairs have p, which turned out to be higher than the alpha level of Shapiro - Wilk. This means that, technically, we cannot reject the hypothesis that the samples are normally distributed. Here's what the histogram of the 10 mentioned crypto pairs looks like:

To what extent does their appearance correspond to the normal distribution? Despite the significance of the Shapiro-Wilk statistic, it is highly doubtful. Thickened tails are visible on both the right and left. Let's remember about gnomes and giants;)
Cryptocurrency pairs do not live according to the laws of normal distribution! This fact has an important consequence. It is necessary to use such analysis tools that would be free of distribution type. We are talking about nonparametric statistics. And ... researching relationships is also possible there!
A nonparametric tool for analyzing relationships between cryptocurrency pairs
The nonparametric analogue of the Pearson coefficient is the Spearman coefficient. In general, its calculation refers to the methods of rank correlation. But ... rank correlation is applicable to real variables as well. Calculating the Spearman coefficient between cryptocurrency pairs in each case, we get two values: the coefficient itself, as well as the value p, which allows us to assess the significance level of the Spearman coefficient itself.
At the time of the research, we identified only 35 pairs of instruments where there is an interesting and statistically significant relationship. Why is the term interestingused here? Not strong ... not weak? Because the value of the correlation is not the only parameter that indicates how interesting the relationship is in terms of making a profit. You can read the research "Guide indicators in cryptocurrency trading or the Truman effect in action. Weak correlations are in the arsenal of a trader." at www.cryptosensors.info, which will tell you about the nuances of researching relationships.
The cryptocurrency market is volatile, but ... our monitoring software processing works with it. You can find out what relationships exist between cryptocurrency pairs at this time (we are not talking about the time of writing these lines; but about the time when you read these lines) at www.cryptosensors.info.
Conclusion
Cryptocurrency pairs do not behave according to the laws of normal distribution. When choosing a tool for analyzing cryptocurrency connections, you must use the right tool. Spearman's correlation coefficient can be used to analyze the crypto market, since it is a nonparametric criterion.
From author: Cooperation proposal for the supply of data
You may be interested in research / data:
Research: Guide Indicators in Cryptocurrency Trading or the Truman Effect in Action. Weak correlations are in the arsenal of a trader.
Research: Cryptocurrency quotes. Collection and processing. What should a trader know about?
Research: Candlestick analysis efficiency statistics for cryptocurrency trading. Patterns: bullish hammer, bearish hammer.
Data: Cryptopairs quotes in xlsx format.
Data: Comparable data for ten well-known cryptopairs.
Data: Exchange candlestick analysis. Evaluating the use and effectiveness of patterns. Patterns: Bull hammer Bear hammer.
Data: Search data for Truman zones ALMOST ALL (guide indicators for cryptocurrency pairs).
Data: Cryptopairs-relationships.
Send your questions and suggestions to [email protected]. We are open for cooperation!
#cryptocurreny trading#crypto market#how the crypto market moves#nonparametric analysis of cryptocurrencies#histogram#cryptocurrency distribution#cryptocurrency relationships#data processing
1 note
·
View note
Text
Acumen Wealth Advisors
net worth The Best Interest is a private weblog meant for leisure functions only. Yeah, Social Security actually has the potential to be a fantastic safety internet or addendum to your retirement funds.
Most individuals not at or close to retirement don’t realize Social Security has such a wide range of value relying in your work history. In my case I paid the max attainable quantity into Social Security for each one of many 35 years required to get the utmost profit.
That means my wife and I will obtain $66k after we begin taking it at age 70. That’s enough for a reasonably comfy retirement by itself.
In basic, methods that require above-average effort in order to get hold of ubiquitous objectives (e.g. to satisfy instructed net price thresholds for retirement) are bad methods. For instance, Philadelphia has an index of sixty two, which is 10% greater than 56.
If a Philly resident is using today’s knowledge for retirement planning, they should consider including 10% to all of the knowledge points. We’ve lined how inflation and earnings can have an effect on your interpretations of those outcomes.
While a $1 million internet price is commonly coveted in in style tradition, there's no "proper" quantity. Personal Finance Insider writes about merchandise, strategies, and ideas to help you make good selections along with your cash.
We might receive a small commission from our partners, like American Express, however our reporting and proposals are all the time impartial and goal.
We hear so much about “the one p.c” as a reference to wealth. But what does that imply, and who's included in that section? If we’re speaking about internet price, then the top one % means having a household net value of $10.35 million.
But we should also focus on how your price of dwelling can have an effect on these outcomes. In my opinion, sure it does make sense to do this comparison. But it’s only one knowledge point that you should use–not an end-all-be-all.
It’s identical to a young observe athlete evaluating their race instances to record holders. But it offers them a target, an understanding of the hole, a percentage distinction to record for later purposes.
Would you are feeling snug living off of $3160, $2500, or $2230 per 30 days? Let’s start by analyzing this information through the lens of the “4% Rule,” which states that you need to take your annual spending and save ~25x that a lot for retirement.
, and we’ll calculate your private web value — and a whole lot extra. This data may help you analyze your monetary wants. It is based on info and assumptions provided by you relating to your targets, expectations and monetary scenario.
A young couple may have the ability to avoid wasting cash–but then having children will put a dent in their financial savings rates. Next, the monetary aggregation web site The Balance follows an identical formula to Fidelity.
At specific ages, they say, your average internet value should aim for an ever-growing multiple of your salary. Also see our household income percentile calculator, income percentile calculator, and revenue percentile by age calculator.
Net worth is not the be-all and end-all when it comes to monetary health, however it can be a simple and priceless tool for tracking progress towards your monetary goals.
You’ll want to get an accurate image of what your own home is price right now, not what you paid or what you think it’s price. You can gauge market worth by comparing the true property to similar properties in the same neighborhood which have lately been offered or appraised .
These are belongings that are pretty subjective and up to you. But this wealth divide usually starts proper firstly of individuals’s careers, and sometimes by no means closes.
It’s there at age 30, age 40, age 50, age 60…ok, you get it. Total worth is a perform of how much cash is coming by way of the door—simply ask the Federal Reserve.
Wealthier school graduates don’t should battle that python. Without that student loan debt, their common net price will increase rapidly. Your first net price out of school is likely to be adverse.
Many folks wake up 10 years later and find their web worth hasn’t grown. Here, three of the subjective net value targets are all in household.
Fidelity and my Best Interest targets line up very carefully to one another, with the Balance falling 20-30% decrease. At retirement age, it’s about 1/4 to 1/6 of where it “should” be. net worth
1 note
·
View note
Text
HermitCraft Headcanons: Creeper Anatomy and Biology (Part 2!)
*slams this post on the table and gives you crazy eyes* I'M BACK WITH MORE
Anyway, rabidness aside, welcome everyone! Some of you might already know, but awhile ago I made a post for creepers and their anatomy (linked here). And today, my fellow peeps, I've decided to build onto my original post with more headcanons! But before we start, I want to say something that I feel is important;
I AM NOT A SCIENTIST.
I'm not qualified in any stretch of the imagination to confirm that these headcanons are 100% accurate. Please keep that in mind when you read this. I'm not a professional at all; I'm literally just a big HermitCraft nerd that will go on Internet splurges to quench my thirst for knowledge xD
Anyway, announcement over! Put on your labcoats and grab those calculators and clipboards, people, cuz we're about to dive into some nerdy friggin science! And feel absolutely free to debate about these or add onto them! I'd love to see people get involved with this kind of thing! :D Also, if you have any questions about these headcanons, or have any ideas for future headcanons to dive into, leave me an ask! :)
___________________________________
They still have the potential to explode
Although they cannot do it voluntary, like their monstrous ancestors, creepers still have the ability to detonate. They still have gunpowder in their bodies, but the amount is much less than what it used to be in hostile creepers (let's say about 10% of what it originally was, to keep it simple). I know there's not exactly any evidence proving that but just trust me, I'm going somewhere with this. Get your hands off of that keyboard! xD
Anyway, lemme tell you what I'm getting at. I bet a lot of you are familiar with what appendicitis is, but for people who don't know, here's the gist; appendicitis is when your appendix (an organ in the human body that's pretty much useless... nobody really knows what it does lol) becomes infected and inflamed, and if not given immediate medical attention, can possibly burst and become life-threatening. So, if there were an organ in a hostile creeper's body that stores gunpowder for self-detonation, that organ could carry onto the non-threatening generations (and possibly become smaller, due to its lack of use). If it were to become infected, inflamed, or receive some sort of trauma, it could possibly ignite all of the gunpowder and cause an explosion powerful enough to kill the creeper it resides in.
They shed their skin
All creatures with scales shed (or molt) their skin and scales periodically. I stated in my last post that creepers most likely have scales (due to their ability to conduct electricity [Like being struck by lightning]; if they had fur or humanlike skin, they'd most likely combust and explode... and nobody wants that to happen to them lol xD), so it would only be logical to have creepers shed their skin every now and then (I also got inspired by this one post by @goopyshell , so check them out! [btw, if you're reading this, I LOVE your Python design. Best snek boi!]). Lizards molt about 2 to 4 times a year, give or take some key factors (such as how much they're growing), but since that's a baseline, we're going to stick with that for simplicity's sake as to how often a full grown creeper would shed their scales. It'd also most likely come off in patches, instead of the whole skin at once, due to creepers having humanoid figures.
They see colors much differently than humans
Since creepers are very reptile like, especially with their scales, it would make sense that they have many other reptilian characteristics, including their vision. In my last post, I mentioned creepers having night vision due to their nocturnal ancestors, but then after I saw this awesome drawing by @bedrock-to-buildheight with how different Hermits see things, I decided to do some digging into how a reptile actually sees the world. Turns out in addition to having night vision, many of those scaly little critters have the ability to see not just the entire visible spectrum of light that a human can see, but also ultraviolet light (a wavelength of light that a human CAN'T see) due to a special type of cone photoreceptor in their eyes (just so you're not confused, a 'cone' is a type of photoreceptor [aka: light detector] in an eye that detects color). As a result, a creeper could (theoretically) be able to see a MUCH wider range of colors than a human can.
They're much shorter than humans
I've seen lots of designs of humanoid creepers (*cough* PYTHON IS A GREMLIN *cough cough*), and quite a few of have them being quite short. So I thought that I'd explore around the Minecraft Wiki a bit to see if there was anything to support that. And wouldn't you know it, there is! According to the game files, creepers are 1.7 blocks tall (or 1.7 meters, since 1 block in the game is equal to 1 cubic meter) compared to a player, who is 1.8 blocks tall.
Now, at first I thought that I was done, but then I realized that it wouldn't exactly make sense for every single human to be the same height, as well as creepers. Cuz if that were the case, how could we have a tall German cyborg or a smol ice queen in HermitCraft fandom lore and headcanons? xD So did two things; 1, I decided to have the creeper/player height be a ratio (in other words, I'll have the average height of creepers be about 95% of the average height of humans, since 1.7 meters [a creeper's height in the game] divided by 1.8 meters [a player's in-game height] would equal that percent. Maths people xD). And 2, I dove back into the depths of the Interbubs and did tons of research on human height, and eventually found the global average for male and female heights. For humans, males average out at about 171 centimeters tall (a little over 5 feet 7 inches), and females 159.5 centimeters (almost 5 feet 3 inches). If we apply our 95% to those numbers, we can get our average creeper heights! And those numbers calculate to have males be about 161.5 centimeters tall (about 5 feet 4 inches), and females at 150.6 centimeters (4 feet 11 inches).
#hermitcraft#hermitcraft headcanon#hermitcraft headcanons#science#python#pythonmc#pythongb#docm77#doc#creepers#creeper#minecraft
46 notes
·
View notes
Text
Made a network monitor today.
Few terms used for my non-programmer buddies who read this blog: Python: A programming language Tkinter: A GUI Library for Python that allows you to make interfaces. GUI: Graphical User Interface (all kinds of software you use normally have a GUI. It’s like the face of the program.)
I learned about Tkinter today, a GUI framework for Python 🐍. I've never looked into GUI programming in Python even though I'm fairly skilled in the language. 🖼
What’s a better way to learn something than by doing it, so I decided to give a proper user interface (non intractable and simple) to a program I made over an year ago using my newfound knowledge. 📚
Old UI: (Console Windows)

It's a network bandwidth monitor that tells you how much data you've consumed with your current internet connection and It's also a simple enough program to give an interface to as there’s no need for any buttons or other sorts of wizardry. There’s only text that keeps updating plus I already had the functionality part of the code written an year ago. So It was easy to program a UI for it.
New UI: (Tkinter Windows Native)

It did take some time to figure out how to handle two things at once, the GUI and an infinite loop that kept updating and calculating the internet usage. Because, if I did it normally then either the text won’t update or the GUI will freeze up. So I had to look into multi-threading (which is another thing I don’t really know much about in Python.). In the end, I decided to stick with an in-built method of Tkinter called ‘after’ which allows you to run a function (the text updating function in this case) after a certain time delay. This allowed me to do a somewhat hacky trick to repeatedly call the function using the same update function so that the text gets updated frequently (every 1 second) and the GUI stays fine without freezing up.
I was trying to figure out how to make a specific part of a label (text) bold so that I could put it like “Total Download: 0.0 MB” to save space.. But I realized it only later that there's no proper way to do it other than using some hacky method or using the Text widget. Since I didn't wanted to waste much time learning about the hacky ways to do it, I put content on multiple lines instead. It looks pretty nice so why not. 🦋
I then froze the python application using PyInstaller to turn into into an .exe(cutable) file. I’ll upload the download link later as I need to make sure it runs on all PCs and also there’s some code optimizations to do. I’ll also put the code up on my GitHub when I do that so that any of you folks who are interested could have a look at the code. 👨🏻💻
But it was nice to learn about GUI programming in Python. I’ve only used Python for console applications and automation purposes before so this is something new to me. It seems easy enough. Who knows, maybe I’ll convert all my console applications to applications with a proper interface. 😃
Thanks for reading!
3 notes
·
View notes
Text
Reenacted knowledge and Data Science

From a general perspective, information science proposes a field of study that utilizes the real strategy to oversee get a data into the given information. The smart improvement in this field of science has understood the progress of schools that have recognizable specific graduated class programs related with information science. In this article, we will find a few solutions concerning both the fields.
Rather than information science, AI is a lot of systems that permit PCs to pick choices subject to the given information. In like manner, these systems translate results that can perform much better without the need of programming rules.
Both AI and information science are acclaimed nowadays. Routinely, the two terms are utilized correspondingly, which isn't right. Regardless of the way that information science fuses AI, this field has a lot of various mechanical congregations.
Information Science Process
The presentation of cell phones and digitalization have conveyed immense proportions of information. In reality, the examination of information makes a connection between the two types of progress. With the blend of these parts, researchers can get an inexorably critical understanding into the information.
For information science practice, there is a requirement for a combo of limits and experience. Information researchers have colossal proportions of relationship with programming vernaculars, for example, Python and R. Moreover, they have an inconceivable information on database planning, quantifiable systems and different fields. Learn more machine learning training in hyderabad
What is Machine Learning?
PC based insight builds up a program or model through self-regulating testing of various courses of action. This is finished by testing these courses of action against the given information and perceive the best fit. Reproduced insight, obviously, is an exceptional reaction for manage work increased issues.
With these attributes, it can expand the estimation of the structure in various undertakings. For example, it can spare lives in spite of tackle issues in various segments, for example, PC security and therapeutic organizations. Besides, Google masterminds this improvement in their frameworks to remain before the limitation. You can encounter ML by making a crucial something in Google web crawler. The outcomes will amaze you.
Significance of ML
Today, every industry utilizes this turn of events. The explanation is that the machine calculations help decay costs with the assistance of power programs. Consequently, the use of these systems in various associations, for example, solution and using makes some moral concerns.
Since there are no unequivocal principles for AI frameworks, the social tendencies may not be clear. Google is trying to discover how to the neural structures in human characters think. Along these lines, this work is still in progress. After the examination has expanded wide ground, the outcomes can help address different great issues and information propensity.
ML is on the quick overview of different instruments that information experts use. For productive structures, you need a rehearsed fit who can revise the given information and utilize the correct instruments to abuse the numbers. Routinely, these experts take an information science course in Hyderabad to begin.
1 note
·
View note
Text
Spark vs Hadoop, which one is better?
Hadoop
Hadoop is a project of Apache.org and it is a software library and an action framework that allows the distributed processing of large data sets, known as big data, through thousands of conventional systems that offer power processing and storage space. Hadoop is, in essence, the most powerful design in the big data analytics space.
Several modules participate in the creation of its framework and among the main ones we find the following:
Hadoop Common (Utilities and libraries that support other Hadoop modules)
Hadoop Distributed File Systems (HDFS)
Hadoop YARN (Yet Another Resource Negociator), cluster management technology.
Hadoop Mapreduce (programming model that supports massive parallel computing)
Although the four modules mentioned above make up the central core of Hadoop, there are others. Among them, as quoted by Hess, are Ambari, Avro, Cassandra, Hive, Pig, Oozie, Flume, and Sqoop. All of them serve to extend and extend the power of Hadoop and be included in big data applications and processing of large data sets.
Many companies use Hadoop for their large data and analytics sets. It has become the de facto standard in big data applications. Hess notes that Hadoop was originally designed to handle crawling functions and search millions of web pages while collecting information from a database. The result of that desire to browse and search the Web ended up being Hadoop HDFS and its distributed processing engine, MapReduce.
According to Hess, Hadoop is useful for companies when the data sets are so large and so complex that the solutions they already have cannot process the information effectively and in what the business needs define as reasonable times.
MapReduce is an excellent word-processing engine, and that's because crawling and web search, its first challenges, are text-based tasks.
We hope you understand Hadoop Introduction tutorial for beginners. Get success in your career as a Tableau developer by being a part of the Prwatech, India’s leading hadoop training institute in btm layout.
Apache Spark Spark is also an open source project from the Apache foundation that was born in 2012 as an enhancement to Hadoop's Map Reduce paradigm . It has high-level programming abstractions and allows working with SQL language . Among its APIs it has two real-time data processing (Spark Streaming and Spark Structured Streaming), one to apply distributed Machine Learning (Spark MLlib) and another to work with graphs (Spark GraphX).
Although Spark also has its own resource manager (Standalone), it does not have as much maturity as Hadoop Yarn, so the main module that stands out from Spark is its distributed processing paradigm.
For this reason it does not make much sense to compare Spark vs Hadoop and it is more accurate to compare Spark with Hadoop Map Reduce since they both perform the same functions. Let's see the advantages and disadvantages of some of its features:
performance Apache Spark is up to 100 times faster than Map Reduce since it works in RAM memory (unlike Map Reduce that stores intermediate results on disk) thus greatly speeding up processing times.
In addition, the great advantage of Spark is that it has a scheduler called DAG that sets the tasks to be performed and optimizes the calculations .
Development complexity Map Reduce is mainly programmed in Java although it has compatibility with other languages . The programming in Map Reduce follows a specific methodology which means that it is necessary to model the problems according to this way of working.
Spark, on the other hand, is easier to program today thanks to the enormous effort of the community to improve this framework.
Spark is compatible with Java, Scala, Python and R which makes it a great tool not only for Data Engineers but also for Data Scientists to perform analysis on data .
Cost In terms of computational costs, Map Reduce requires a cluster that has more disks and is faster for processing. Spark, on the other hand, needs a cluster that has a lot of RAM.
We hope you understand Apache Introduction tutorial for beginners. Get success in your career as a Tableau developer by being a part of the Prwatech, India’s leading apache spark training institute in Bangalore.
1 note
·
View note