#how to tabulate data in python
Explore tagged Tumblr posts
Visit Tumblr Blog
Explore Tumblr blogs with no restrictions, modern design and the best experience.
Last Seen Tumblr Blogs


Fun Fact
Tumblr was the first site to host the blog for President Barack Obama in 2011.
Text
Learn The Art Of How To Tabulate Data in Python: Tips And Tricks
Summary: Master how to tabulate data in Python using essential libraries like Pandas and NumPy. This guide covers basic and advanced techniques, including handling missing data, multi-indexing, and creating pivot tables, enabling efficient Data Analysis and insightful decision-making.

Introduction
In Data Analysis, mastering how to tabulate data in Python is akin to wielding a powerful tool for extracting insights. This article offers a concise yet comprehensive overview of this essential skill. Analysts and Data Scientists can efficiently organise and structure raw information by tabulating data, paving the way for deeper analysis and visualisation.
Understanding the significance of tabulation lays the foundation for effective decision-making, enabling professionals to uncover patterns, trends, and correlations within datasets. Join us as we delve into the intricacies of data tabulation in Python, unlocking its potential for informed insights and impactful outcomes.
Getting Started with Data Tabulation Using Python
Tabulating data is a fundamental aspect of Data Analysis and is crucial in deriving insights and making informed decisions. With Python, a versatile and powerful programming language, you can efficiently tabulate data from various sources and formats.
Whether working with small-scale datasets or handling large volumes of information, Python offers robust tools and libraries to streamline the tabulation process. Understanding the basics is essential when tabulating data using Python. In this section, we'll delve into the foundational concepts of data tabulation and explore how Python facilitates this task.
Basic Data Structures for Tabulation
Before diving into data tabulation techniques, it's crucial to grasp the basic data structures commonly used in Python. These data structures are the building blocks for effectively organising and manipulating data. The primary data structures for tabulation include lists, dictionaries, and data frames.
Lists: Lists are versatile data structures in Python that allow you to store and manipulate sequences of elements. They can contain heterogeneous data types and are particularly useful for tabulating small-scale datasets.
Dictionaries: Dictionaries are collections of key-value pairs that enable efficient data storage and retrieval. They provide a convenient way to organise tabulated data, especially when dealing with structured information.
DataFrames: These are a central data structure in libraries like Pandas, offering a tabular data format similar to a spreadsheet or database table. DataFrames provide potent tools for tabulating and analysing data, making them a preferred choice for many Data Scientists and analysts.
Overview of Popular Python Libraries for Data Tabulation
Python boasts a rich ecosystem of libraries specifically designed for data manipulation and analysis. Two popular libraries for data tabulation are Pandas and NumPy.
Pandas: It is a versatile and user-friendly library that provides high-performance data structures and analysis tools. Pandas offers a DataFrame object and a wide range of functions for reading, writing, and manipulating tabulated data efficiently.
NumPy: It is a fundamental library for Python numerical computing. It provides support for large, multidimensional arrays and matrices. While not explicitly designed for tabulation, NumPy’s array-based operations are often used for data manipulation tasks with other libraries.
By familiarising yourself with these basic data structures and popular Python libraries, you'll be well-equipped to embark on your journey into data tabulation using Python.
Tabulating Data with Pandas
Pandas is a powerful Python library widely used for data manipulation and analysis. This section will delve into the fundamentals of tabulating data with Pandas, covering everything from installation to advanced operations.
Installing and Importing Pandas
Before tabulating data with Pandas, you must install the library on your system. Installation is typically straightforward using Python's package manager, pip. Open your command-line interface and execute the following command:

Once Pandas is installed, you can import it into your Python scripts or notebooks using the `import` statement:
Reading Data into Pandas DataFrame
Pandas provide various functions for reading data from different file formats such as CSV, Excel, SQL databases, etc. One of the most commonly used functions is `pd.read_csv()` for reading data from a CSV file into a Pandas DataFrame:
You can replace `'data.csv'` with the path to your CSV file. Pandas automatically detect the delimiter and other parameters to load the data correctly.
Basic DataFrame Operations for Tabulation
Once your data is loaded into a data frame, you can perform various operations to tabulate and manipulate it. Some basic operations include:
Selecting Data: Use square brackets `[]` or the `.loc[]` and `.iloc[]` accessors to select specific rows and columns.
Filtering Data: Apply conditional statements to filter rows based on specific criteria using boolean indexing.
Sorting Data: Use the `.sort_values()` method to sort the DataFrame by one or more columns.
Grouping and Aggregating Data with Pandas
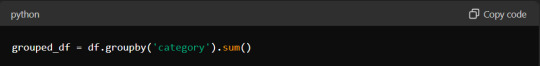
Grouping and aggregating data are essential techniques for summarising and analysing datasets. Pandas provides the `.groupby()` method for grouping data based on one or more columns. After grouping, you can apply aggregation functions such as `sum()`, `mean()`, `count()`, etc., to calculate statistics for each group.
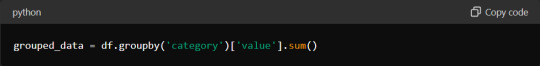
This code groups the DataFrame `df` by the 'category' column. It calculates the sum of the 'value' column for each group.
Mastering these basic operations with Pandas is crucial for efficient data tabulation and analysis in Python.
Advanced Techniques for Data Tabulation
Mastering data tabulation involves more than just basic operations. Advanced techniques can significantly enhance your data manipulation and analysis capabilities. This section explores how to handle missing data, perform multi-indexing, create pivot tables, and combine datasets for comprehensive tabulation.
Handling Missing Data in Tabulated Datasets
Missing data is a common issue in real-world datasets, and how you handle it can significantly affect your analysis. Python's Pandas library provides robust methods to manage missing data effectively.
First, identify missing data using the `isnull()` function, which helps locate NaNs in your DataFrame. You can then decide whether to remove or impute these values. Use `dropna()` to eliminate rows or columns with missing data. This method is straightforward but might lead to a significant data loss.
Alternatively, the `fillna()` method can fill missing values. This function allows you to replace NaNs with specific values, such as the mean and median, or a technique such as forward-fill or backward-fill. Choosing the right strategy depends on your dataset and analysis goals.
Performing Multi-Indexing and Hierarchical Tabulation
Multi-indexing, or hierarchical indexing, enables you to work with higher-dimensional data in a structured way. This technique is invaluable for managing complex datasets containing multiple information levels.
In Pandas, create a multi-index DataFrame by passing a list of arrays to the `set_index()` method. This approach allows you to perform operations across multiple levels. For instance, you can aggregate data at different levels using the `groupby()` function. Multi-indexing enhances your ability to navigate and analyse data hierarchically, making it easier to extract meaningful insights.
Pivot Tables for Advanced Data Analysis
Pivot tables are potent tools for summarising and reshaping data, making them ideal for advanced Data Analysis. You can create pivot tables in Python using Pandas `pivot_table()` function.
A pivot table lets you group data by one or more keys while applying an aggregate function, such as sum, mean, or count. This functionality simplifies data comparison and trend identification across different dimensions. By specifying parameters like `index`, `columns`, and `values`, you can customise the table to suit your analysis needs.
Combining and Merging Datasets for Comprehensive Tabulation
Combining and merging datasets is essential when dealing with fragmented data sources. Pandas provides several functions to facilitate this process, including `concat()`, `merge()`, and `join()`.
Use `concat()` to append or stack DataFrames vertically or horizontally. This function helps add new data to an existing dataset. Like SQL joins, the `merge()` function combines datasets based on standard columns or indices. This method is perfect for integrating related data from different sources. The `join()` function offers a more straightforward way to merge datasets on their indices, simplifying the combination process.
These advanced techniques can enhance your data tabulation skills, leading to more efficient and insightful Data Analysis.
Tips and Tricks for Efficient Data Tabulation
Efficient data tabulation in Python saves time and enhances the quality of your Data Analysis. Here, we'll delve into some essential tips and tricks to optimise your data tabulation process.
Utilising Vectorised Operations for Faster Tabulation
Vectorised operations in Python, particularly with libraries like Pandas and NumPy, can significantly speed up data tabulation. These operations allow you to perform computations on entire arrays or DataFrames without explicit loops.
You can leverage the underlying C and Fortran code in these libraries using vectorised operations, much faster than Python's native loops. For instance, consider adding two columns in a DataFrame. Instead of using a loop to iterate through each row, you can simply use:

This one-liner makes your code more concise and drastically reduces execution time. Embrace vectorisation whenever possible to maximise efficiency.
Optimising Memory Usage When Working with Large Datasets
Large datasets can quickly consume your system's memory, leading to slower performance or crashes. Optimising memory usage is crucial for efficient data tabulation.
One effective approach is to use appropriate data types for your columns. For instance, if you have a column of integers that only contains values from 0 to 255, using the `int8` data type instead of the default `int64` can save substantial memory. Here's how you can optimise a DataFrame:

Additionally, consider using chunking techniques when reading large files. Instead of loading the entire dataset at once, process it in smaller chunks:
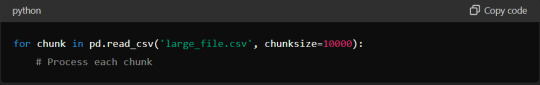
This method ensures you never exceed your memory capacity, maintaining efficient data processing.
Customising Tabulated Output for Readability and Presentation
Presenting your tabulated data is as important as the analysis itself. Customising the output can enhance readability and make your insights more accessible.
Start by formatting your DataFrame using Pandas' built-in styling functions. You can highlight important data points, format numbers, and even create colour gradients. For example:

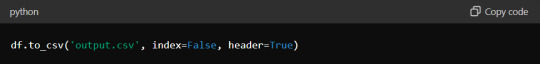
Additionally, when exporting data to formats like CSV or Excel, ensure that headers and index columns are appropriately labelled. Use the `to_csv` and `to_excel` methods with options for customisation:
These small adjustments can significantly improve the presentation quality of your tabulated data.
Leveraging Built-in Functions and Methods for Streamlined Tabulation
Python libraries offer many built-in functions and methods that simplify and expedite the tabulation process. Pandas, in particular, provide powerful tools for data manipulation.
For instance, the `groupby` method allows you to group data by specific columns and perform aggregate functions such as sum, mean, or count:
Similarly, the `pivot_table` method lets you create pivot tables, which are invaluable for summarising and analysing large datasets.
Mastering these built-in functions can streamline your data tabulation workflow, making it faster and more effective.
Incorporating these tips and tricks into your data tabulation process will enhance efficiency, optimise resource usage, and improve the clarity of your presented data, ultimately leading to more insightful and actionable analysis.
Read More:
Data Abstraction and Encapsulation in Python Explained.
Anaconda vs Python: Unveiling the differences.
Frequently Asked Questions
What Are The Basic Data Structures For Tabulating Data In Python?
Lists, dictionaries, and DataFrames are the primary data structures for tabulating data in Python. Lists store sequences of elements, dictionaries manage key-value pairs, and DataFrames, available in the Pandas library, offer a tabular format for efficient Data Analysis.
How Do You Handle Missing Data In Tabulated Datasets Using Python?
To manage missing data in Python, use Pandas' `isnull()` to identify NaNs. Then, use `dropna()` to remove them or `fillna()` to replace them with appropriate values like the mean or median, ensuring data integrity.
What Are Some Advanced Techniques For Data Tabulation In Python?
Advanced tabulation techniques in Python include handling missing data, performing multi-indexing for hierarchical data, creating pivot tables for summarisation, and combining datasets using functions like `concat()`, `merge()`, and `join()` for comprehensive Data Analysis.
Conclusion
Mastering how to tabulate data in Python is essential for Data Analysts and scientists. Professionals can efficiently organise, manipulate, and analyse data by understanding and utilising Python's powerful libraries, such as Pandas and NumPy.
Techniques like handling missing data, multi-indexing, and creating pivot tables enhance the depth of analysis. Efficient data tabulation saves time and optimises memory usage, leading to more insightful and actionable outcomes. Embracing these skills will significantly improve data-driven decision-making processes.
0 notes
Text
"Advanced SAS Techniques: Unlocking the Power of Data Analytics"
Unlocking the power of data analytics with advanced SAS techniques can significantly enhance your analytical capabilities. Here’s how to harness these techniques effectively:
Complex Data Manipulation: Use SAS procedures like PROC SQL and DATA STEP to perform intricate data transformations, merges, and aggregations, allowing you to handle large and complex datasets efficiently.
Advanced Statistical Analysis: Leverage SAS’s robust statistical procedures such as PROC REG for regression analysis, PROC ANOVA for analysis of variance, and PROC LOGISTIC for logistic regression to uncover deep insights and patterns in your data.
Predictive Modelling: Implement predictive modelling techniques using PROC HPFOREST or PROC HPLOGISTIC to develop and validate models that can forecast future trends and behaviours based on historical data.
Custom Reporting: Create customized and dynamic reports with PROC REPORT and PROC TABULATE to present data in meaningful ways that facilitate decision-making.
Automation and Efficiency: Utilize SAS macros to automate repetitive tasks and enhance the efficiency of your data processing and analysis workflows.
Mastering these advanced techniques enables you to unlock the full potential of SAS for sophisticated data analytics and drive impactful business decisions.SAS Online Training Institute, Power BI, Python Pune, India (saspowerbisasonlinetraininginstitute.in)
#sas training institute#sas course online#top sas training institute india#top sas training institute pune
0 notes
Text
Career Opportunity at Icon Plc Icon Plc is currently seeking a skilled Clinical Data Programmer (DMW) to join our dynamic team in Bangalore. If you have a passion for clinical data management and are looking to enhance your career with a global leader in clinical research, this is your opportunity. Job Overview Position: Clinical Data Programmer (DMW) Location: Bangalore, India Experience: 3-5 Years in the pharmaceutical industry with at least 2 years in clinical data management Qualification: M.Sc/B.Sc in Life Science, IT, or related field Key Responsibilities As a Clinical Data Programmer at Icon Plc, your primary responsibilities will include: Design and set-up of study database for data collection in clinical trials based on protocol needs Set up of models and performing transformation updates in DMW Mapping of metadata and clinical data from source system(s) to DMW (Data Management Workbench)/ CDW (Clinical Data Warehouse) and generate SDTM (Study Data Tabulation Model) deliverables. Active participation in sharing better practices on use of standards in alignment with Lead Clinical Data Programmer and Process & Automation Specialist. Maintain system related documentation. Facilitate implementation of business processes introduced by the systems supported by DaMaSys (Data Management Systems & Standards). Ensure testing is performed and database meets specification requirements before deployed into production and document pass and fail scenarios in a timely manner. Design, Programming and validate programs to check data accuracy and aid report generation [caption id="attachment_81522" align="aligncenter" width="1200"] Icon Plc Hiring Clinical Data Programmer (DMW) in Bangalore[/caption] Required Skills and Experience Icon Plc is looking for candidates who meet the following criteria: Minimum 3-5 years of experience in pharmaceutical industry and preferably 2years within clinical data management and hands on experience in CDASH, CDISC requirements. Good experience on end-to-end clinical data management activities. Good knowledge of clinical systems and preferable experience in programming languages (eg: SAS/SQL/R/Python, Jupyter etc). Requires basic knowledge on AI & ML to be part automation/innovation initiatives within and across thedepartments. Knowledge with analysis and design of business processes within the area of drug development. Experience with collaboration across professional and regional borders. Good project management experience. Profound knowledge of GxP and guidelines within drug development. Fluency in written/spoken English and good presentation skills Team oriented personality with a high degree of flexibility Quality mind-set and strong analytical skills. Educational Requirements Candidates should possess: Degree: M.Sc/B.Sc in Life Science, IT, clinical information management, or a comparable field. How to Apply Interested candidates can apply through LinkedIn by visiting this link.
0 notes
Text
ComProg History YOU SHOULD KNOW!!!


1843 Ada Lovelace is credited as being the first person to describe or write a computer program.
In 1843, she described an algorithm to compute Bernoulli numbers using the Analytical Engine.
1889 The Hollerith tabulating machine was invented by Herman Hollerith in 1889, allowing for data to be programmatically counted and tabulated.
1956 One of the first programming languages, FORTRAN, was introduced to the public on October 15, 1956. It was developed by John Backus and others at IBM.
1958 The second-oldest programming language, LISP was developed by John McCarthy and was first used in 1958.
1959 COBOL started being developed in 1959 by Grace Hopper and Bob Bemer.
1964 The original BASIC programming language was developed by John Kemeny, Mary Keller, and Thomas Kurtz, and was introduced to the public on May 1, 1964.
1965 Simula is considered the first ever object-oriented programming language, developed around 1965 by Ole-Johan Dahl and Kristen Nygaard.
1966 Martin Richards developed the BCPL programming language in 1966, which became popular due to its portability.
1966 The MUMPS programming language was developed by Neil Pappalardo at Massachusetts General Hospital in 1966.
1967 Known for its graphics capabilities, Logo was created by Seymour Paper in 1967.
1971 Pascal was developed in 1971 by Niklaus Wirth.
1972 Dennis Ritchie and Brian Kernighan developed the C programming language at Bell Labs in 1972.
1972 The Prolog programming language was developed by Alain Colmerauer and colleagues in 1972 at the University of Marseilles.
1972 Smalltalk was the second ever object-oriented programming language and the first true IDE, developed by Alan Kay and others at Xerox PARC in 1972.
1974 SQL is a database programming language and was developed by Edgar Codd in 1974 and is still important in the programming language world.
1975 A variation of LISP, the Scheme programming language was created in 1975 by Guy Steele and Gerry Sussman at MIT's Artificial Intelligence lab.
1975 The Altair BASIC programming language was developed by Bill Gates, Paul Allen, and Monte Davidoff, and was made available for use on January 2, 1975. It was used to create programs for Altair computers.
1979 Development of the C++ programming language was started in 1979 by Bjarne Stroustrup. Originally called "C with classes," C++ is one of the most widelyused programming languages.
1979 Oracle released the first commercial version of SQL in 1979.
1979 The Department of Defense developed the Ada programming language, originally named DoD-1, and named it after Ada Lovelace in May 1979.
1984 FoxPro is a programming language for developing database applications and was released by Fox Software in 1984.
1984 Cleve Moler started developing the MATLAB programming language in the late 1970s, and it was released to the public, with the MATLAB software package, in 1984.
1987 The open source programming language Perl that was developed by Larry Wall was introduced in 1987. It is commonly used in creating CGI scripts and programming web applications.
1988 Developed in the mid-1980s by Brad Cox and Tom Love, the Objective-C programming language was officially licensed by NeXT in 1988.
1990 Tim Berners-Lee developed the HTML markup language in 1990. HTML is one of the most popular and widely-used programming languages in the world.
1990 Haskell, a general-purpose programming language, was introduced in 1990.
1990 Engineers at Apple developed the Dylan programming language in the early 1990s. Dylan was designed to resemble the syntax of the ALGOL programming language.
1991 Development of Python was started in 1989 by Guido van Rossum and released to the public in 1991.
1991 Visual Basic was developed by Alan Cooper and released in May 1991.
1993 Lua was created in 1993 by engineers at the Pontifical Catholic University of Rio De Janeiro, Brazil.
1993 R is a programming language created by Robert Gentleman and Ross Ihaka and introduced in 1993.
1994 The concept of CSS was started by Håkon Wium Lie in 1994. W3C introduced the specification for CSS in 1996.
1995 Java was developed by James Gosling and other developers at Sun Microsystems, and was first introduced to the public in 1995.
1995 The object-oriented programming language Ruby developed by Yukihiro Matsumoto was first released in 1995.
1995 The experimental, multi-paradigm Curry programming language was introduced by Michael Hanus, Herbert Kuchen, and Juan Jose Moreno-Navarro in 1995.
1995 Racket is a general purpose programming language developed by Matthias Felleisen in 1995.
1995 A server-side interpreted scripting language, PHP was developed by Rasmus Lerdorf starting in 1994 and released on June 8, 1995.
1995 Originally named LiveScript when released in November 1995, JavaScript was developed by Brendan Eich and renamed as such in December 1995.
1996 Introduced in 1996, OCaml is an object-oriented version of the Caml programming language.
1998 XML is a markup language, with the specification for XML being developed by W3C and recommended on February 10, 1998.
1999 Development of the D programming language started in December 1999. D is a higher level language compared to C++.
2000 Based on C++ and Java, the C# programming language was developed by Microsoft and introduced in June 2000. C# became an ISO standard in 2003.
2003 The object-oriented programming language Scala was introduced in 2003.
2005 Don Syme developed the F# programming language and Microsoft first introduced it in 2005.
2007 The Go programming language was developed at Google starting in 2007. It was completed and introduced to the public in 2009.
2007 Rich Hickey developed the Clojure programming language and released the first version in 2007.
2008 Introduced in 2008, Nim is a programming language used to develop software requiring strict limits on how system memory is used.
2008 The object-oriented programming language Reia was introduced in 2008.
2010 The multi-paradigm CoffeeScript programming language, capable of being compiled into JavaScript, was officially released in 2010.
2011 Google developed the open source web-based Dart programming language, introducing it to the public in October 2011.
2012 Julia was developed by Jeff Bezanson, Alan Edelman, Stefan Karpinski, and Viral B. Shah and released in 2012. It is a high-level programming language used for scientific computing.
2014 Babel is a general-purpose programming language developed in 2014 and used to create programs for conserving battery life and system resources on devices.
2014 Created by Apple and released on June 2, 2014, the Swift programming language helps create programs and apps for iOS, macOS, the Apple Watch, and AppleTV.
2015 Graydon Hoare started development of the Rust programming language around 2010. After contributions from hundreds of people, it was officially released as version 1.0.0 alpha by Mozilla research on January 9, 2015.
#programming#programmer humor#now i know#now i want to cry#now i want more#ada lovelace#html css#html5 css3#html help#html code#programming history#history#codes#coding#debugging#historic preservation
7 notes
·
View notes
Text
Online Python Assignment Helpers
Design parsing methods to extract information from web pages and answer the following questions:
a) Assuming that you live in Toa Payoh town and owns a car. Hence, you are interested to find out what how many carparks are there available in Toa Payoh. Using the data information available, construct a Python program to count the total number of carparks in “Toa Payoh” and the total number of car parks decks available.
b) Assuming that you are driving home to Toa Payoh and hence you are interested to know which of the car parks will provide you the highest chance to getting a lot. Construct another Python program that enable you to check and display in real-time what is the availability of the carparks in Toa Payoh.
c) Based on the results in (a) and (b), how can you improve your program(s) and tabulate your chances of getting a lot in Toa Payoh. You should rank it from highest to lowest chance.
Solution:-
Introduction:
The main aim of this project is to develop a real time avaibility of Singapore's carpark information which can be implemented in Jupyter Python Notebook. The the MySQL database is designed using AWS on the RDS data services. Thus, the analysis of a real time car details will be investigated.Read More
https://www.allhomeworkassignments.com/programming-subjects/python-assignment-help.html Identifies Features That Make Python Unique
With significant measurement in TIOBE programming community index, Python is ranked among the top eight programming languages
It is counted as the third most popular language whose grammatical syntax is not based on the conventional C++, C# and JAVA programming language. Python is highly influenced by C programming language and hence the statement syntax and expressions in C helps the programmer to transit between the two languages. On evaluating the empirical study, Python (scripting languages) are considered to be more productive than C and Java (conventional language).
Students seeking Python programming assignment help, connect https://www.allhomeworkassignments.com/programming-subjects/python-assignment-help.html.
3 notes
·
View notes
Text
Week 1 Assignment – Running an Analysis of variance (ANOVA)
Objective:
The assignment of the week deals with Analysis of variance. Given a dataset some form of Statistical Analysis test to be performed to check and evaluate its Statistical significance.
Before getting into the crux of the problem let us understand some of the important concepts
Hypothesis testing - It is one of the most important Inferential Statistics where the hypothesis is performed on the sample data from a larger population. Hypothesis testing is a statistical assumption taken by an analyst on the nature of the data and its reason for analysis. In other words, Statistical Hypothesis testing assesses evidence provided by data in favour of or against each hypothesis about the problem.
There are two types of Hypothesis
Null Hypothesis – The null hypothesis is assumed to be true until evidence indicate otherwise. The general assumptions made on the data (people with depression are more likely to smoke)
Alternate Hypothesis – Once stronger evidences are made, one can reject Null hypothesis and accept Alternate hypothesis (One needs to come with strong evidence to challenge the null hypothesis and draw proper conclusions).In this case one needs to show evidences such that there is no relation between people smoking and their depression levels
Example:
The Null hypothesis is that the number of cigarettes smoked by the person is dependent on the person’s depression level. Based on the p-value we make conclusions either to accept the null hypothesis or fail to accept the null hypothesis(accept alternative hypothesis)
Steps involved in Hypothesis testing:
1. Choose the Null hypothesis (H0 ) and alternate hypothesis (Ha)
2. Choose the sample
3. Assess the evidence
4. Draw the conclusions
The Null hypothesis is accepted/rejected based on the p-value significance level of test
If p<= 0.05, then reject the null hypothesis (accept the alternate hypothesis)
If p > 0.05 null hypothesis is accepted
Wrongly rejecting the null hypothesis leads to type one error
Sampling variability:
The measures of the sample (subset of population) varying from the measures of the population is called Sampling variability. In other words sample results changing from sample to sample.
Central Limit theorem:
As long as adequately large samples and an adequately large number of samples are used from a population,the distribution of the statistics of the sample will be normally distributed. In other words, the more the sample the accurate it is to the population parameters.
Choosing Statistical test:
Please find the below tabulation to identify what test can be done at a given condition. Some of the statistical tools used for this are
Chi-square test of independence, ANOVA- Analysis of variance, correlation coefficient.
Explanatory variables are input or independent variable And response variable is the output variable or dependent variable.
Explanatory Response Type of test
Categorical Categorical Chi-square test
Quantitative Quantitative Pearson correlation
Categorical Quantitative ANOVA
Quantitative Categorical Chi-square test
ANOVA:
Anova F test, helps to identify, Are the difference among the sample means due to true difference among the population or merely due to sampling variability.
F = variation among sample means / by variations within groups
Let’s implement our learning in python.
The Null hypothesis here is smoking and depression levels are unrelated
The Alternate hypothesis is smoking and depression levels are related.
# importing required libraries
import numpy as np
import pandas as pd
import statsmodels.formula.api as smf
data = pd.read_csv("my_data...nesarc.csv",low_memory=False)
#setting variables you will be working with to numeric
data['S3AQ3B1'] = data['S3AQ3B1'].convert_objects(convert_numeric=True)
#data['S3AQ3B1'] = pd.to_numeric(data.S3AQ3B1)
data['S3AQ3C1'] = data['S3AQ3C1'].convert_objects(convert_numeric=True)
#data['S3AQ3C1'] = pd.to_numeric(data.S3AQ3C1)
data['CHECK321'] = data['CHECK321'].convert_objects(convert_numeric=True)
#data['CHECK321'] = pd.to_numeric(data.CHECK321)
#subset data to young adults age 18 to 25 who have smoked in the past 12 months
sub1=data[(data['AGE']>=18) & (data['AGE']<=25) & (data['CHECK321']==1)]
#SETTING MISSING DATA
sub1['S3AQ3B1']=sub1['S3AQ3B1'].replace(9, np.nan)
sub1['S3AQ3C1']=sub1['S3AQ3C1'].replace(99, np.nan)
#recoding number of days smoked in the past month
recode1 = {1: 30, 2: 22, 3: 14, 4: 5, 5: 2.5, 6: 1}
sub1['USFREQMO']= sub1['S3AQ3B1'].map(recode1)
#converting new variable USFREQMMO to numeric
sub1['USFREQMO']= sub1['USFREQMO'].convert_objects(convert_numeric=True)
# Creating a secondary variable multiplying the days smoked/month and the number of cig/per day
sub1['NUMCIGMO_EST']=sub1['USFREQMO'] * sub1['S3AQ3C1']
sub1['NUMCIGMO_EST']= sub1['NUMCIGMO_EST'].convert_objects(convert_numeric=True)
ct1 = sub1.groupby('NUMCIGMO_EST').size()
print (ct1)
print(sub1['MAJORDEPLIFE'])
# using ols function for calculating the F-statistic and associated p value
The ols is the ordinary least square function takes the response variable NUMCIGMO_EST and its explanatory variable MAJORDEPLIFE, C is indicated to specify that it’s a categorical variable.
model1 = smf.ols(formula='NUMCIGMO_EST ~ C(MAJORDEPLIFE)', data=sub1)
results1 = model1.fit()
print (results1.summary())
Inference – Since the p value is greater than 0.05, we accept the null hypothesis that the sample means are statistically equal. And there is no association between depression levels and cigarette smoked.
sub2 = sub1[['NUMCIGMO_EST', 'MAJORDEPLIFE']].dropna()
print ('means for numcigmo_est by major depression status')
m1= sub2.groupby('MAJORDEPLIFE').mean()
print (m1)
print ('standard deviations for numcigmo_est by major depression status')
sd1 = sub2.groupby('MAJORDEPLIFE').std()
print (sd1)
Since the null hypothesis is true we conclude that the sample mean and standard deviation of the two samples are statistically equal. From the sample statistics we infer that the depression levels and smoking are unrelated to each other
Till now, we ran the ANOVA test for two levels of the categorical variable(MAJORDEPLIFE, 0,1) Lets now look at the categorical variable(ETHRACE2A,White, Black, American Indian, Asian native and Latino) having five levels and see how the differences in the mean are captured.
The problem here is, The F-statistic and ‘p’ value does not provide any insight as to why the null hypothesis is rejected when there are multiple levels in categorical Explanatory variable.
The significant ANOVA does not tell which groups are different from the others. To determine this we would need to perform post-hoc test for ANOVA
Why Post-hoc tests for ANOVA?
Post hoc test known as after analysis test, This is performed to prevent excessive Type one error. Not implementing this leads to family wise error rate, given by the formula
FWE = 1 – (1 – αIT)C
Where:
αIT = alpha level for an individual test (e.g. .05),
c = Number of comparisons.
Post-hoc tests are designed to evaluate the difference between the pair of means while protecting against inflation of type one error.
Let’s continue the code to perform post-hoc test.
# Importing the library
Import statsmodels.stats.multicomp as multi
# adding the variable of interest to a separate data frame
sub3 = sub1[['NUMCIGMO_EST', 'ETHRACE2A']].dropna()
# calling the ols function and passing the explanatory categorical and response variable
model2 = smf.ols(formula='NUMCIGMO_EST ~ C(ETHRACE2A)', data=sub3).fit()
print(model2.summary())
print ('means for numcigmo_est by major depression status')
m2= sub3.groupby('ETHRACE2A').mean()
print(m2)
print('standard deviations for numcigmo_est by major depression status')
sd2 = sub3.groupby('ETHRACE2A').std()
print(sd2)
# Include required parameters in the MultiComparison function and then run the post-hoc TukeyHSD test
mc1 = multi.MultiComparison(sub3['NUMCIGMO_EST'], sub3['ETHRACE2A'])
res1 = mc1.tukeyhsd()
print(res1.summary())
1 note
·
View note
Note
Was recommended this post because I follow #programming. Love the energy, enthusiasm, passion. As an overbearing and invasive programming educator, wanted to share some thoughts:
Thought #1: If you already know what you intend to pursue, absolutely correct, start learning languages and concepts that are relevant. Even if there might be some more hypothetically effective path to the knowledge you need, it is more important that you actually want to follow the path than that it is paved smoothly at a perfect gradient.
Thought #2: HTML5 and CSS are absolutely great to know in our modern, web-driven world. If your drive is to be a front-end (i.e. visual interface, user experience) designer, these markup and styling languages are essentials. That being said, I cannot endorse the front-end web ecosystem as a strong introduction to programming or "coding" in general. Front-end development is done in a domain with very specific rules and quirks that do not cleanly translate to other domains. This can make it difficult for exclusively front-end developers to transition to other languages and forms of development. Most curriculums that teach general programming skills with JavaScript do so without including DOM manipulation.
Thought #3: Rather than Python "becoming popular," as it has been a titan in the programming world for decades, it would be more accurate to say that the problems the Python ecosystem is good at solving are becoming increasingly popular. These are problems such as data analysis and tabulation (aided by libraries like numpy and pandas) or developing machine learning algorithms (aided by libraries like tensorflow). Knowing how to use Python for these applications will strongly enhance your resume.
To avoid being too long-winded, I won't elaborate on my personal preferences or recommendations. If you have no idea where you want to begin, I send my students here. The most important thing to remember when you're starting out is something my father told me many years ago:
Good programmers do not learn languages, they learn to think.
Programming well is all about thinking well. When you can do that, translating your thoughts into code is trivial in any language. Any language that starts you on the path to thinking like a programmer is a good enough language.
What is the best coding language to learn first ??? And the most useful to learn for the future?

'What is the best coding language to learn first?'
I would say it depends if you prefer technology you're interested in e.g. web design, machine learning, software development, game development, android/IOS development, Artificial Intelligence etc. Definitely look into what sector you're interested in so you can find the right languages to start learning with.
BUT for you're brand new to coding and have no idea what you're interested in, I would recommend starting with the '3 basics':
1. HTML5
2. CSS3
3. JavaScript
These languages will just get you used to coding in general. I truly believe these are the must-have languages everyone should learn.
A programming language that is becoming popular right now is Python. When I was applying for a software developer apprenticeship, they all asked if I had any experience in Python. Every single one. So, it must be in demand ( ╹▽╹ )
'And the most useful to learn for the future?'
Before I say anything else, the basic 3 will always be needed. They will never go away in my opinion. They been here for over 25 years and are still being used now! (人*´∀`)。*゚+
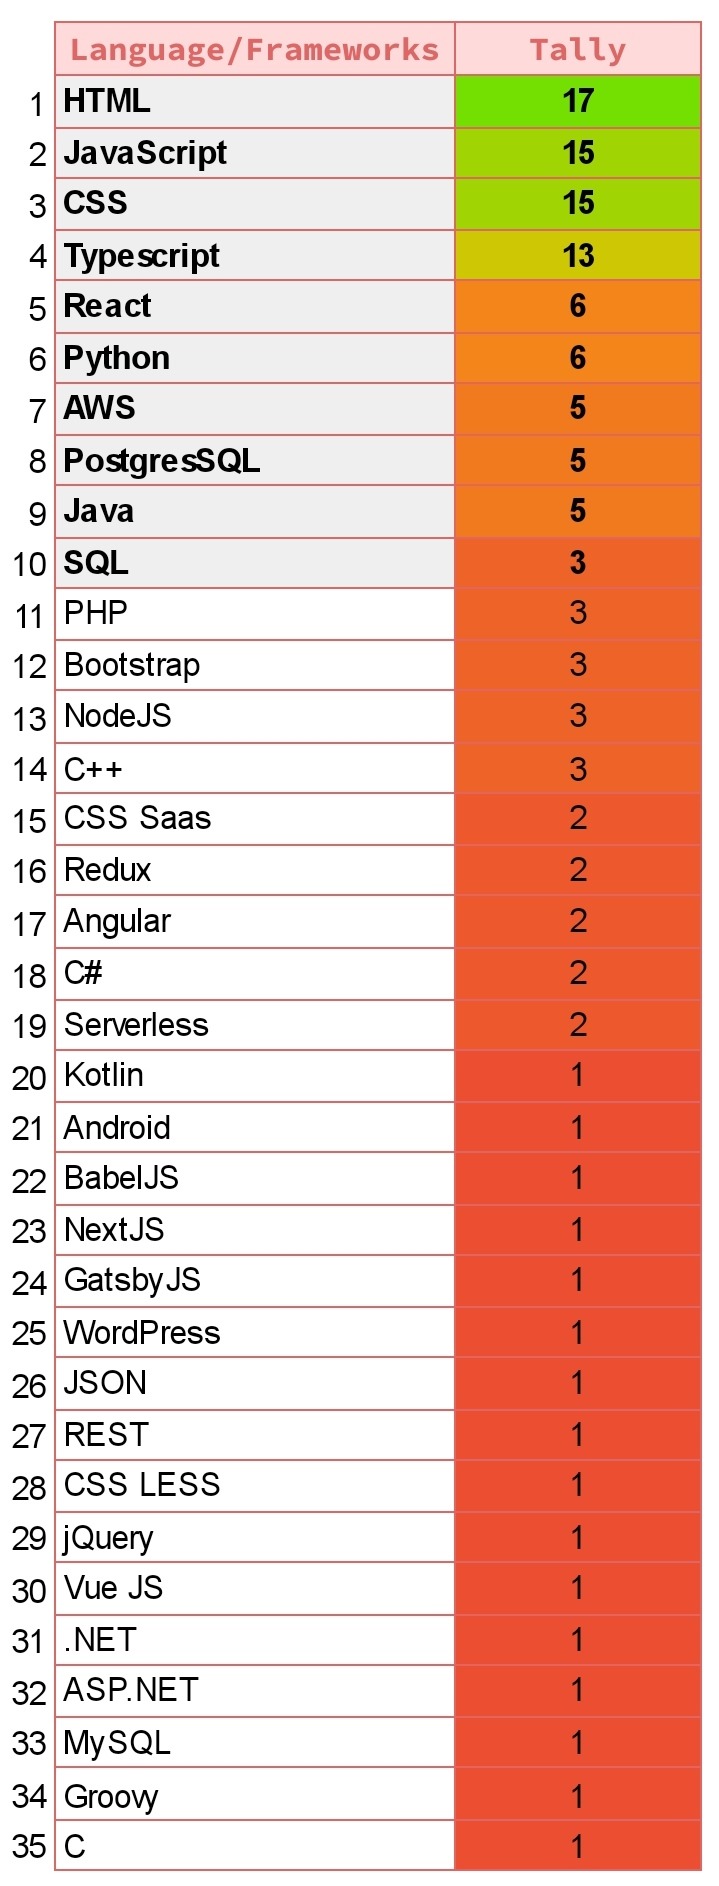
I recently did my own little research: I searched for Software/Frontend/Backend Developer jobs (you can do the same with the actual job you want to do) and looked at the programming langauges requirements and this is what I gathered after looking at 22 job posts in the UK (I do need to collect more but that's what I got so far):
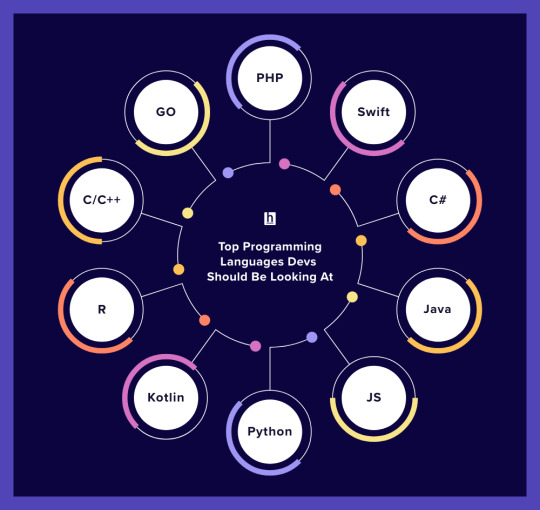
BUT if you read articles like the one on HackerEarth, they provide this very handy diagram showing you the top 10 programming languages of the future. Not necessarily saying these are new programming languages but will be in-demand in the future:
Advice
What I would advise is if you're brand new to coding, start with the 3 basics. Once you got a hang of it, you can divert to what job you want to focus on and learn the required programming language(s)! Be sure to read articles to get more insight on this! Hope this helps and good luck coding! (*˘︶˘*).。*♡
145 notes
·
View notes
Text
Programming Assignment Online Solutions
Python Programming Assignment Help
Python is a general purpose, interactive, high-level programming language. After its introduction in the late 1980’s, the Python Programming Language is being widely used by programmers to express concepts in just fewer lines in comparison to languages like JAVA and C++. Combat programming flaws with Python programming assignment help.
In addition, stuffed with dynamic features and automated memory management systems, Python underpins multiple programming paradigms that include http://allhomeworkassignments.com/ imperative and functional programming, object-oriented languages etc.
Want Python programming assignment help?
Languages Influenced By Python
The design philosophy of Python influence variety of programming languages. Python Programming Assignment Help lets you focus on the beneficial aspects of these Programming Languages.
Cobra - It directly supports the functional points like static typing, design-by-contract and unit tests by using the codes of indentation and similar syntax
Groovy - It was configured to integrate the design philosophy of Python into Java programming language
Coffee script - It is a Python inspired syntax that is used as a Programming Language to cross-compile the Java Scripts+
ECMAScript - Python contributes iterations, generators and list comprehensions to ECMAScript
Swift - This programming language is composed of Python inspired syntax but mainly invented by Apple.
Enjoy exclusive discounts on Python Programming Assignment Help.
Python Programming Assignment Sample Question And Solution
We has a top level of Python Programming Assignment helper they have delivered orders with a 99% satisfaction rate to students. We are showing one of the Python Programming Assignment Solutions from our bunch for you as a reference.
ICT233 Data Programming: Python Program
Question:
Design parsing methods to extract information from web pages and answer the following questions:
a) Assuming that you live in Toa Payton town and owns a car. Hence, you are interested to find out what how many car parks are there available in Toa Payton. Using http://allhomeworkassignments.com/ , construct a Python program to count the total number of car parks in “Toa Payton” and the total number of car parks decks available.
b) Assuming that you are driving home to Toa Payton and hence you are interested to know which of the car parks will provide you the highest chance to getting a lot. Construct another Python program that enable you to check and display in real-time what is the availability of the car parks in Toa Payton.
c) Based on the results in (a) and (b), how can you improve your program(s) and tabulate your chances of getting a lot in Toa Payton. You should rank it from highest to lowest chance.
Solution:-
Introduction:
The main aim of this project is to develop a real time availability of Singapore's car parks information which can be implemented in Jupiter Python Notebook. The the MySQL database is designed using AWS on the RDS data services. Thus, the analysis of a real time car details will be investigated. Read More
Get Python Programming Assignment Help
A shallow quality project on Python programming hampers the grade of students, leaving their career at stake. If you are tired of getting poor marks in Python programming assignments, We brings you meticulous Python programming assignment help that you were in search for. We not only sort out your exam blues but ride you through our problem-solving techniques.
Python is an excellent computer programming subject that enhances the computation skills of students. http://allhomeworkassignments.com/ inspires the students to gain thorough knowledge of the subject through our high-quality write-ups and Python Programming Assignment Help. Our unique expertise and efficient work process have helped us to stand out of the crowd. Our programming assignment experts are equipped with adequate skills and techniques to provide Python programming assignment help with efficacy.
#Programming Assignment Help#Programming Assignment Homework Help#Online Programming Assignment Help#Best Programming Assignment Help#science
0 notes
Text
programming Assignment Help With Experts Solutions
Python Programming Assignment Help
Python is a general purpose, interactive, high-level programming language. After its introduction in the late 1980’s, the Python Programming Language is being widely used by programmers to express concepts in just fewer lines in comparison to languages like JAVA and C++. Combat programming flaws with Python programming assignment help.
In addition, stuffed with dynamic features and automated memory management systems, Python underpins multiple programming paradigms that include http://allhomeworkassignments.com/ imperative and functional programming, object-oriented languages etc.
Want Python programming assignment help?
Languages Influenced By Python
The design philosophy of Python influence variety of programming languages. Python Programming Assignment Help lets you focus on the beneficial aspects of these Programming Languages.
Cobra - It directly supports the functional points like static typing, design-by-contract and unit tests by using the codes of indentation and similar syntax
Groovy - It was configured to integrate the design philosophy of Python into Java programming language
Coffee script - It is a Python inspired syntax that is used as a Programming Language to cross-compile the Java Scripts+
ECMAScript - Python contributes iterations, generators and list comprehensions to ECMAScript
Swift - This programming language is composed of Python inspired syntax but mainly invented by Apple.
Enjoy exclusive discounts on Python Programming Assignment Help.
Python Programming Assignment Sample Question And Solution
We has a top level of Python Programming Assignment helper they have delivered orders with a 99% satisfaction rate to students. We are showing one of the Python Programming Assignment Solutions from our bunch for you as a reference.
ICT233 Data Programming: Python Program
Question:
Design parsing methods to extract information from web pages and answer the following questions:
a) Assuming that you live in Toa Payton town and owns a car. Hence, you are interested to find out what how many car parks are there available in Toa Payton. Using http://allhomeworkassignments.com/ , construct a Python program to count the total number of car parks in “Toa Payton” and the total number of car parks decks available.
b) Assuming that you are driving home to Toa Payton and hence you are interested to know which of the car parks will provide you the highest chance to getting a lot. Construct another Python program that enable you to check and display in real-time what is the availability of the car parks in Toa Payton.
c) Based on the results in (a) and (b), how can you improve your program(s) and tabulate your chances of getting a lot in Toa Payton. You should rank it from highest to lowest chance.
Solution:-
Introduction:
The main aim of this project is to develop a real time availability of Singapore's car parks information which can be implemented in Jupiter Python Notebook. The the MySQL database is designed using AWS on the RDS data services. Thus, the analysis of a real time car details will be investigated. Read More
Get Python Programming Assignment Help
A shallow quality project on Python programming hampers the grade of students, leaving their career at stake. If you are tired of getting poor marks in Python programming assignments, We brings you meticulous Python programming assignment help that you were in search for. We not only sort out your exam blues but ride you through our problem-solving techniques.
Python is an excellent computer programming subject that enhances the computation skills of students. http://allhomeworkassignments.com/ inspires the students to gain thorough knowledge of the subject through our high-quality write-ups and Python Programming Assignment Help. Our unique expertise and efficient work process have helped us to stand out of the crowd. Our programming assignment experts are equipped with adequate skills and techniques to provide Python programming assignment help with efficacy.
#Programming Assignment Help#Programming Assignment Homework Help#Online Programming Assignment Help#Best Programming Assignment Help
0 notes
Text
The Most Reliable SPSS Assignment Help Service Online

SPSS is a widely used computer software package for statistical analysis and for statistics students aspiring to venture into the job market, this is a must have tool for any data analyst. SPSS whose original name stood for Statistical Package for Social Sciences was mainly built for use in the social sciences. Over the years, however, this tool has proven to be useful in other fields as well where it’s used for Marketing research, health research, educational and governmental researches, data mining and many others.
In addition to statistical analysis, SPSS is also useful in data management and data documentation. Some of these processes entail case selection, file reshaping, creating derived data. Some of the key branches of statistics handled by the software include:
· Descriptive statistics: Cross tabulation, Frequencies, Descriptives, Explore, Descriptive Ratio Statistics
· Bivariate statistics: Means, t-test, ANOVA, Correlation (bivariate, partial, distances), Nonparametric tests, Bayesian
· Prediction for numerical outcomes: Linear regression
· Prediction for identifying groups: Factor analysis, cluster analysis (two-step, K-means, hierarchical), Discriminant
· Geo spatial analysis, simulation
· R extension (GUI), Python
As handy a tool it may be, getting to understand and master the key concepts of SPSS has proven not to be such an easy task for majority of statistics students. Students have had a hard time handling their SPSS assignment the right way with some not knowing what to write in some of these assignments. Some assignments prove to be too complex to be handled by the amateur statisticians and we really can’t blame them for the poor grades most end up with.
We at The Assignment Helper understand the need for good grades in your assignments no matter how complex they may be. For this reason, we offer you one of the best SPSS assignment help services from professional statistics tutors with years of experience in using SPSS and helping students with their SPSS assignments.
Some of the reasons students have turned to us for SPSS assignment help include:
· Lack of enough time to handle the assignment: As a student, we understand how busy and tight your time schedule may be. You may have assignments to handle in other units, exams you need to revise for or just need some time to attend to a part time job you have. When you reach out to us for SPSS homework help, we create you some time off your busy schedule and let you attend to the other things while we handle your assignment for you.
· Tough assignments: Some of the assignments you need to handle could be beyond your scope of knowledge. When faced with such assignments, TheAssignmentHelper.com is your best bet to get professional SPSS homework help and ensure you excel even on the toughest of assignments.
Over the years, students around the globe have relied on us to to offer them the best online SPSS homework help. Here are some of the reasons why most have turned to us:
1. Our SPSS assignment help service is quality centered. We have built ourselves a reputation for being one of the most reliable online SPSS assignment help providers in providing quality assignment solutions that will get you the lucrative grades you need.
2. We understand the urgency with which assignments come with. Because of this, we ensure our clients always have access to round the clock service, anytime anywhere. We also are very time conscious with our work and in most cases, we will always ensure to deliver your assignments before the set deadlines.
3. All the assignment solutions are written and done by our professionals from scratch. By this, we ensure that all the work we deliver to our clients is plagiarism free.
4. Our services are very affordable compared to most of our competitors. We understand that most of our clients are students, most of whom do not have income sources of their own. We therefore have made our services pocket friendly to ensure we reach out to the majority of students who need our help.
5. Through our ever open communication channels, our clients are guaranteed of 24/7 support for any queries one may have. You also can follow up on the progress of the assignment as we work on it.
When it comes to getting your SPSS assignment done the perfect way, we are the people to get it done for you right no matter what reason you may have for getting SPSS assignment help from us. Contact us today and get in touch with some of the most experienced statistics tutors.
Read more about: The best online provider of computer science homework help
0 notes
Text
Why You Should Get Your SPSS Assignment Done By Us?

SPSS is a widely used computer program for statistical analysis and for statistics students aspiring to venture into the job market, this is a must have tool for any data analyst. SPSS whose original name stood for Statistical Package for Social Sciences was mainly built for use in the social sciences. Over the years, however, this tool has been found to be useful in other fields where it’s used for Marketing research, health research, educational and governmental researches, data mining and many others.
In addition to statistical analysis, SPSS is also useful in data management and data documentation. Some of these processes entail case selection file reshaping, creating derived data. Some of the key branches of statistics handled by the software include:
Descriptive statistics: Cross tabulation, Frequencies, Descriptives, Explore, Descriptive Ratio Statistics
Bivariate statistics: Means, t-test, ANOVA, Correlation (bivariate, partial, distances), Nonparametric tests, Bayesian
Prediction for numerical outcomes: Linear regression
Prediction for identifying groups: Factor analysis, cluster analysis (two-step, K-means, hierarchical), Discriminant
Geo spatial analysis, simulation
R extension (GUI), Python
As handy a tool it may be, getting to understand and master the key concepts of SPSS has proven not to be such an easy task for majority of statistics students. Majority of students have had a hard time handling their statistics assignment the right way with some not knowing what to write in some of these assignments. Some assignments prove to be too complex to be handled by the amateur statisticians and we really can’t blame them for the poor grades most end up having.
At Statistics Assignment Experts, we understand the need for good grades in your assignment no matter how complex they may be. For this reason, we offer you one of the best SPSS assignment help services from professional statistics tutors with years of experience in using SPSS and helping students with their SPSS assignments.
Some of the reasons students have turned to us for SPSS assignment help include:
Lack of enough time to handle the assignment: As a student, we understand how busy and your time schedule may be. You may have assignments to handle in other units, exams you need to revise for or just need some time to attend to a part time job you have. When you reach out to us for SPSS assignment help, we create you some time off your busy schedule and let you attend to the other things while we handle your assignment for you.
Tough assignments: Some of the assignments you need to handle could be beyond your knowledge and scope. When faced with such assignments, StatisticsAssignmentExperts is your best bet to get professional SPSS homework help and ensure you excel even on the toughest of assignments.
Over the years, students around the globe have relied on us to to offer them the best online SPSS homework help. Here are some of the reasons why most have turned to us:
1. Our SPSS homework help service is quality centered. We have built ourselves a reputation for being one of the most reliable online SPSS assignment help providers in providing quality assignment solutions that will get you the lucrative grades you need.
2. At StatisticsAssignmentExperts.com, we understand the urgency with which assignments come with. Because of this, we ensure our clients always have access to round the clock service, anytime anywhere. We also are very time conscious with our work and in most cases, we will always ensure to deliver your assignments before the set deadlines.
3. All the assignment solutions are written and done by our professionals from scratch. By this, we ensure that all the work we deliver to our clients is plagiarism free.
4. Our services are very affordable compared to most of our competitors. At Statistics Assignment Experts, we understand that most of our clients are students, most of whom do not have income sources of their own. We therefore have made our services pocket friendly to ensure we reach out to the majority of students who need our help.
5. Through our ever open communication channels, our clients are guaranteed of 24/7 support for any queries one may have. You also can follow up on the progress of the assignment as we do it.
When it comes to getting your SPSS assignment done the perfect way, we are the people to get it done for you right no matter what reason you may have for getting SPSS assignment help from us. Contact us today and get in touch with some of the most experienced statistics tutors.
0 notes
Text
Where to Find the Best SPSS Assignment Help Service Online ?
SPSS is a widely used computer program for statistical analysis and for statistics students aspiring to venture into the job market, this is a must have tool for any data analyst. SPSS whose original name stood for Statistical Package for Social Sciences was mainly built for use in the social sciences. Over the years, however, this tool has been found to be useful in other fields where it’s used for Marketing research, health research, educational and governmental researches, data mining and many others.
In addition to statistical analysis, SPSS is also useful in data management and data documentation. Some of these processes entail case selection, file reshaping, creating derived data. Some of the key branches of statistics handled by the software include:
· Descriptive statistics: Cross tabulation, Frequencies, Descriptives, Explore, Descriptive Ratio Statistics
· Bivariate statistics: Means, t-test, ANOVA, Correlation (bivariate, partial, distances), Nonparametric tests, Bayesian
· Prediction for numerical outcomes: Linear regression
· Prediction for identifying groups: Factor analysis, cluster analysis (two-step, K-means, hierarchical), Discriminant
· Geo spatial analysis, simulation
· R extension (GUI), Python
As handy a tool it may be, getting to understand and master the key concepts of SPSS has proven not to be such an easy task for majority of statistics students. Majority of students have had a hard time handling their statistics assignment the right way with some not knowing what to write in some of these assignments. Some assignments prove to be too complex to be handled by the amateur statisticians and we really can’t blame them for the poor grades most end up having.
At StatisticsAssignmentHelper.com, we understand the need for good grades in your assignment no matter how complex they may be. For this reason, we offer you one of the best SPSS assignment help services from professional statistics tutors with years of experience in using SPSS and helping students with their SPSS assignments.
Some of the reasons students have turned to us for SPSS assignment help include:
· Lack of enough time to handle the assignment: As a student, we understand how busy and your time schedule may be. You may have assignments to handle in other units, exams you need to revise for or just need some time to attend to a part time job you have. When you reach out to us for SPSS assignment help, we create you some time off your busy schedule and let you attend to the other things while we handle your assignment for you.
· Tough assignments: Some of the assignments you need to handle could be beyond your knowledge and scope. When faced with such assignments, StatisticsAssignmentHelper.com is your best bet to get professional SPSS homework help and ensure you excel even on the toughest of assignments.
Over the years, students around the globe have relied on us to to offer them the best online SPSS homework help. Here are some of the reasons why most have turned to us:
Ø Our SPSS homework help service is quality centered. We have built ourselves a reputation for being one of the most reliable online SPSS assignment help providers in providing quality assignment solutions that will get you the lucrative grades you need.
Ø At StatisticsAssignmentHelper.com, we understand the urgency with which assignments come with. Because of this, we ensure our clients always have access to round the clock service, anytime anywhere. We also are very time conscious with our work and in most cases, we will always ensure to deliver your assignments before the set deadlines.
Ø All the assignment solutions are written and done by our professionals from scratch. By this, we ensure that all the work we deliver to our clients is plagiarism free.
Ø Our services are very affordable compared to most of our competitors. At Statistics Assignment Helper, we understand that most of our clients are students, most of whom do not have income sources of their own. We therefore have made our services pocket friendly to ensure we reach out to the majority of students who need our help.
Ø Through our ever open communication channels, our clients are guaranteed of 24/7 support for any queries one may have. You also can follow up on the progress of the assignment as we do it.
When it comes to getting your SPSS assignment done the perfect way, we are the people to get it done for you right no matter what reason you may have for getting SPSS assignment help from us. Contact us today and get in touch with some of the most experienced statistics tutors.
0 notes
Text
Task 2
Created on Sat Apr 18 15:53:37 2020
@author: Aleksandra """
#import packages for data storage and manipulation import pandas as pd import numpy as np import matplotlib as mpl import matplotlib.pyplot as plt import seaborn as sns
work = pd.read_csv('work1.csv',sep=";",low_memory=False)
print(len(work)) print(len(work.columns))
#Let's get summary statistics for the dataset. If not columns are easily readible, it makes sence to index specific columns. For that purpose use the toolkit outlined above. work.describe()
#regression reg=work['Region'].value_counts() print(reg)
reg=work['Region'].value_counts(normalize=True) print(reg) regression_reg=work['Region'].value_counts(normalize=True) print(regression_reg)
age=work['Age'].value_counts() print(age)
gen=work['Gender'].value_counts() print(gen)
sp=work['Sphere'].value_counts() print(sp)
mar=work['Marriage'].value_counts() print(mar)
edu=work['Education'].value_counts() print(edu)
com=work['Company_form'].value_counts() print(com)
coms=work['Company_size'].value_counts() print(coms)
pro=work['Profession'].value_counts() print(pro)
pro=work['Profession'].value_counts() print(pro)
job=work['Job_exp_manag'].value_counts() print(job)
jobcomp=work['Job_exp_cur_comp'].value_counts() print(jobcomp)
# In[34]:
#Or cross-tabulation for more than one feature. pd.crosstab(gen,com)
#To see how features of the dataset correspond to each other, use correlation matrix. We could not do this function. work.iloc[:,:70].corr()
jobcomp[::-10]
#Graphs
#define type of graph display get_ipython().run_line_magic('matplotlib', 'inline') plt.style.use('seaborn-whitegrid') plt.rcParams['figure.figsize'] = [10, 5]
# In[92]:
sns.distplot(age)
# In[93]:
sns.distplot(mar)
# In[103]:
plt.plot(work.Age,work.Marriage,'o',color="black", markersize=1) plt.xlabel("Age") plt.ylabel("Marriage") plt.title("Relation between Marriage and Age")
OUTPUT
Python 3.7.6 (default, Jan 8 2020, 20:23:39) [MSC v.1916 64 bit (AMD64)] Type "copyright", "credits" or "license" for more information.
IPython 7.12.0 -- An enhanced Interactive Python.
runfile('C:/Users/flex/Documents/Python Scripts/week_1.py', wdir='C:/Users/flex/Documents/Python Scripts') 212 75 2 94 53 42 1 23 23 12 61 9 4 3 50 3 28 2 7 2 25 1 18 1 8 1 19 1 20 1 21 1 5 1 17 1 82 1 26 1 80 1 40 1 43 1 48 1 55 1 56 1 59 1 62 1 71 1 74 1 76 1 39 1 Name: Region, dtype: int64 2 0.443396 53 0.198113 1 0.108491 23 0.056604 61 0.042453 4 0.014151 50 0.014151 28 0.009434 7 0.009434 25 0.004717 18 0.004717 8 0.004717 19 0.004717 20 0.004717 21 0.004717 5 0.004717 17 0.004717 82 0.004717 26 0.004717 80 0.004717 40 0.004717 43 0.004717 48 0.004717 55 0.004717 56 0.004717 59 0.004717 62 0.004717 71 0.004717 74 0.004717 76 0.004717 39 0.004717 Name: Region, dtype: float64 2 0.443396 53 0.198113 1 0.108491 23 0.056604 61 0.042453 4 0.014151 50 0.014151 28 0.009434 7 0.009434 25 0.004717 18 0.004717 8 0.004717 19 0.004717 20 0.004717 21 0.004717 5 0.004717 17 0.004717 82 0.004717 26 0.004717 80 0.004717 40 0.004717 43 0.004717 48 0.004717 55 0.004717 56 0.004717 59 0.004717 62 0.004717 71 0.004717 74 0.004717 76 0.004717 39 0.004717 Name: Region, dtype: float64 1 90 2 44 4 27 5 26 3 25 Name: Age, dtype: int64 2 154 1 58 Name: Gender, dtype: int64 12 55 16 20 6 18 18 14 25 12 17 10 15 10 11 9 3 9 26 8 27 8 23 5 14 4 2 4 7 4 10 3 28 3 21 3 22 3 13 2 19 2 4 2 8 1 24 1 1 1 0 1 Name: Sphere, dtype: int64 3 147 1 57 2 8 Name: Marriage, dtype: int64 5 139 1 31 6 22 7 12 3 6 4 1 2 1 Name: Education, dtype: int64 1 150 2 62 Name: Company_form, dtype: int64 3 92 1 78 2 42 Name: Company_size, dtype: int64 17 42 15 21 12 20 19 16 18 14 14 13 5 11 2 11 20 7 7 7 13 6 1 6 26 6 23 5 27 4 25 4 10 3 16 3 24 3 3 3 4 2 8 2 0 1 Service 1 21 1 Name: Profession, dtype: int64 17 42 15 21 12 20 19 16 18 14 14 13 5 11 2 11 20 7 7 7 13 6 1 6 26 6 23 5 27 4 25 4 10 3 16 3 24 3 3 3 4 2 8 2 0 1 Service 1 21 1 Name: Profession, dtype: int64 0 121 4 25 1 21 3 14 2 12 5 10 6 5 8 2 7 2 Name: Job_exp_manag, dtype: int64 4 61 3 37 2 34 1 31 5 20 6 13 7 12 8 4 Name: Job_exp_cur_comp, dtype: int64
0 notes
Text
March 15, 2020 at 10:00PM - Database Administration Super Bundle (97% discount) Ashraf
Database Administration Super Bundle (97% discount) Hurry Offer Only Last For HoursSometime. Don't ever forget to share this post on Your Social media to be the first to tell your firends. This is not a fake stuff its real.
NoSQL databases have grown in popularity recently due to their immense scalability, availability, and fault tolerance. NoSQL helps analysts work with high volume and disparate data types by efficiently handling unstructured, messy, and unpredictable data. To work in data-driven business these days, you need a background in NoSQL, and this is where to start.
Access 32 lectures & 6 hours of content 24/7
Learn the basic NoSQL concepts & terms
Understand the NoSQL design approach & explore Test Cases
Install MongoDB & learn how to use it
Discover data aggregation techniques in NoSQL
Use Node.js & MongoDB to create web applications
MySQL is the most popular open source SQL database management system, allowing users to effectively manage data and design robust, efficient databases. In this course, you’ll learn everything you need to start using MySQL in web, cloud, and embedded applications. If you have any interest in developing apps, it’s important to have a good handle on relational databases, and this is an excellent place to start.
Access 9 lectures & 2 hours of content 24/7
Discuss what a database is & how they are used
Learn to create a well structure database
Use all tools in MySQL to effectively manage table
Perform practical examples in MySQL to fortify your knowledge
MongoDB is a NoSQL database that makes the integration of data in certain types of applications easier and faster. Being able to effectively use MongoDB can make your web apps more dynamic and user-friendly. In this crash course, you’ll learn everything you need to start working with MongoDB.
Access 16 lectures & 3 hours of content 24/7
Learn about installing MongoDB, the data model, & working w/ data
Discuss GridFS, PHP & MongoDB, & Python & MongoDB
Create a blog application w/ the PHP Driver
Explore database administration, optimization, replication, & sharding
Informatica is a service that delivers enterprise data integration and management software powering analytics for big data and the cloud. Dynamic Access Control, or DAC, comprises Informatica PowerCenter Workflows as the active component to control the interface workflows. These tools make data integration significantly easier for corporate environments, and companies will pay handsomely for Informatica pros. This course will help you become one of them.
Access 99 lectures & 18 hours of content 24/7
Learn in detail about dimensions & functions of Informatica
Discuss normalization & ETL tools
Become familiar w/ the Informatica Architecture
Study the Powercenter client tool & Source Definition Overview
Understand Designer & workflow manager
Tableau is an extremely useful data analysis tool that allows you to visualize data efficiently. It connects easily to nearly any data source, from Microsoft Excel to web-based data, and creates visualizations without having to write a single line of code. Tableau is immensely useful, especially in corporate environments, for communicating data in a precise, accessible manner, which makes the demand for Tableau aficionados high.
Access 61 lectures & 11 hours of content 24/7
Understand the many options for connecting Tableau to data
Learn the Tableau interface & paradigm components
Discuss shelves, data elements, & proper terminology to create powerful visualizations
Create basic calculations including string manipulation, basic arithmetic calculations, custom aggregations & more
Microsoft SQL Server Integration Services is a platform for building high performance data integration solutions, including extraction, transformation, and load (ETL) packages for data warehousing. SSIS also includes graphical tools and wizards for building and debugging packages. Through this training, you’ll gain the skills you need to use SSIS as a business intelligence tool, thereby greatly increasing your ability to score high paying data jobs.
Access 44 lectures & 8 hours of content 24/7
Discover SSIS tools & its advantages & disadvantages
Explore the various SSIS functions, like Aggregate Data transformation support, how to input data from database to text, & more
Learn how to use the data viewer using different viewing functions
This course will introduce you to Microsoft SQL, and the most important concepts behind databases and the process of building them. You’ll gain a comprehensive overview of all the major components of the SQL Server product suite, and dive into relational DBMS. By course’s end, you’ll have a strong grasp of SQL, perhaps the most important data management language on earth.
Access 124 lectures & 23 hours 24/7
Install SQL Server & discuss database concepts w/ practical examples
Learn how to create & manage a database
Understand how to access data from a database using SQL
Maintain instances & databases, optimize & troubleshoot, manage data, & more
Implement database security & high availability
Regression modeling is one of the core tenets of predictive modeling, allowing you to build strong models to effectively predict outcomes. In this course, you’ll develop regression modeling skills across a variety of business sectors and domains. Learning these data modeling skills will be an excellent addition to your resume, and can help you nail a new, high-paying career.
Access 67 lectures & 12 hours of content 24/7
Introduce yourself to regression modeling
Understand how to identify independent variables & perform regression equations
Learn how to tabulate values & interpret data sets
Dive into basic multiple regressions & working w/ scatterplots
Minitab is among the leading developers in the world for statistical analysis software, as well as software for Six Sigma, lean, and other project management tools. Used by thousands of companies and universities throughout the world, Minitab software is perhaps most prominently used in predictive modeling. Through this course, you’ll learn how to apply Minitab to predictive modeling in different business sectors, thereby picking up a vital skill that can set your resume apart from the pack.
Access 16 lectures & 3 hours of content 24/7
Implement predictive modeling concepts w/ Minitab software
Become familiar w/ non-linear regression
Explore T-tests, standard deviation, means, & descriptive statistics
Understand behavior of customers, movements of the financial markets, & study practical examples in pharma & medicine
from Active Sales – SharewareOnSale https://ift.tt/2U43mnK https://ift.tt/eA8V8J via Blogger https://ift.tt/2U5vSW2 #blogger #bloggingtips #bloggerlife #bloggersgetsocial #ontheblog #writersofinstagram #writingprompt #instapoetry #writerscommunity #writersofig #writersblock #writerlife #writtenword #instawriters #spilledink #wordgasm #creativewriting #poetsofinstagram #blackoutpoetry #poetsofig
0 notes
Link
Complete Guide to Practical Data Science with Python: Learn Statistics, Visualization, Machine Learning & More
What you’ll learn
Install Anaconda & Work Within The iPytjhon/Jupyter Environment, A Powerful Framework For Data Science Analysis
Become Proficient In Using The Most Common Python Data Science Packages Including Numpy, Pandas, Scikit & Matplotlib
Be Able To Read In Data From Different Sources (Including Webpage Data) & Clean The Data
Carry Out Data Exploratory & Pre-processing Tasks Such As Tabulation, Pivoting & Data Summarizing In Python
Become Proficient In Working With Real Life Data Collected From Different Sources
Carry Out Data Visualization & Understand Which Techniques To Apply When
Carry Out The Most Common Statistical Data Analysis Techniques In Python Including T-Tests & Linear Regression
Understand The Difference Between Machine Learning & Statistical Data Analysis
Implement Different Unsupervised Learning Techniques On Real Life Data
Implement Supervised Learning (Both In The Form Of Classification & Regression) Techniques On Real Data
Evaluate The Accuracy & Generality Of Machine Learning Models
Build Basic Neural Networks & Deep Learning Algorithms
Use The Powerful H2o Framework For Implementing Deep Neural Networks
Requirements
Be Able To Use PC At A Beginner Level, Including Being Able To Install Programs
A Desire To Learn Data Science
Prior Knowledge Of Python Will Be Useful But NOT Necessary
Description
THIS IS A COMPLETE DATA SCIENCE TRAINING WITH PYTHON FOR DATA ANALYSIS:
It’s A Full 12-Hour Python Data Science BootCamp To Help You Learn Statistical Modelling, Data Visualization, Machine Learning & Basic Deep Learning In Python!
HERE IS WHY YOU SHOULD TAKE THIS COURSE:
First of all, this course a complete guide to practical data science using Python…
That means, this course covers ALL the aspects of practical data science and if you take this course alone, you can do away with taking other courses or buying books on Python based data science.
In this age of big data, companies across the globe use Python to sift through the avalanche of information at their disposal. By storing, filtering, managing, and manipulating data in Python, you can give your company a competitive edge & boost your career to the next level!
THIS IS MY PROMISE TO YOU:
COMPLETE THIS ONE COURSE & BECOME A PRO IN PRACTICAL PYTHON BASED DATA SCIENCE!
But, first things first, My name is MINERVA SINGH and I am an Oxford University MPhil (Geography and Environment) graduate. I recently finished a PhD at Cambridge University (Tropical Ecology and Conservation).
I have several years of experience in analyzing real life data from different sources using data science related techniques and producing publications for international peer reviewed journals.
Over the course of my research I realized almost all the Python data science courses and books out there do not account for the multidimensional nature of the topic and use data science interchangeably with machine learning…
This gives student an incomplete knowledge of the subject. This course will give you a robust grounding in all aspects of data science, from statistical modeling to visualization to machine learning.
Unlike other Python instructors, I dig deep into the statistical modeling features of Python and gives you a one-of-a-kind grounding in Python Data Science!
You will go all the way from carrying out simple visualizations and data explorations to statistical analysis to machine learning to finally implementing simple deep learning based models using Python
DISCOVER 12 COMPLETE SECTIONS ADDRESSING EVERY ASPECT OF PYTHON DATA SCIENCE (INCLUDING):
• A full introduction to Python Data Science and powerful Python driven framework for data science, Anaconda • Getting started with Jupyter notebooks for implementing data science techniques in Python • A comprehensive presentation about basic analytical tools- Numpy Arrays, Operations, Arithmetic, Equation-solving, Matrices, Vectors, Broadcasting, etc. • Data Structures and Reading in Pandas, including CSV, Excel, JSON, HTML data • How to Pre-Process and “Wrangle” your Python data by removing NAs/No data, handling conditional data, grouping by attributes, etc. • Creating data visualizations like histograms, boxplots, scatterplots, barplots, pie/line charts, and more! • Statistical analysis, statistical inference, and the relationships between variables • Machine Learning, Supervised Learning, Unsupervised Learning in Python • You’ll even discover how to create artificial neural networks and deep learning structures…& MUCH MORE!
With this course, you’ll have the keys to the entire Python Data Science kingdom!
NO PRIOR PYTHON OR STATISTICS/MACHINE LEARNING KNOWLEDGE IS REQUIRED:
You’ll start by absorbing the most valuable Python Data Science basics and techniques…
I use easy-to-understand, hands-on methods to simplify and address even the most difficult concepts in Python.
My course will help you implement the methods using real data obtained from different sources. Many courses use made-up data that does not empower students to implement Python based data science in real life.
After taking this course, you’ll easily use packages like Numpy, Pandas, and Matplotlib to work with real data in Python.
You’ll even understand deep concepts like statistical modeling in Python’s Statsmodels package and the difference between statistics and machine learning (including hands-on techniques).
I will even introduce you to deep learning and neural networks using the powerful H2o framework!
With this Powerful All-In-One Python Data Science course, you’ll know it all: visualization, stats, machine learning, data mining, and deep learning!
The underlying motivation for the course is to ensure you can apply Python based data science on real data and put into practice today. Start analyzing data for your own projects, whatever your skill level and IMPRESS your potential employers with actual examples of your data science abilities.
HERE IS WHAT THIS COURSE WILL DO FOR YOU:
This course is your one shot way of acquiring the knowledge of statistical data analysis skills that I acquired from the rigorous training received at two of the best universities in the world, perusal of numerous books and publishing statistically rich papers in renowned international journal like PLOS One.
This course will:
(a) Take students without a prior Python and/or statistics background background from a basic level to performing some of the most common advanced data science techniques using the powerful Python based Jupyter notebooks.
(b) Equip students to use Python for performing different statistical data analysis and visualization tasks for data modelling.
(c) Introduce some of the most important statistical and machine learning concepts to students in a practical manner such that students can apply these concepts for practical data analysis and interpretation.
(d) Students will get a strong background in some of the most important data science techniques.
(e) Students will be able to decide which data science techniques are best suited to answer their research questions and applicable to their data and interpret the results.
It is a practical, hands-on course, i.e. we will spend some time dealing with some of the theoretical concepts related to data science. However, majority of the course will focus on implementing different techniques on real data and interpret the results. After each video you will learn a new concept or technique which you may apply to your own projects.
JOIN THE COURSE NOW!
Who this course is for:
Anyone Who Wishes To Learn Practical Data Science Using Python
Anyone Interested In Learning How To Implement Machine Learning Algorithms Using Python
People Looking To Get Started In Deep Learning Using Python
People Looking To Work With Real Life Data In Python
Anyone With A Prior Knowledge Of Python Looking To Branch Out Into Data Analysis
Anyone Looking To Become Proficient In Exploratory Data Analysis, Statistical Modelling & Visualizations Using iPython
Created by Minerva Singh Last updated 1/2019 English English [Auto-generated]
Size: 2.21 GB
Download Now
https://ift.tt/2UlKlNb.
The post Complete Data Science Training with Python for Data Analysis appeared first on Free Course Lab.
0 notes
Text
Data Insights Case Study Part 2 - More Preprocessing

In the last couple posts, we’ve:
Identified the problem / hypothesis to go after.
Figured out the data set to work with.
Figured out a subset of the data to load into a relational DB (and structured in a roughly “standardized” format).
Connected the data in the relational DB to frontend Python and showing the data as a Pandas dataframe.
Now we have to do more work. If you even give a cursory look at edu_indicators_f and econ_indicators data (or the tables in the relational DB), you’ll notice how the data is uneven and not ready for an algorithm like logistic regression to operate on them:
Different potential parameters and potential target variables have different volumes in the data
There are a LOT of such parameters and target variables (132 economic indicators and 23 education indicators)
The years have different ranges for different parameters/variables (although most end around 2014).
The values have a wide range, and are likely not comparable and would distort algorithms that try to extract insight out of them.
For example, run these queries:
select distinct indicatorcode, count(*) as volume from econ_indicators group by indicatorcode order by volume desc;
select distinct indicatorcode, count(*) as volume from edu_indicators_f group by indicatorcode order by volume desc;
select distinct(indicatorcode), min(year), max(year) from econ_indicators group by indicatorcode
select distinct(indicatorcode), min(year), max(year) from edu_indicators_f group by indicatorcode
select distinct(indicatorcode), min(val), max(val) from edu_indicators_f group by indicatorcode
You’ll see some results such as:

The challenge, then, is what do we do about it. There are many ways to tackle this but this is how I approached it:
First, the target variables. There are 132 economic indicators, so it’s not very practical to try figure out the relationship between the education factors and ALL the economic indicators. We’ll have to filter down to a few candidates that covers the most number of countries and the most number of years:
select distinct(indicatorcode), count(distinct(countrycode)) as numcountries, count(distinct(year)) as numyears from econ_indicators group by indicatorcode order by numcountries desc, numyears desc;

Obviously, some intuition/judgement need to be made here to pick the top features, or it could be done through a threshold (e.g., numcountries >= 230). For purposes of this initial data exploration and not having to write 2313414 posts, we’ll stick to NY.GDP.MKTP.CD for now, as the target variable, and can always revisit later.
create table econ_target as select indicatorcode, countrycode, year, val from econ_indicators where indicatorcode = 'NY.GDP.MKTP.CD'
Second, for the features (educational indicators), we don’t need all of them either. Because it’s a much smaller set, we can probably use downstream algorithms like PCA to figure out which subset best explains the values in the target variables. But for sake of this initial exploration (and again, not having to write 2313414 posts ;)), we’ll arbitrarily limit it to at least 230 countries and 45 years. We can always come back and all the rest back in for more in-depth exploration.
select distinct(indicatorcode), count(distinct(countrycode)) as numcountries, count(distinct(year)) as numyears from edu_indicators_f group by indicatorcode order by numcountries desc, numyears desc

create table edu_candidates as select indicatorcode, countrycode, year, val from edu_indicators_f where indicatorcode in ('SE.PRM.ENRL.FE.ZS', 'SE.SEC.ENRL.GC.FE.ZS', 'SE.SEC.ENRL.FE.ZS', 'SE.PRM.TCHR.FE.ZS', 'SE.SEC.ENRL.VO.FE.ZS', 'SE.SEC.TCHR.FE.ZS', 'SE.SEC.TCHR.FE')
Third, for both education and economic indicators, we don’t need the country name or the indicator name, nor the ID columns. Rather, we can drop these and rely on the code columns. When we need to identify what the actual variables are, we can always use the original table mappings to retrieve the full names. To make downstream (e.g., Python side) processing easier, let’s consolidate both candidate feature and target variables in one table and join on the country and years. Also, since we don’t care about what the target variable is called (it’s always 'NY.GDP.MKTP.CD' in our case), we can drop that as well:
create table ed_ec_trans as select ed.year as yr, ed.countrycode as country, ed.indicatorcode as edu_ind, ed.val as edu_val, ec.val as ec_val from econ_target as ec, edu_candidates as ed where ed.countrycode = ec.countrycode and ec.year = ed.year;
Fourth, we need to read it into the Python side (using Pandas), and then reformat it so that all the variables in edu_ind are turned into columns (features), to make it easier to process downstream. If you need a primer on how pivot tables work in Pandas, check this out. Now, assuming you’re using InsightTools class that we defined in the previous post, replace the credentials with your own:
def main():
iTools = InsightTools('localhost', '<your database>', '<your user>', '<your password>'); df = iTools.fetch_data_as_pd('select * from ed_ec_trans limit 200');
dfp = pd.pivot_table(df,index=['yr', 'country', 'ec_val'], columns=['edu_ind'], fill_value=0, aggfunc=‘sum’)
dfp.to_csv('dfp.csv')
Note the limit 200 and the CSV file. This is so that you can quickly test and check whether the format of the data is what you expect...and while you can print to screen to check, with large dataframes (even with something like Python’s tabulate) it becomes harder to read. But limit the results and export to CSV and then you can view it nicely in Excel or Libreoffice (if you’re on Linux like me). Also, don’t forget the aggfunc=‘sum’ since by default, pivot_table will try to aggregate by averaging the values...and while that may be ok, we don’t want to do computations in our data just yet as we’ll do quite a bit of these in the next post.

Now, If you look closely at the CSV file as shown in Libreoffice, you’ll see how ec_val is in the index section as a level (our target variable) and all the edu_val variables on the right of it are the feature columns that we’ll deal with in the next post.
Before we can use the dataframe further, we need to pull the target variable out of the index and onto its own column:
dfp = dfp.reset_index(level=['ec_val'])
If you export to CSV again, you’ll see how ec_val is now its own column and not part of the index:

We can leave the year and country as part of the index.
Fifth, we need to scale the values in the feature and target columns, as we don’t want certain features to otherwise distort the downstream algorithms. There are many ways to scale, but to start with (and keeping in mind we may do PCA later on), we’ll use standardization. And we’ll also move up the 2nd-level education column names to first level and name the economic indicator variable (the ‘y’) variable as well, so we can more easily refer to all these later:
from sklearn.preprocessing import StandardScaler;
scaler = StandardScaler()
dfp_std = pd.DataFrame(scaler.fit_transform(dfp), columns = dfp.columns)
dfp_std.to_csv('dfp_std.csv')
dfp_std.columns = [col[1] for col in dfp_std.columns]
dfp_std.columns.values[0] = 'ec_ind'
You’ll see the the dataframe that’s almost ready for downstream processing when you open the CSV file:

Finally, did you notice something we did earlier that we should undo? ;) If you’ve been paying close attention, we need to remove the “limit 200″ and then run the script again, to pull in and preprocess the entire dataset:
df = iTools.fetch_data_as_pd('select * from ed_ec_trans');
In the next post, we’ll start the fun stuff to actually clean insight from the preprocessed data.
0 notes