#imagej2
Explore tagged Tumblr posts
Visit Tumblr Blog
Explore Tumblr blogs with no restrictions, modern design and the best experience.
Last Seen Tumblr Blogs


Fun Fact
Tumblr’s website traffic is steadily declining.
Text
the enigma of (art) blend modes, and how doing brain research taught me how to better utilize them
(DISCLAIMER--I'm not actually going in-depth on different blend modes; there's other resources for that sort of thing! Rather, I'm just planning on talking about how they've been captivating to me in the past.)
I've been working with digital art programs for quite some time now, mostly for my game development pursuits, but also more recently just for fun.
Whatever program I'm using, be it Aseprite, Krita, or Paint.net, there's always this goofy little feature referred to as "blend modes". Really, all it refers to is how new colors should be made when two colors overlap on an image--particularly from different layers.
Back when I was young and naive, those layer blend modes hardly did more than just exist. Maybe I'd pull down that drop-down menu and switch around the modes every once in a while, but this was never used to help me during the creation process.
There's something about starting to use a new art program and getting overwhelmed by all the buttons on the UI. Of course, it takes time to master those menus, but when you do, it's nothing short of rewarding.
Which brings me to one of the most interesting programs I've worked with: Fiji.
Fiji isn't an art program--it's anything but. Instead, it's open source image processing software, designed for life science related analyses.
I've had the (mis)fortune of becoming acquainted with this software through my internship. When it was introduced to me last year, it was... overwhelming, to say the least.
This is what it looks like when you open it:
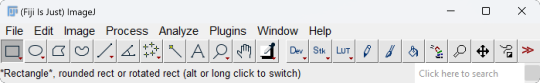
Not too overwhelming yet, right? Wrong. Here's what the dropdown menu for "Analyze" looks like.
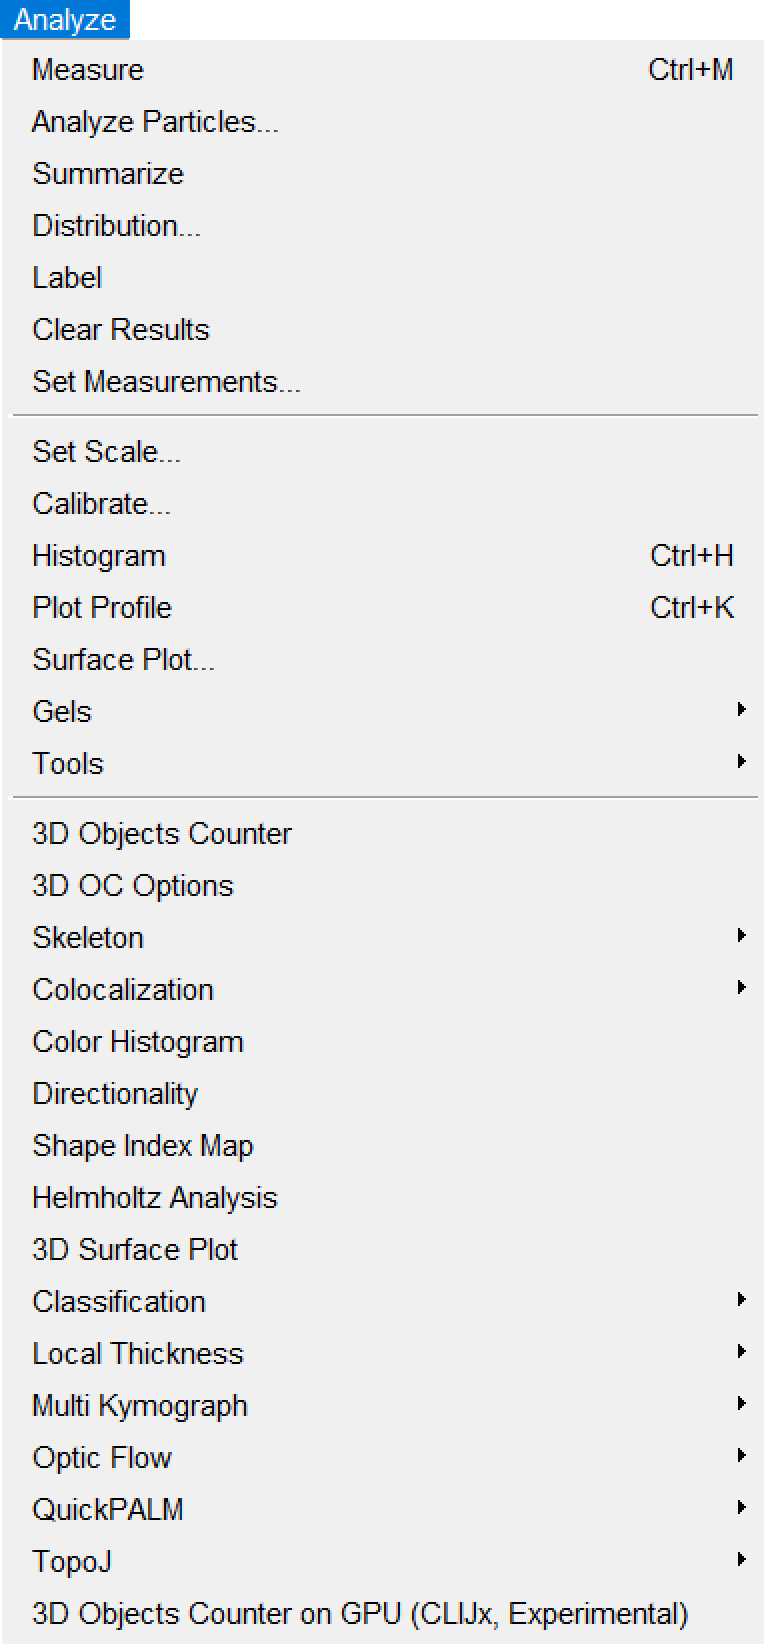
(I like how it starts with normal sounding words, before devolving into things like "Helmholtz Analysis" and "Multi Kymograph".)
If any of you are already super-mega-brain-nerds and know how to utilize all of these options, then good for you, I suppose. For the vast majority of the people who are unacquainted with neuroscience (such as myself), however, this is INCREDIBLY daunting to navigate. Imagine something just as confusing as this for the other menus.
Hell, even just importing imaging data proves labyrinthine:
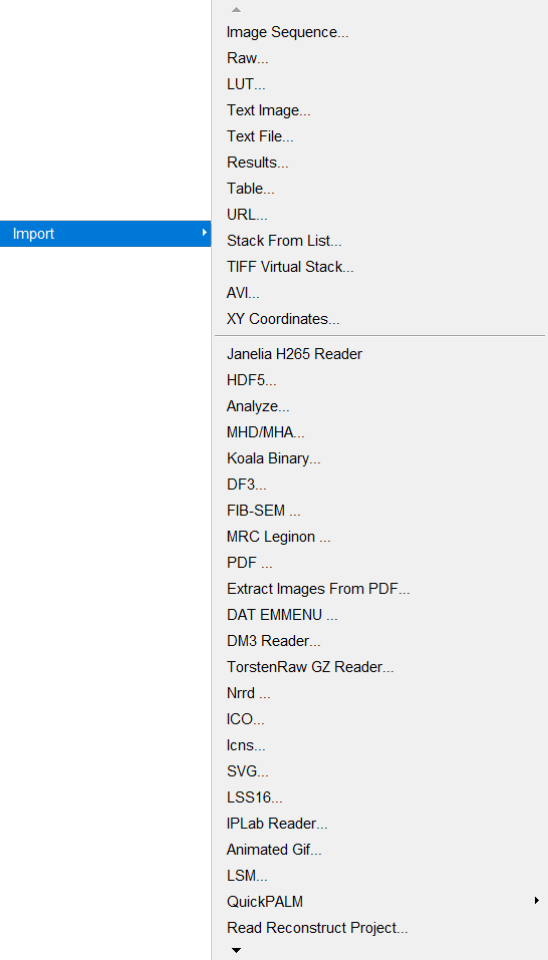
Okay. I'm done fussing over how convoluted Fiji's menus are.
I've worked with them for long enough to understand them a little better, though I still couldn't tell you what half the buttons do.
...like most of the art programs I use.
Yes, I've used Paint.NET since, like, 2018. No, I still have no idea what the "Clone Stamp" button does.
(by the way, if you're still using Paint.NET yourself for art, 1. what are you doing, and 2. Krita is much better for what I needed from an art program, so I might recommend trying that out if Paint.NET is getting on your nerves!)
Anyway, loading imaging data into Fiji usually gives you a video you can pan through. Most imaging data usually either represents a z-series, t-series, or both.
A z-series is imaging done on several layers of the subject's brain at a single time point, to create a 3D stack of images with time substituting for the depth into the brain.
On the other hand, a t-series is imaging done (usually) on a single layer of the brain throughout several time points. (Data I've worked with has ranged from 15-minute-long t-series to 100-minute-long t-series.) This again creates a 3D stack, though this time, time represents, well, time. (This is how most video is stored--even if the video itself is 2-dimensional, you're still "technically" viewing 2D slices of a 3D stack--though only super-nerds call video 3D.)
A zt-series can also be imaged by making several z-series over time, which can be processed into a 4D video. (Usually, though, the slices have to be processed through software to order them properly.)
Last year, I worked with zt-series a lot. This year, however, I've got easier work--I'm just working with t-series this time, to analyze calcium activity.
They're nicer to work with, to say the least. I've worked on automating the collection of calcium activity data by comparing the minimum and maximum values of each pixel throughout the whole t-series in order to determine where there's potentially calcium activity happening.
...in fact, once you get an image of the minimum and maximum values of each pixel across the whole t-series, you then work with those images as layers and use different functions to extract a mask that shows only potential calcium activity regions.
...
So it's adjacent to blend modes in a way.
Specifically the "Multiply" and "Divide" modes.
...
It's a bit of a stretch, of course, but working with these black-and-white images has helped me better grasp what's going on under the cover when I use those same blend modes for art.
Of course, I'm not using them masterfully yet. Really, I'm just using them to add blocky-ish shading to translucent objects.
...I'd show an example, but I can't find any pictures right now.
...
Sorry about the tangent.
I just feel like somehow this contributes to the intimate interconnectivity of everything.
Art and brain research being related on a software level.
#blog#neuroscience#neuroscientist#brain research#internship#art#art software#interconnectedness#blend modes#paint.net#krita#fiji software#imagej2#i dont know why i bother with the imagej2 tag#i highly doubt there's a vibrant imagej2 community active on tumblr#blogging about imagej2 on their blogs.#what a bunch of nerds
2 notes
·
View notes
Text
Imagej for windows

#Imagej for windows mac os
#Imagej for windows update
#Imagej for windows software
#Imagej for windows code
Labs supporting Ukrainian Scientists is an expansive list of labs and PIs offering support at this time.Science for Ukraine provides an overview of labs offering a place for researchers and students who are affected to work from, as well as offers of employment, funding, and accommodation:.It has always been, and continues to be, a project of Wayne Rasband, with the help of many contributors. The original ImageJ has been under continuous development since 1997.
#Imagej for windows software
Personally, I have found the messages of support from scientists everywhere to be truly heartfelt, and I would like to highlight some of the community initiatives I’ve seen here: ImageJ is public domain software for processing and analyzing scientific images, with many derivatives and variants, including ImageJ2, Fiji, and others.
Example data for User Guide Chapter 10 tutorial (4.5 GB tar.We also want to use our platform to highlight the response from the scientific community.
Release notes for the latest version and updates of AIJ.
To latest version and features after download with Help->Update
#Imagej for windows update
Download an installation package of AstroImageJ - then update.Expanded version of the AIJ article on astro-ph with explanations of many functions.Open Access article from the Astronomical Journal (2017) - AstroImageJ: Image Processing and Photometric Extraction for Ultra-Precise Astronomical Light Curves.
#Imagej for windows code
The User Guide may be downloadedĬomments, requests for help and new features, and bug reports should be posted to theĪstroImageJ is ImageJ with astronomy plugins and macros installed.īecause it was necessary to modify the original ImageJ code to enable some of these features,Īnd is distributed under the terms of the some problems with antivirus software under Windows, especially when launched from ImageJ.
Utility programs for use with TESS dataĪdditional details on the user interface are available through astro-ph in referenceġ701.04817v1. NDPITools, software to convert NDPI files into TIFF images.
Annotations are retained when placing apertures.
Nearby eclipsing binary star identification from expected depth versus light curve RMS table for TESS follow-up.
Recently added when you update to the daily build after installation.
Optionally create Minor Planet Center (MPC) format for direct submission of data to the MPC.
Optionally enter reference star apparent magnitudes to calculate target star magnitudes automatically.
Creates color images and with native ImageJ processing power.
Exports analyses formatted as spreadsheets.
Provides a time and coordinate converter tool with capability to update/enhance FITS header content (AIRMASS, BJD, etc.) ClassLauncher -ijjarpath jars -ijjarpath plugins Using JAVAHOME C:UsersDesktopFiji.app/java/win64/jdk//jre Opening Java.
Allows non-destructive object annotations/labels using FITS header keywords.
Includes an interactive light curve fitting interface with simultaneous detrending.
Provides an interactive multi-curve plotting tool streamlined for plotting light curves.
Allows comparison star ensemble changes without re-running differential photometry.
Interactive time-series differential photometry interface with option to run in real-time.
Image calibration including bias, dark, flat, and non-linearity correction with option to run in real-time.
Aligns image sequences using WCS headers or by using apertures to correlate stars.
Provides object identification via an embedded SIMBAD interface.
Displays astronomical coordinates for images with WCS.
Plate solves and adds WCS to images seamlessly using the web interface.
Reads and writes FITS images with standard headers.
Provides an interactive interface similar to ds9.
After installation, the built-in Help->Update option keeps your version current.
#Imagej for windows mac os
It is available for Windows, Mac OS X, and Linux byĭownloading an installation package. These includeĪ versatile image display, time-series stacks, a link to for adding coordinates, built-inĪstroCC to set and time and place, links to Simbad for object identification, and exoplanet model fitting. The latest version has many features to enhance astronomical image processing, especially for photometry. Click for other screenshots of AstroImageJ in use
0 notes
Text
IJMS, Vol. 20, Pages 1780: Human β-Defensin 2 Expression in Oral Epithelium: Potential Therapeutic Targets in Oral Lichen Planus
Human β-defensin 2 (hBD-2) is a potent antimicrobial peptide that participates in defense against invading bacteria. We recently showed that bacterial components and histamine, through histamine H4 receptor (H4R), are involved in the pathogenesis of the potentially malignant lesion, oral lichen planus (OLP). However, the underlying mechanisms remain unknown. We, therefore, investigated the role of hBD2–histamine crosstalk signaling in promoting OLP pathology. Biopsies from OLP and oral tongue squamous cell carcinoma (OTSCC) patients, and healthy controls were used. Two OTSCC cell lines and normal human oral keratinocytes (HOKs) were used. HBD-2 and other targets were mapped by immunostaining and analyzed by ImageJ2 software. The highly sensitive droplet-digital PCR technology and qRT-PCR were utilized to study the clinically derived and in vitro samples, respectively. H4R was challenged with the specific agonist HST-10 and inverse agonist ST-1007. HBD-2 was highly induced in OLP lesions. In contrast, hBD2 expression was attenuated in OTSCC tissues, while very low levels of hBD-2 messenger #RNA (#mRNA) were observed in OTSCC cells. Together with tumor necrosis factor-α (TNF-α), histamine upregulated hBD-2 #mRNA expression in HOKs. Activation of H4R seems to modulate the expression of epithelial hBD-2. These findings suggest the involvement of hBD-2 in the pathogenesis of OLP and may, thus, be harnessed for therapeutic interventions in OLP. http://bit.ly/2X0BCQK
0 notes