#inrange python
Explore tagged Tumblr posts
Visit Tumblr Blog
Explore Tumblr blogs with no restrictions, modern design and the best experience.
Last Seen Tumblr Blogs


Fun Fact
Tumblr has been providing a Korean-language service since 2013.
Text
Python range() loop function use 7 ways.
7 ways to use Python range() loop function. In the range() function have 3 arguments start, stop, and step.
Introduction In this article, will see the “7 ways to use Python range() loop function. range() function is to used with for loop for execute the number of sequence in a given range. In Python 2, the range() and xrange() functions are used for the two different purposes. range() function gives the output into list, and xrange returns object. But in Python 3 the xrange() function is not there…

View On WordPress
0 notes
Text
Invisible cloak

#INVISIBLE CLOAK INSTALL#
#INVISIBLE CLOAK CODE#
Now we need those regions of our main frame where the clock is not present. We have successfully replaced the cloak region with the background. # where our cloak is present in the current frameĬloak = cv2.bitwise_and(background, background, mask=mask)Ĭv2.bitwise_and() applies mask on frame in the region where mask is true (means white). # Apply the mask to take only those region from the saved background First, we need to take the only white region from the background. We want to show our previously-stored background in the main frame where the cloak is present. Here we can see in the frame wherever the green color is detected the mask shows that as white.
cv2.inRange() function returns a segmented binary mask of the frame where the green color is present.
Lower bound and Upper bound are the boundaries of green color.
cv2.cvtColor() function converts colorspace.
Mask = cv2.inRange(hsv, lower_bound, upper_bound) Hsv = cv2.cvtColor(frame, cv2.COLOR_BGR2HSV)
VALUE: Value represents the brightness of the color.
SATURATION: Saturation encodes intensity of color.
HUE: The hues are modeled as an angular dimension which encodes color information.
HSV stands for HUE, SATURATION, and VALUE (or brightness). To detect any color first we have to convert the frame to HSV colorspace. OpenCV reads the frame as BGR colorspace. In this invisible cloak opencv project, we are using green cloth so we have to detect green color.
While capturing the background make sure that you or your clothes don’t accidentally come into the frame.
cap.isOpen() function checks if the camera is open or not and returns true if the camera is open and false if the camera is not open.
2-second delay between two captures are for adjusting camera auto exposure.
cap.read() function captures frames from webcam.
Step 2 – Store a single frame before starting the infinite loop: _, background = cap.read()
To access the camera, we use the method cv2.VideoCapture(0) and set the capture object as cap.
Using import, we imported the required libraries.
Step 1 – Import necessary packages and Initialize the camera: # DataFlair Invisible Cloak project using OpenCV.
Detect the color of the cloth and create a mask.
Store a single frame before starting the infinite loop.
Import necessary packages and Initialize the camera.
Below are the steps to create invisible cloak:
#INVISIBLE CLOAK CODE#
Please download the source code of python invisible cloak project: Invisible Cloak Project Code Steps to Build Invisible Cloak OpenCV Project:
#INVISIBLE CLOAK INSTALL#
“pip install opencv-python” Download Invisible Cloak Python Code To install opencv, run the below command. Python – 3.x (we used Python 3.7.10 in this project).Image segmentation is the process of labeling every pixel in an image, where each pixel having the same label shares certain characteristics. So what is Color Detection and Segmentation in Image Processing?Ĭolor detection is a technique where we can detect any color in a given range of HSV color space. Join DataFlair on Telegram!! Color Detection & Segmentation Stay updated with latest technology trends Try to choose red, green or blue cloth, because these three colors are easier to detect.In good lighting conditions, it works best.If the cloth is green then the background shouldn’t contain any green color) Cloth color should be unique relative to the background.If any other color is visible in our cloak then we have to process the image frame for that color also. Here we are using a green cloth to develop this python project.īecause we are using color detection and segmentation techniques. The cloth should not contain any other color visible. In order to make this project, you’ll need a single-color cloth. We will create the invisible cloak using an image processing technique called Color detection and segmentation. If Yes!! then in this python project, we will develop invisible cloak using OpenCV using which you will become invisible. Free Machine Learning course with 50+ real-time projects Start Now!!Īre you fascinated with Harry Potter’s Invisible Cloak?
0 notes
Text
Data Analysis Tools
Data Analysis Tools - Week 4 ( Testing a Potential Moderator )
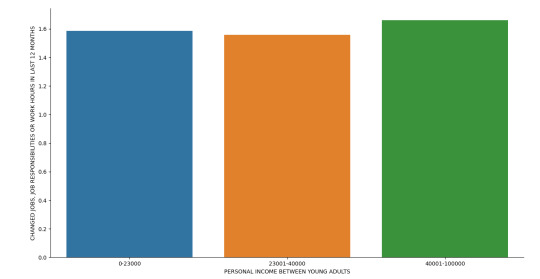
I test my explanatory variable Personal income between young adults and categorized it within 3 levels of income ranges which is from low income young adults ($0-$23000), average income young adults ($23001-$40000) and High income young adults ($40001-$100000) with my response variable Changed Jobs, Job responsibilities or work hours.
These two are both categorical variables therefore, I use a chi-square test of independence to test their relationship:

I have a large chi-square value and a significant p-value which tells us that they both have a significant relationship.
As we can also seen in our frequency table, low income group responded No with over 58% and over 66% between high income group. I have a lower income range in my average income group compared with the other groups that’s why there is a limited counts of respondents within this group. But overall, we can conclude that young adults don’t Change Jobs, Job responsibilities or work hours, as income increases.
To furtherly test the association between my two variables, I’ve added a third variable Had trouble with boss or coworker, which is my moderator that affects the direction and/or strength of their relation.


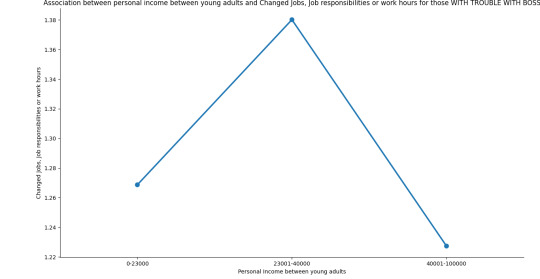
As we can see, the relationship between Personal income between young adults and Change Jobs, Job responsibilities or work hours depends if they Had trouble with boss or coworker or not.
As income increases between average income group and high income group without trouble with boss or coworker, they tend to favor not to Change Jobs, Job responsibilities or work hours.
As income increases between average income group and high income group with trouble with boss or coworker, they tend to favor to Change Jobs, Job responsibilities or work hours.
Therefore, we can say that there is a statistical interaction within these two variables when moderated by our third variable.
My Program:
import pandas as pd import numpy as np import scipy.stats import seaborn import matplotlib.pyplot as plt data = pd.read_csv('NESARC_Data_Set.csv', low_memory=False) #CONVERT TO NUMERIC data['S1Q10A']=data['S1Q10A'].apply(pd.to_numeric, errors='coerce') data['S1Q237']=data['S1Q237'].apply(pd.to_numeric, errors='coerce') #Data for Total Personal Income in the last 12 months (Ages 20-25) (Income between 0=25000$) sub1 = data[(data['AGE'] >= 20) & (data['AGE'] <= 25) & (data['S1Q10A'] >= 0) & (data['S1Q10A'] <= 100000)] B1 = sub1.copy() # recode missing values to python missing (NaN) B1['S1Q237']=B1['S1Q237'].replace(9, np.nan) def INRANGE (row): if row['S1Q10A'] <= 23000: return 1 elif row['S1Q10A'] <= 40000: return 2 elif row['S1Q10A'] <= 100000: return 3 B1['INRANGE'] = B1.apply (lambda row: INRANGE (row),axis=1) #recoding values for S1Q10A recode1 = {1: "0-23000", 2: "23001-40000", 3: "40001-100000"} B1['INRANGE']= B1['INRANGE'].map(recode1) # contingency table of observed counts ct1=pd.crosstab(B1['S1Q237'], B1['INRANGE']) print (ct1) # column percentages colsum=ct1.sum(axis=0) colpct=ct1/colsum print(colpct) # chi-square print ('chi-square value, p value, expected counts') cs1= scipy.stats.chi2_contingency(ct1) print (cs1) # set variable types B1["INRANGE"] = B1['INRANGE'].astype('category') B1['S1Q237'] = B1['S1Q237'].apply(pd.to_numeric, errors='coerce') # bivariate bar graph seaborn.factorplot(x="INRANGE", y="S1Q237", data=B1, kind="bar", ci=None) plt.xlabel('PERSONAL INCOME BETWEEN YOUNG ADULTS') plt.ylabel('CHANGED JOBS, JOB RESPONSIBILITIES OR WORK HOURS IN LAST 12 MONTHS') plt.show() sub3=B1[(B1['S1Q236']== 2)] sub4=B1[(B1['S1Q236']== 1)] print ('Association between personal income between young adults and Changed Jobs, Job responsibilities or work hours for those W/O TROUBLE WITH BOSS') # contingency table of observed counts ct2=pd.crosstab(sub3['S1Q237'], sub3['INRANGE']) print (ct2) # column percentages colsum=ct1.sum(axis=0) colpct=ct1/colsum print(colpct) # chi-square print ('chi-square value, p value, expected counts') cs2= scipy.stats.chi2_contingency(ct2) print (cs2) print ('Association between personal income between young adults and Changed Jobs, Job responsibilities or work hours for those WITH TROUBLE WITH BOSS') # contingency table of observed counts ct3=pd.crosstab(sub4['S1Q237'], sub4['INRANGE']) print (ct3) # column percentages colsum=ct1.sum(axis=0) colpct=ct1/colsum print(colpct) # chi-square print ('chi-square value, p value, expected counts') cs3= scipy.stats.chi2_contingency(ct3) print (cs3) seaborn.factorplot(x="INRANGE", y="S1Q237", data=sub4, kind="point", ci=None) plt.xlabel('Personal Income between young adults') plt.ylabel('Changed Jobs, Job responsibilities or work hours') plt.title('Association between personal income between young adults and Changed Jobs, Job responsibilities or work hours for those WITH TROUBLE WITH BOSS') plt.show() seaborn.factorplot(x="INRANGE", y="S1Q237", data=sub3, kind="point", ci=None) plt.xlabel('Personal Income between young adults') plt.ylabel('Changed Jobs, Job responsibilities or work hours') plt.title('Association between personal income between young adults and Changed Jobs, Job responsibilities or work hours for those WITHOUT TROUBLE WITH BOSS') plt.show()
0 notes