#intermarketer
Explore tagged Tumblr posts
Visit Tumblr Blog
Explore Tumblr blogs with no restrictions, modern design and the best experience.
Last Seen Tumblr Blogs


Fun Fact
Average visit duration of Tumblr.com is 10 mins and 25 secs.
Text
Intermarket Analysis for Indian Traders: A Comprehensive Guide
Intermarket analysis is a powerful method for understanding the dynamic relationships between various asset classes, including equities, bonds, commodities, and currencies. By studying these interconnections, traders and investors can gain valuable insights into broader market trends, assess sentiment, and make well-informed decisions.
For Indian traders and investors, intermarket analysis holds particular significance due to the intricate link between global and domestic markets. With India's growing economy and increased foreign participation, understanding these relationships can provide a competitive advantage.
The Foundations of Intermarket Analysis
John Murphy, a pioneer in intermarket analysis, identified four fundamental relationships:
Commodities vs. Bonds: Rising commodity prices often signal inflationary pressures, which typically lead to higher bond yields.
Bonds vs. Equities: Bond yields influence equity valuations through the cost of capital and expectations for interest rates.
Equities vs. Currencies: Strong domestic equity markets often coincide with a strengthening currency.
Currencies vs. Commodities: Commodities tend to have an inverse relationship with the currency of their primary producer or exporter.
For a deeper understanding, John Murphy's book on intermarket analysis is highly recommended and available on Amazon.
Find Full Blog: Intermarket Analysis for Indian Traders
0 notes
Text
Dollar - Currency Rates Today Intermarket - October 18, 2024
” NEW YORK/LONDON: The US dollar (USD) fell on Friday, taking a breather after five consecutive days of gains, as risk appetite grew after another round of stimulus measures from China that lifted Chinese stocks. Strengthened global equity under the leadership of The greenback, however, was on track for its third weekly gain, currently up 0.6% this week. The dollar index, which measures the…
0 notes
Text
7 Strategic Forex Setups for Swing & Correlation Trades

COT Market Sentiment
AUD – WEAK (5/5)
GBP – STRONG (5/5)
CAD – WEAK (5/5)
EUR – STRONG (3/5)
JPY – STRONG (2/5)
CHF – WEAK (5/5)
USD – MIXED
NZD – WEAK (3/5)
GOLD – STRONG (5/5)
SILVER – STRONG (5/5)
Market Analysis
GOLD
GOLD prices reversed after failing to break the 3,391.26 level, mainly due to the strong U.S. jobs report showing a 185,000 job increase and a +0.4% jump in Average Hourly Earnings. These numbers weakened expectations for near-term Fed rate cuts and bolstered the Dollar. Yet, improving U.S.-China trade relations and geopolitical tensions are providing support for long-term stability.
Technically, GOLD has slipped below the EMA200 but still respects bullish structures. This makes it a prime candidate for long-hold forex strategies, as we anticipate price action testing the lower boundary of the consolidation zone before resuming upward. The MACD and RSI now signal a potential slowdown, which is critical for planning entries with a favorable risk-reward ratio in forex swings.
SILVER
SILVER continues to climb, diverging from GOLD, and acting as an important signal of intermarket currency correlation. As GOLD corrects, SILVER’s rise may indicate that traders are reallocating their exposure. Strong bullish volume and momentum in MACD and RSI suggest a potential continuation higher, though it may stall once GOLD stabilizes.
DXY
The U.S. Dollar is consolidating after Friday's surge. Investors await clarity from U.S.-China trade negotiations. This prolonged indecision is typical ahead of major events, offering an ideal setup for volatility-based forex strategies that thrive in reactive short-term trades following high-impact news.
GBPUSD
The Pound shows strong bullish activity, bouncing off the EMA200 and supported by RSI. Despite MACD's neutral stance, the price action is bullish, favoring trend-continuation trades. For those applying a diversified portfolio approach, GBP is an attractive buy, enhancing forex portfolio diversification with its relative strength and momentum.
AUDUSD
AUD is consolidating just below a previous high, with the 0.64801 level offering firm support. While RSI shows bearish signals, MACD highlights growing bullish volume. AUD’s potential breakout would complement a diversified strategy and fits well within volatility-based forex strategies, given its sensitivity to global risk trends.
NZDUSD
The Kiwi has neared EMA200, offering a potential bounce. However, resistance at 0.60455 remains a challenge. RSI shows bearish pressure while MACD stays neutral. Weakness in cross-pairs like AUD/NZD adds further complexity. Traders monitoring intermarket currency correlation should consider external factors before committing to long trades.
EURUSD
The Euro is range-bound, finding support at the EMA200. MACD shows growing buying interest, but RSI is nearing overbought territory. This pair remains suitable for long-hold forex strategies, especially if a break above the consolidation range occurs on positive trade developments or further Dollar weakness.
USDJPY
Yen pairs are consolidating with a wider-than-expected range. While market speculation increases, we prefer to wait for a structural breakout. No clear directional edge means risk-reward ratio in forex swings must be managed carefully, avoiding overexposure during indecision.
USDCHF
The Franc remains under resistance and shows signs of potential bearish continuation. MACD and RSI confirm growing sell-side momentum. This pair could serve as a tactical short entry within a broader forex portfolio diversification plan, especially given the inverse movement against USD strength.
USDCAD
USD/CAD continues its bearish trend, consolidating between 1.36328 and 1.36612. Resistance is holding back upward moves, while MACD and RSI favor sellers. Bearish structures dominate, offering an opportunity for calculated entries with favorable risk-reward ratio in forex swings.
Final Thoughts
This week's price action across key forex pairs highlights the importance of strategic planning. Whether you're targeting long-hold forex strategies in EURUSD and GOLD, seeking short bursts of action through volatility-based forex strategies, or using intermarket currency correlation to guide entries in commodities and cross-pairs, there are multiple setups with potential.
Equally, combining asset exposure using forex portfolio diversification not only spreads risk but opens the door for smarter trading opportunities. As always, evaluating every trade with a solid risk-reward ratio in forex swings will help preserve capital while maximizing long-term profitability.
0 notes
Text
Decoding the FTSE Chart
Headlines
A FTSE chart visually represents the index's historical price movements.
It aids in understanding market trends and patterns over time.
Various timeframes can be analyzed on a FTSE chart for different insights.
A ftse chart serves as a visual record of the price movements of a particular FTSE index, such as the FTSE 100 (UKX) or FTSE 250 (NMX), over a specific period. These charts are essential tools for market participants, providing a clear and immediate understanding of past performance and prevailing market trends. By plotting price data points, a FTSE chart enables the identification of patterns, support and resistance levels, and overall market direction, which can be valuable for informed decision-making. The ability to customize timeframes allows for both short-term and long-term perspectives on the index's trajectory.
Elements of a FTSE Chart
Typically, a FTSE chart displays price on the vertical axis and time on the horizontal axis. Various chart types can be used, including line charts, bar charts, and candlestick charts, each offering different levels of detail about the price action. Candlestick charts, for instance, provide information about the opening, closing, high, and low prices within each period, offering a comprehensive view of market sentiment. Volume, which indicates the number of shares traded, is often displayed alongside the price chart, providing insights into the strength of price movements. The interplay of price and volume can offer clues about market conviction behind trends.
Analyzing Trends and Patterns
Market participants frequently use FTSE charts to identify trends, which are sustained movements in a particular direction. An upward trend, for example, indicates a period of general price appreciation, while a downward trend suggests a period of decline. Charts also reveal various patterns, such as head and shoulders, triangles, or flags, which are formations that some believe can indicate future price behavior. These patterns can be observed across different timeframes, from intraday charts to monthly or annual charts, offering different scales of analysis. Understanding these visual cues is a fundamental aspect of interpreting market data.
Support and Resistance Levels
Another critical aspect of analyzing a FTSE chart involves identifying support and resistance levels. Support levels are price points where a downward trend might pause or reverse due to increased buying interest. Conversely, resistance levels are price points where an upward trend might face selling pressure, causing it to pause or reverse. These levels are often formed by previous highs or lows and can act as psychological barriers for market participants. The breaking of a significant support or resistance level can be interpreted as a strong signal of a continuing trend or a reversal.
Practical Applications of FTSE Charts
The practical applications of a FTSE chart extend to various aspects of market participation. For those focused on short-term movements, intraday charts provide a granular view of price action, helping to identify entry and exit points. Long-term participants may use weekly or monthly charts to assess the broader market cycle and secular trends. Furthermore, comparing the FTSE chart to other global indices can provide insights into relative performance and intermarket relationships, offering a wider perspective on market dynamics. The visual nature of these charts makes complex data more accessible and understandable.
1 note
·
View note
Text
ملفات NASDAQ لإدراج 21 Shares DogeCoin ETF ، مما يشير إلى قبول التشفير السائد
قدمت NASDAQ نموذجًا 19B-4 مع لجنة الأوراق المالية والبورصة الأمريكية (SEC) لدعم قائمة صناديق تبادل 21Shares Dogecoin (DOGE) الجديدة (ETF) ، وفقًا لما قاله 29 أبريل. تقديم.سيوفر الصندوق المقترح التعرض السلبي للمستثمرين لسعر DogeCoin دون الانخراط في أنشطة تداول المضاربة مثل الرافعة المالية أو المشتقات أو الترتيبات المالية الأخرى.حسب الإيداع:"توفر الثقة للمستثمرين الفرصة للوصول إلى السوق بشكل غير مباشر لـ DogeCoin من خلال حساب السمسرة التقليدية دون الحواجز المحتملة أمام الدخول أو المخاطر التي ينطوي عليها عقد أو نقل DogeCoin مباشرة أو الحصول عليها من سوق Dogecoin."سيكون Coinbase بمثابة حارس أصول 21Shares Doge ETF ، في حين أن مؤشر أسعار التسوية الأمريكي CF Doge-Dollar سيوفر معيار التسعير.أكدت البورصة على قدرتها على مراقبة نشاط التداول ومنع التلاعب ، مشيرة إلى عضويتها في مجموعة مراقبة Intermarket (ISG).وفقًا للشركة ، سيسمح وجودها في هذه المجموعة بالوصول إلى مشاركة المعلومات في الوقت الفعلي مع الأسواق الأخرى المنظمة ، بما في ذلك مشتقات Coinbase.وأضاف:"يتضمن برنامج المراقبة أنماطًا في الوقت الفعلي لحركات الأسعار والحجم وأنماط مراقبة ما بعد التجارة (على سبيل المثال ، خداع ، بمناسبة القريبة ، ping ، التصيد)."وفي الوقت نفسه ، يمثل اقتراح ETF خطوة مهمة للأمام لـ DogeCoin ، والتي بدأت بمثابة مزحة في عام 2013 ولكنها تطورت منذ ذلك الحين إلى أصل رقمي خطير. اليوم ، يحتل DogeCoin المرتبة الثامنة أكبر أصول رقمية ، حيث تبلغ تكلفة السوق حوالي 26.5 مليار دولار.والجدير بالذكر أن 21shares ليست وحدها في طلب الموافقة على منتج يركز على DogeCoin. قدمت Grayscale و Bitwise أيضًا تطبيقات لتصفيات Dogecoin Spot المماثلة.تشير هذه الموجة من الإيداعات إلى زيادة ثقة الصناعة في أن SEC قد تفتح الباب قريبًا على مجموعة أوسع من خيارات الاستثمار في التشفير خارج البيتكوين والإيثريوم.على الرغم من ذلك ، فإن المراهنات المشفرة على منصة التنبؤ اللامركزية polymarket يعتقد لا يوجد سوى فرصة بنسبة 59 ٪ أن توافق SEC على ETF Dogecoin قبل نهاية العام.أحدث ألفا تقرير السوق
0 notes
Text
Certificate in Technical Analysis - Master Market Trends with Empirical Academy
Whether you are a beginner or an experienced trader, mastering technical analysis can significantly improve your ability to navigate the financial markets. In this blog, we will explore the fundamentals of technical analysis and the advantages of taking an advanced certification course.
Key Concepts of Technical Analysis
Price Trends: The market moves in trends — upward (bullish), downward (bearish), or sideways (consolidation). Identifying these trends helps traders make informed decisions.
Support and Resistance Levels: These are key price levels where buying or selling pressure increases, influencing market direction.
Chart Patterns: Traders analyze patterns such as head and shoulders, double tops, and triangles to anticipate price movements.
Technical Indicators: Tools like moving averages, RSI (Relative Strength Index), MACD (Moving Average Convergence Divergence), and Bollinger Bands help traders identify potential entry and exit points.
Candlestick Patterns: Patterns like doji, hammer, and engulfing provide insights into market sentiment and possible reversals.
Why Enroll in a Technical Analysis Certification Course?
A structured certification course provides in-depth knowledge and hands-on experience with technical analysis tools. Here are a few reasons why enrolling in a Technical Analysis Certification Course can benefit you:
Comprehensive Learning: Covers everything from the basics to advanced concepts.
Practical Application: Real-world case studies and live market analysis.
Trading Strategies: Learn tested and effective trading strategies.
Risk Management: Understand how to manage risks and minimize losses.
Industry Recognition: A certification enhances your credibility as a trader or investor.
Advanced Technical Analysis: Taking Your Trading to the Next Level
For seasoned traders looking to refine their skills, an Advanced Technical Analysis Course offers deeper insights. Here’s what you can expect:
Advanced Charting Techniques: Mastering Fibonacci retracement, Elliott Wave theory, and Gann analysis.
Algorithmic Trading: Learning how to automate trading strategies using algorithms.
Market Psychology: Understanding the psychology behind price movements.
Intermarket Analysis: Studying the relationship between stocks, commodities, and forex markets.
Volume Analysis: Learning how to use volume data for better decision-making.
Conclusion
Technical analysis is a valuable skill that can help traders make more informed and strategic decisions in the stock market. Whether a beginner or an advanced trader, taking a Technical Analysis Certification Course can give you the tools and knowledge needed to succeed. If you’re serious about improving your trading skills, explore Empirical Academy’s courses and take the first step towards becoming a professional trader.
Start your journey today and unlock the power of technical analysis!
0 notes
Text
Le site luxtious.com
Le site propose d’investir dans le FOREX. Il s’agit de spéculer sur les différences de cours des monnaies. C’est aussi dangereux que le trading. Nous déconseillons tout investissement dans ce produit. Selon le site, il serait dirigé par une société installée dans les îles Comores. Cela nous rappelle le site wiolin.com qui utilise aussi ce pays comme siège social. Il n’a aucun agrément. Il est à noter que ce site comme wiolin.com a une adresse en Australie.
Le site internet
Il a été créé le 23/10/2023. Nous publions le whois :
Nos recherches
Le site n’a pas l’agrément délivré par l’AMF. Ce simple fait doit vous faire fuir. Malgré cette opacité, nous avons pu collecter des informations restituées ci-dessous. Nous avons regroupé les informations par catégories.
Le téléphone
Le site utilise :
Le numéro 1 800-705-9578
Il a fait l’objet d’une alerte :
Le numéro 44 77 00 16 63 30
Le numéro 07 45 35 24 30
Le numéro 07 45 35 27 50
Les faux noms
Le site utilise :
M. Jonathan DUFAULT
M. Arthur DECOURCEL
M. Sam BARRER
M. Alan FAURE
M. Tommy GAILLARD
M. Olivier PERRIER
Les produits
Il est proposé de spéculer sur les monnaies
Les règlements
Le site utilise :
La société INCOMINGRAD
Elle est utilisée par d’autres sites du réseau “uptos” :wiolin.comlivaxxen.com
La société suisse INNOVATIVE CONCEPTS AG
Elle est également utilisée par les sites :luzuna.comwiolin.comkowela.com
La recovery room
Les victimes sont contactés pour des soi-disant opérations non autorisées. Les mails sont envoyés par le site crs-bureau.com. Il sont signés crs-department.com.
Le site crs-bureau.com a été créé le 10/09/2024. Nous publions le whois :
Le site crs-department.com a été créé le 04/06/2024. Nous publions le whois :
Ils seraient envoyés par une soi-disant Simon MARTINES
Il est utilisé les numéros de téléphone :
44 20 33 32 00 73
44 78 36 12 79 65
Les informations juridiques
Luxtious.com is regulated by INTERMARKETS Corp. Ltd., registered under No. HY00623404, with its principal place of business located at Fomboni, Island of Mohéli, Comoros Union.
La société est bien enregistrée dans cette île des Comores. Nous publions la fiche d’identité de l’autorité de contrôle :
Le dirigeant est un ressortissant monténégrin.
Les conditions générales mentionnent comme adresse d’exploitation MELBOURNE, 14 Mason St, Dandenong 3175, Australia
Il s’agit d’une adresse de domiciliation.
Les informations juridiques
La société indiquée sur le site a obtenu une licence le 13/06/2023.
0 notes
Text
Alchemy Markets Scam Exposed
The offshore broker Alchemy Markets, a member of the Alchemy Group that also comprises the FCA-regulated Alchemy Prime and the Vanuatu-based FXPIG, came under fire from the Spanish CNMV in July 2022. The same brand and trading style are used across various domains and websites, potentially or purposefully misleading customers, as is often the case with these worldwide broker schemes. By acquiring clients from Europe and the UK, the offshore broker Alchemy Markets is breaking relevant regulatory regulations. This is our most recent review.
Short Narrative
While the offshore division of the Alchemy Group uses the name Alchemy Markets and the domain https://alchemymarkets.com, the UK FCA-regulated investment firm Alchemy Prime operates the website with the domain https://alchemyprime.uk. The word “Alchemy” serves as the basis for the used logos. They use the same primary graphic components but make additions (see image on the left).
The webpage for the offshore mutation is poorly designed. Documents such as the KYC Policy, Privacy Policy, and Client Agreement, for instance, are absent. The link goes nowhere; all you get is the error message 404. Additional links on the Alchemy Markets offshore broker website point to the FCA-regulated entity’s Client Agreement.
Furthermore, Alchemy Group uses the FCA-regulated Alchemy Prime Ltd as a payment agent to run the offshore broker FXPIG through Prime Intermarket Group Asia Pacific Ltd, which is registered in Vanuatu and licensed by the VFSC. The FXPIG website states that every company is managed by a single entity.
Gope Shyamdas Kundnani, an Indian national born in 1957, is the owner of Alchemy Group, according to documents obtained through Alchemy Prime Holdings Limited from UK Companies House.
KYC Deposits Prior to
We did not find any limitations on the pre-KYC first-time deposit amount in our payment simulation on October 10, 2022. Through a bank transfer to the multi-currency accounts of the offshore broker scheme at Franx and Blackthorn Finance in the UK, located in Amsterdam, we would have been able to send $50,000 to the scheme.
Alchemy Markets (As claimed)
For each and every one of our clients, Alchemy Markets provides Institutional Access to the Global Financial Markets. Trade your preferred instruments with a variety of free tools and round-the-clock customer assistance, including stocks, forex, indices, cryptocurrencies, and CFDs.
With more than ten years of industry experience, Alchemy Markets offers some of the greatest trading conditions available, including institutional liquidity, spreads, and execution along with zero commission costs and round-the-clock customer service. We offer the most widely used trading platforms, including MT4, MT5, and FIX API, in addition to free resources and research to help our customers along the way.
Do you manage money or are you an IB? Use CopyTrading or PAMM software to trade on behalf of your clients. Charge personalised management and performance fees, keep tabs on your customers with our real-time CRM, and much more with Alchemy markets.
Alchemy Markets offers services related to forex trading. A vast array of assets, including currencies, indices, cryptocurrencies, and commodities, are available to traders across several marketplaces. In contrast, Alchemy Markets offers a free demo account that you can use to explore and become acquainted with their platform. The UK is home to its main office.
Trading Cryptocurrencies
Since cryptocurrencies have such high levels of volatility, trading them is a lucrative and potentially very profitable area of investing. With more than 60 distinct Crypto CFDs, Alchemy Markets has a fantastic offer for any trader looking to take advantage of the competitive conditions and enter into this rapidly expanding sector. 10:1 leverage, 100% STP execution, and costs as low as 0.35% Round Turn are available for cryptocurrency trading. After creating an account with this online broker, cryptocurrency traders can use the MT4 platform for trading.
Wind-Up- A Six-Step Guide to Verifying the Legitimacy of Your Broker
Even though investing has become risk-free, inexpensive, and effective for regular investors, there are still certain cases of brokerage fraud committed to defraud gullible or avaricious investors.
There are numerous methods for determining the legitimacy of your broker. Do your homework in advance at all times.
Avert cold calls, investigate the firm’s and the broker’s or planner’s record for any disciplinary issues, and look for funny stuff on your statements.
If in doubt, there are a few different ways to report anything and ask for compensation.
The most reliable source for finding out about a broker’s status is FINRA.
You may safeguard yourself against doing business with a dishonest broker or other financial professional by following these six steps:
1. Avoid Making Cold Contacts
Any broker or investment advisor who reaches you out of the blue from a company you have never done business with should be avoided. The correspondence may be sent by letter, email, or phone. Invitations to financial seminars that provide complimentary lunches or other goodies in an attempt to win you over shouldn’t fool you into lowering your guard and making rash investments.
The SEC further advises being extremely wary of callers that employ high-pressure sales techniques, advertise once-in-a-lifetime prospects, or decline to provide written information about an investment.
2. Engage in Discussion
You should feel at ease with the individuals offering you guidance, goods, and services, whether you’re searching for a financial counsellor or a broker. Inquire extensively about the company’s offerings and its track record serving customers with comparable demands to your own.
3. Conduct some research
When investigating a financial expert, it’s advisable to start with a straightforward web search using the broker’s and firm’s names. This could include recent announcements, media coverage of purported misconduct or disciplinary measures, client discussions on internet discussion boards, background data, and other specifics. A search engine query for “Lee Dana Weiss,” for example, yields hundreds of thousands of results, one of which is a link to the press release regarding the SEC’s lawsuit against him and his company.
4. Confirm your SIPC membership
Additionally, you ought to confirm whether a brokerage company belongs to the Securities Investor Protection Corporation (SIPC), a nonprofit organisation that offers investors protection for up to $500,000 (including $250,000 in cash) in the event that a company fails, much like the Federal Deposit Insurance Corporation (FDIC) does for bank customers. Always make cheques payable to the SIPC member firm rather than a specific broker when investing.
5. Frequently Review Your Statements
Setting your investments to run on autopilot is the worst thing you can do. Whether you receive your statements in print or online, carefully reviewing them might help you catch errors or even malfeasance early on. Inquire if there are unexpected changes in your portfolio or if the returns on your investments aren’t what you anticipated. Reject complex guarantees that you don’t fully comprehend. Ask to talk with a higher-ranking official if you are unable to acquire clear answers. Never worry that people will think less of you or that you’re a bother.
6. If in doubt, take money out and file a complaint.
Take your money out of the investment advisor if you think there has been misconduct. Next, submit complaints to the same state, federal, and private authorities whose websites you visited when you checked out the financial professional to start with
Bottom Line
Even though the Great Recession is resolved, brokers and investment advisors are still breaking the law. Thus, before entrusting a financial expert with your money, conduct in-depth study and keep a careful eye on your accounts. It is possible for investments to perform below expectations for valid reasons. However, if you start to feel uneasy about your returns or have other problems that the advisor doesn’t address promptly and effectively, don’t be afraid to withdraw your money.
0 notes
Text
luxtious.com
Le site propose d’investir dans le FOREX. Il s’agit de spéculer sur les différences de cours des monnaies. C’est aussi dangereux que le trading. Nous déconseillons tout investissement dans ce produit. Selon le site, il serait dirigé par une société installée dans les îles Comores. Cela nous rappelle le site wiolin.com qui utilise aussi ce pays comme siège social. Il n’a aucun agrément. Il est à noter que ce site comme wiolin.com a une adresse en Australie.
Le site internet
Il a été créé le 23/10/2023. Nous publions le whois :
Nos recherches
Le site n’a pas l’agrément délivré par l’AMF. Ce simple fait doit vous faire fuir. Malgré cette opacité, nous avons pu collecter des informations restituées ci-dessous. Nous avons regroupé les informations par catégories.
Le téléphone
Le site utilise :
Le numéro 1 800-705-9578
Il a fait l’objet d’une alerte :
Le numéro 44 77 00 16 63 30
Le numéro 07 45 35 24 30
Le numéro 07 45 35 27 50
Les faux noms
Le site utilise :
M. Jonathan DUFAULT
M. Arthur DECOURCEL
M. Sam BARRER
M. Alan FAURE
M. Tommy GAILLARD
M. Olivier PERRIER
Les produits
Il est proposé de spéculer sur les monnaies
Les règlements
Le site utilise :
La société suisse INNOVATIVE CONCEPTS AG
Elle est également utilisée par les sites :luzuna.comwiolin.comkowela.com
Les informations juridiques
Luxtious.com is regulated by INTERMARKETS Corp. Ltd., registered under No. HY00623404, with its principal place of business located at Fomboni, Island of Mohéli, Comoros Union.
La société est bien enregistrée dans cette île des Comores. Nous publions la fiche d’identité de l’autorité de contrôle :
Le dirigeant est un ressortissant monténégrin.
Les conditions générales mentionnent comme adresse d’exploitation MELBOURNE, 14 Mason St, Dandenong 3175, Australia
Il s’agit d’une adresse de domiciliation.
Les informations juridiques
La société indiquée sur le site a obtenu une licence le 13/06/2023.
1 note
·
View note
Text
Read book about Global Market written by Taimour Zaman — Founder and chief capital strategist of AltFunds Global
0 notes
Text
The Five Pillars of Crypto Analytics
Cryptocurrency analytics is a multifaceted domain that empowers investors and traders with insights to navigate the volatile crypto markets. Understanding the five main elements of crypto analytics can significantly enhance decision-making processes. Here's a brief overview of these critical components:
Fundamental Analysis: This involves evaluating the intrinsic value of a cryptocurrency by examining its underlying factors, such as market supply and demand, project fundamentals, economic indicators, and the impact of news events.
Technical Analysis: A statistical approach that analyses past market data, price charts, and volume trends to forecast future price movements. It employs various tools like moving averages, RSI, and Fibonacci retracements.
Sentiment Analysis: By assessing the mood of market participants through social media monitoring and investor sentiment tools, sentiment analysis provides a gauge of the market's bullish or bearish tendencies.
Transaction Analysis: This includes scrutinizing the blockchain for transaction values, fees, hash rates, and active addresses to understand the network's health and activity levels.
Intermarket Analysis: This involves examining the correlations between cryptocurrencies and other financial markets to predict how external factors may influence crypto prices.
These elements form the backbone of crypto analytics, each offering unique perspectives and contributing to a holistic view of the market's dynamics. For anyone looking to delve deeper into the world of crypto trading, mastering these analytics components is essential.
For further reading on how to leverage these analytics elements in crypto trading, you may explore detailed guides and educational resources available online.
0 notes
Text
Unlocking Success in ICT 2022 Mentorship The “Unlocking Success in ICT 2022 Mentorship: The Smart Money Guide to The Full ICT Day Trading Model by LumiTraders” is your comprehensive companion to mastering the intricate world of smart money management in the realm of intraday trading and price action. With a wealth of knowledge spanning 33 enlightening chapters, this guide is your roadmap to becoming a savvy trader. In this extensive mentorship guide, you’ll embark on a journey that delves into the very heart of trading, from the fundamental concepts to the advanced strategies employed by seasoned traders. Chapter by chapter, you’ll explore the following key areas: Chapters 1 through 3 provide a solid foundation, introducing you to intraday trading, price action, trade setup elements, and the critical concept of liquidity in trading. Chapters 4 to 11 dive deep into the nuances of market structure, London session insights, order flow analysis, and various trading patterns such as the Three Drives Pattern and ICT Killzones. Chapters 12 to 15 focus on daily biases, consolidation hurdles, economic calendar events, and precision market structure techniques. Chapters 16 to 22 reveal multiple setups within trading sessions, intermarket relationships, and the impact of major events like FOMC and NFP on your trading decisions. Chapters 23 to 30 introduce you to strategies related to new week/day openings, liquidity voids, and utilizing the institutional perspective in your trading. Chapters 31 to 33 take you to an even higher level, discussing central bank dealers’ ranges, high-probability day trade setups, and quarterly shifts. Throughout this mentorship guide, you’ll also find valuable insights on using various techniques, from economic calendar events and daily templates to institutional perception and core content block types. With each chapter building upon the knowledge gained in the previous one, you’ll gradually become proficient in navigating the intricacies of intraday trading. By the time you reach the final chapter, you’ll have a well-rounded understanding of how to make informed trading decisions, manage risks effectively, and capitalize on opportunities in the ever-evolving world of financial markets. The “Unlocking Success in ICT 2022 Mentorship: The Smart Money Guide to The Full ICT Day Trading Model by LumiTraders” is not just a book; it’s your mentor, guiding you through the maze of smart money trading concepts and equipping you with the skills and knowledge needed to excel in this dynamic field. Whether you’re a novice looking to start your trading journey or an experienced trader seeking to refine your strategies, this guide is an invaluable resource that will empower you to navigate the markets with confidence and precision.
0 notes
Text
TEA Business College: Leading the Way in Forecasting Technical Indicators
TEA Business College Patents
Intermarket Analysis
Patent Number: US 8,442,891 B2 Patent Date: May 14, 2013
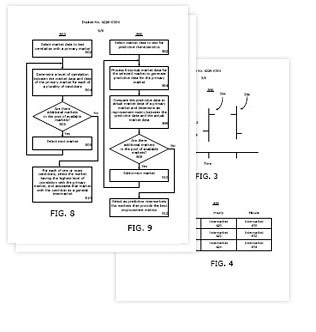
The present invention relates to a method and system for performing intermarket analysis using neural networks. The invention provides a proprietary method and process for selecting relevant markets with the highest correlation in training the neural network from a vast array of available global financial markets, resulting in highly accurate market predictions for each "major" market. The selection process involves identifying "key" intermarkets, "general" intermarkets, and "predictive" intermarkets associated with each "major" market from an available market pool.
The market data for each key intermarket, general intermarket, and predictive intermarket can then be processed to train the neural network, so that when the neural network processes the input data, the neural network generates as accurate output data as possible for each primary market. After training the neural network, all relevant market data for each primary market can be processed through the neural network to predict future market data for each primary market, and then forecast technical indicators can be derived from the predicted future market data for traders to use in making trading decisions.
Calculate forecasted technical indicators.

Patent Number: US 8,560,420 Patent Date: October 15, 2013
The present invention relates to a method and system for calculating forecasted technical analysis indicators. The premise behind technical analysis is that all factors influencing a particular market at any given time are already reflected in the price of that market. Technology-oriented traders employ various computational methods, focusing on the use of various technical studies and indicators to analyze market behavior.
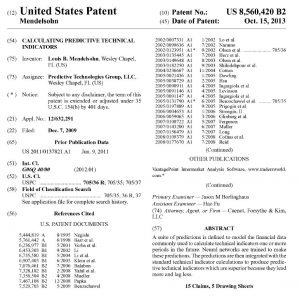
Some common technical indicators include trend indicators, momentum indicators, and volatility indicators. Many technical indicators, such as moving averages, attempt to filter out short-term price fluctuations in order to observe underlying trends. One side effect of doing so is that technical indicators often lag behind the market. Such indicators are referred to as trend-following or lagging indicators. This lagging effect leads to traders reacting to market changes later, resulting in missed profit opportunities and increased risk of losses.
The present invention overcomes this lagging effect by developing methods, systems, and devices for calculating forecasted (leading) technical indicators that do not lag behind the market, based on a combination of historical and forecasted data derived from neural networks applied to intermarket data related to each specific primary market.
In one aspect of the present invention, a method is used to combine forecasted data with conventional technical indicator information using an algorithm to obtain forecasted technical indicators that can guide market behavior, thereby overcoming limitations previously associated with lagging effects.
In the early years, much of Mr. Mendelson's research was done through extensive experimentation and computer power, and was very labor-intensive. Recently, with significant financial investment in the most advanced computer servers and the development of a highly complex proprietary internal research software training platform, the Predictive Technology Group has achieved the automation of much of the mathematical processes associated with executing necessary steps for intermarket analysis and generating forecasted technical indicators, making extremely accurate short-term market predictions possible. This automation is achieved by utilizing servers as intelligent robots.
In the future, the ultimate application neural networks used for training and selecting future trading software programs developed by Mr. Mendelsohn and his research team will require minimal human intervention or judgment decisions. Since Mr. Mendelsohn first began applying neural network pattern recognition to global intermarket data, this complex research methodology has continuously evolved and improved over the past 30 years, costing millions of dollars in research and development. It was the subject of two high-tech patent applications by Mr. Mendelsohn, submitted to the United States Patent and Trademark Office on December 7, 2009, where he first revealed the workings of his research techniques.
0 notes
Text
Hexamethylene Diisocyanate Prices: During the Quarter Ending December 2023 | ChemAnalyst

Hexamethylene Diisocyanate (HDI) prices is a crucial chemical compound used in the production of various polyurethane products, including coatings, adhesives, and elastomers. As an essential building block in these applications, the pricing dynamics of HDI hold significant importance for industries reliant on polyurethane materials. Understanding the factors influencing HDI prices is essential for businesses to make informed decisions and manage costs effectively.
One of the primary determinants of HDI prices is the supply-demand balance within the market. HDI production is largely dependent on the availability and cost of its raw materials, particularly hexamethylene diamine and phosgene. Any disruptions or fluctuations in the supply of these key inputs can impact the overall production of HDI, subsequently affecting its market price. Moreover, demand for polyurethane products, which utilize HDI as a core component, plays a crucial role in shaping its pricing trends. Industries such as construction, automotive, and furniture manufacturing are significant consumers of polyurethane materials, and fluctuations in their demand can directly influence HDI prices.
Global economic factors also exert a considerable influence on HDI prices. Economic growth, particularly in regions with significant polyurethane consumption like Asia-Pacific and North America, can drive up demand for HDI and subsequently its prices. Conversely, economic downturns or recessions may lead to reduced demand for polyurethane products, resulting in lower HDI prices. Currency exchange rates, trade policies, and geopolitical tensions can further impact the international pricing dynamics of HDI, making it susceptible to global economic shifts.
Get Real Time Prices of Hexamethylene Diisocyanate (HDI): https://www.chemanalyst.com/Pricing-data/hexamethylene-diisocyanate-1243
Technological advancements and innovations in HDI production processes can also affect its pricing trends. Efficiencies gained through improved manufacturing techniques or the development of alternative production methods can potentially lower production costs, leading to downward pressure on HDI prices. Conversely, regulatory changes aimed at enhancing environmental or safety standards may necessitate costly modifications to production facilities, potentially driving up HDI prices to cover these expenses.
Environmental regulations and sustainability initiatives also play a crucial role in shaping HDI prices. As governments worldwide impose stricter regulations on the use of hazardous chemicals and promote sustainable practices, manufacturers may incur additional compliance costs related to HDI production. Investments in pollution control equipment, waste management systems, and eco-friendly technologies can increase the overall cost of HDI manufacturing, ultimately influencing its market price.
Moreover, the competitive landscape within the HDI market can impact pricing dynamics. The presence of numerous manufacturers and suppliers vying for market share can lead to price competition, especially during periods of oversupply. Conversely, consolidation within the industry or disruptions in the supply chain may result in reduced competition, allowing producers to exert more control over HDI prices.
Market speculation and investor sentiment also contribute to HDI price volatility. Factors such as speculation on future demand trends, anticipation of supply disruptions, and geopolitical uncertainties can lead to speculative trading activities, causing price fluctuations in the HDI market. Additionally, the integration of HDI prices with other commodity markets, such as crude oil or petrochemicals, can further exacerbate price volatility through intermarket correlations.
In conclusion, the pricing dynamics of hexamethylene diisocyanate (HDI) are influenced by a multitude of factors, including supply-demand dynamics, global economic conditions, technological advancements, regulatory compliance, competitive pressures, and market speculation. Businesses operating in industries reliant on polyurethane materials must closely monitor these factors to anticipate changes in HDI prices effectively. By understanding the underlying drivers of HDI pricing trends, companies can make informed decisions to mitigate risks, optimize procurement strategies, and maintain competitiveness in the marketplace.
Get Real Time Prices of Hexamethylene Diisocyanate (HDI): https://www.chemanalyst.com/Pricing-data/hexamethylene-diisocyanate-1243
Contact Us:
ChemAnalyst
GmbH - S-01, 2.floor, Subbelrather Straße,
15a Cologne, 50823, Germany
Call: +49-221-6505-8833
Email: [email protected]
Website: https://www.chemanalyst.com
0 notes
Text
Whether you are a beginner or an experienced trader, mastering technical analysis can significantly improve your ability to navigate the financial markets. In this blog, we will explore the fundamentals of technical analysis and the advantages of taking an advanced certification course.
Key Concepts of Technical Analysis
Price Trends: The market moves in trends — upward (bullish), downward (bearish), or sideways (consolidation). Identifying these trends helps traders make informed decisions.
Support and Resistance Levels: These are key price levels where buying or selling pressure increases, influencing market direction.
Chart Patterns: Traders analyze patterns such as head and shoulders, double tops, and triangles to anticipate price movements.
Technical Indicators: Tools like moving averages, RSI (Relative Strength Index), MACD (Moving Average Convergence Divergence), and Bollinger Bands help traders identify potential entry and exit points.
Candlestick Patterns: Patterns like doji, hammer, and engulfing provide insights into market sentiment and possible reversals.
Why Enroll in a Technical Analysis Certification Course?
A structured certification course provides in-depth knowledge and hands-on experience with technical analysis tools. Here are a few reasons why enrolling in a Technical Analysis Certification Course can benefit you:
Comprehensive Learning: Covers everything from the basics to advanced concepts.
Practical Application: Real-world case studies and live market analysis.
Trading Strategies: Learn tested and effective trading strategies.
Risk Management: Understand how to manage risks and minimize losses.
Industry Recognition: A certification enhances your credibility as a trader or investor.
Advanced Technical Analysis: Taking Your Trading to the Next Level
For seasoned traders looking to refine their skills, an Advanced Technical Analysis Course offers deeper insights. Here’s what you can expect:
Advanced Charting Techniques: Mastering Fibonacci retracement, Elliott Wave theory, and Gann analysis.
Algorithmic Trading: Learning how to automate trading strategies using algorithms.
Market Psychology: Understanding the psychology behind price movements.
Intermarket Analysis: Studying the relationship between stocks, commodities, and forex markets.
Volume Analysis: Learning how to use volume data for better decision-making.
Conclusion
Technical analysis is a valuable skill that can help traders make more informed and strategic decisions in the stock market. Whether a beginner or an advanced trader, taking a Technical Analysis Certification Course can give you the tools and knowledge needed to succeed. If you’re serious about improving your trading skills, explore Empirical Academy’s courses and take the first step towards becoming a professional trader.
Start your journey today and unlock the power of technical analysis!
0 notes