#like at each level from producers -> consumers -> consumers there's a reduction in biomass and a simultaneous accumulation of pollutants
Explore tagged Tumblr posts
Visit Tumblr Blog
Explore Tumblr blogs with no restrictions, modern design and the best experience.
Last Seen Tumblr Blogs


Fun Fact
28.6 is the average number of monthly visits per US mobile user.
Text
physically restraining myself from going on a massive tangent about ecosystems and food webs in my bloodborne fic
#just envsci major moments :pensive:#bloodborne#i knowwwwww the game's world isn't supposed to make physical sense but like. the relationships between different trophic levels is just.#like at each level from producers -> consumers -> consumers there's a reduction in biomass and a simultaneous accumulation of pollutants#which the body is not capable of purging. your biomass is not equal to the sum of the biomass you consume because a lot is burned for energ#however because your body isn't capable of getting rid of certain pollutants you retain all the pollutants from the biomass you consume#thus the concentration of pollutants increases with each trophic level. thinking about that in relation to. for example.#blood of ebrietas -> blood of yharnamites -> blood of hunters -> blood of vileblood hunters -> annalise#maybe that's why her blood is so corrupted. because of the accumulation of pollutants. ANYWAY.#cloudtalk
6 notes
·
View notes
Text
Cement industry generates 7% of global emissions – Dangote

The cement industry is responsible for seven per cent of global carbon emissions, according to Arvind Pathak, Group Managing Director of Dangote Cement Plc. He said this at the 12th Africa Cement Trade Summit in Abidjan, Cote d’Ivoire, recently. He said, “The cement industry, which provides a vital material to meet Africa’s infrastructure deficit, generates seven per cent of the world’s CO2 emissions as the cement value chain involves the intensive use of energy for raw materials’ mining, crushing, mixing, drying, firing, clinker grinding, packaging and dispatch to customers. “Cement production is an energy-intensive process which consumes thermal energy of about 3.3GJ/tonne of clinker produced, and its electrical energy consumption is in the region of about 90 – 120kWh /tonne of cement.” That, he noted, placed a critical demand on fuel sourcing and controlled energy usage, as almost every stage of the cement value chain produced CO2 emissions, with the bulk of emissions emanating from the firing process during clinker production in the kiln. “From being the world’s largest bulk cement importers to self-sufficiency and now net exporters of cement to other countries, it is, therefore, not unexpected that Dangote Cement is one of the pioneer African companies in decreasing CO2 emissions through a fuel substitution strategy. Through reporting, Dangote Cement responds to the evolving environmental and social challenges by disclosing investment priorities and progress on projects that address the issues. “We also leverage sustainability reporting to ignite market growth. As part of this commitment, we began reporting in 2020 and received an initial rating of C on climate change. As the company’s actions improved, we rose to a B- and then achieved a B+ rating in 2022,” Pathak added. While delivering a paper titled “Utilisation of Alternative Fuels as a Strategy for Sustainable Cement production in Africa” at the summit organised by the Singapore-based Centre for Management, Pathak noted that decarbonisation was no longer an option but a necessity. According to Pathak, the use of alternative fuels, such as municipal, agricultural, and industrial wastes, in the place of fossil fuels, has been effective in emissions reduction. The Dangote Cement boss, who was represented by the Group’s Head of Sustainability, Dr Igazeuma Okoroba, mentioned that alternative fuel as opposed to fossil fuels emitted less CO2 when combusted and that agricultural biomass were known to be carbon neutral. He noted that with the level of cement consumption worldwide reaching 4.2 billion tonnes in 2020 and as the population was projected to grow by 12 23 per cent in 2050 due to rapid urbanisation, the demand for cement would also grow. He, therefore, stressed the need to prioritise the inclusion of alternative fuels in the fuel mix to address climate change concerns. He added that businesses must set clear and detailed short-, medium-, and long-term targets and decarbonisation strategies for each transition target. “Indications are that companies that are likely to thrive in this new wave of climate consciousness are not only decarbonising but also thinking about how to shift the business into faster-growing areas. “Our board maintains oversight over sustainability reporting, which is essential for corporate success. Through this reporting, Dangote Cement responds to evolving environmental and social challenges by disclosing sustainability commitments and actions. “As part of this commitment, we began reporting to the CDP in 2020 and received an initial rating of C on climate change. As the company’s actions improved, we rose to a B- and then achieved a B+ rating in 2022,” he explained. According to Pathak, Dangote Cement is one of the pioneer African companies in decreasing CO2 emissions through a fuel substitution strategy. “This initiative focuses on substituting fossil fuels by using alternative fuels. The consequences of this strategy are already visible. Biomass and alternative fuels are said to have a lower environmental impact compared to conventional fuels but may produce some emissions,” he added. While admitting that the emissions challenge would tarry in the industry for a while, Pathak expressed optimism that the cement industry would continue to contribute to tackling climate change, besides the consequential benefit of CO2 emission abatement. He noted that as urbanisation contributed to an increase in waste generated, Sub-Saharan Africa had been predicted to become the prevalent region globally in terms of total waste generation if the current trend persists. He asserted, “The Stockholm Convention on Persistent Organic Pollutants, which is a global treaty to protect human health and the environment from highly dangerous chemicals, describes the firing hazardous waste in cement kilns as the best available technique for treating dangerous waste because most cement kilns possess the conditions and equipment to treat hazardous waste. This is where Dangote Cement provides the solution to Africa’s waste problem. “Beyond the management of Africa’s waste, AF is a lever to decarbonise cement manufacturing processes. Regarding cost and policies in Africa, other options are improving the energy mix with increased use of transitional fuels, efficiency in cement production, design optimisation, and decarbonisation via CO2 sinks, such as reforestation and renewable energy for power generation.” Read the full article
0 notes
Text
TAFAKKUR: Part 251
THE FUTURE OF SOLAR ENERGY IN THE ENERGY MARKET AND WHY WE NEED IT MORE THAN EVER
RENEWABLE ENERGY RESOURCES
Our current source of energy is mostly fossil fuels such as oil, coal, and natural gas. Fossil fuels are nonrenewable. In other words, they are finite resources and they will diminish significantly in future; hence, they will be very expensive to use and environmentally harmful to recover. In contrast, solar, wind, biomass, hydrogen, geothermal, ocean, and hydro power are renewable energy resources, that is, they are constantly replenished and will not run out. Renewable energy is not only important for our energy needs but also has significant advantages over fossil-based energy resources in the protection of the environment. Besides, the environmental aspect of renewable energy also has a religious dimension, since preservation of the earth and its inhabitants is regarded as a duty for humankind.
Among these energy resources, solar energy is generally used for electricity generation or for hot water heating. It also finds uses in solar cooling, and in direct heating and lighting of buildings and homes. Solar panels are made of photovoltaic (PV) cells. The term “photovoltaic” means “converting light into electricity.” Solar energy technology has been around since the late nineteenth century. Yet, its share in energy production constitutes a very small fraction (less than 0.1%) of production around the world. This stems from the higher cost of electricity generation with solar panels in comparison to use of fossil fuels. In the US, electricity generated from PV cells costs $0.30 to $0.40 per kilowatt-hour while consumers pay only $0.10 per kilowatt-hour to the electric utility companies. Nonetheless, with recent advances in this technology, it will be possible in the near future to decrease the cost and make this technology viable for our energy needs as we face shrinkage in fossil fuels around the globe.
One of the factors that increases cost is the low power-conversion efficiency of current PV cells. The PV cells used in the market are mostly fabricated from silicon crystals and these cells show a power conversion efficiency of 15%. That means, 85% of photons go to waste when harvesting energy from sunlight. In fact, the theoretical limit of light harvesting in silicon-based solar panels is only 31% because of the low band gap of silicon, which only partially absorbs sunlight to form charge carriers in the device. To solve this problem, scientists have utilized three different crystals in a single PV cell to absorb more sunlight, and these studies have yielded a device efficiency of 37%. Just recently, scientists at the National Renewable Energy Laboratory (Golden, Colorado) and Boeing-Spectrolab have achieved a world-record conversion efficiency of 41% by using the same idea, establishing a new milestone in sunlight-to-electricity performance. Although such studies are very promising in this field, when it comes to production cost, these inorganic PV cells are still an expensive technology for power generation compared to fossil fuels.
ORGANIC PHOTOVOLTAICS
An alternative solution to decrease the cost is to use devices with lower power efficiency but a very low cost of production. Organic-based PV materials offer such an alternative with easy and fast production techniques such as solution processing and printing. Conjugated polymers (polymers with alternating single and double bonds in their polymeric backbone) are especially important in this regard, since they exhibit semiconductor properties. The best organic PV cell efficiencies reported in recent years are around 5%. This number must double in order for the cells to be used in solar panels, assuming that the cell displays high photostability and conductivity. Many research groups are now focusing on organic-based solar systems as an alternative technology to their inorganic counterpart.
Although we are all familiar with solar energy, most of us do not know how electricity is produced from sunlight. To show the mechanism for photovoltaic activity, one first should look into an anatomy of a typical organic PV cell which is shown in Figure 1. This cell is based on an organic PV cell. The organic layer is sandwiched in between two electrodes where light absorption and charge separation occurs. Typically, glass is used for support but plastic materials can also be used as alternatives. The anode is usually indium tin oxide (ITO) and the cathode can be aluminum, calcium, gold, or magnesium. The electrodes must be semi-transparent to facilitate light absorption. Specifically designed conjugated polymers are utilized for sunlight absorption, where the wavelength range of absorbed light may vary from ultraviolet-visible to near infrared depending on the material used in the device. The efficiency of the device is determined by the extent of light absorption, efficiency of charge separation, and charge diffusion to the electrodes. The morphology of the organic layer has been found to be very important for device characteristics and cell efficiency. In an organic PV, an electron is promoted from the highest occupied molecular orbital (HOMO) level to the lowest unoccupied molecular orbital (LUMO) level upon light absorption (Figure 2). This transition results in an electron-hole pair which is then separated by the electric field formed by the different ionization energy of electrodes (Φ). Therefore, the electron moves to the cathode and the hole moves to the opposite side. This process causes charge flow between the electrodes and hence electricity is generated in the process.
Despite all the improvements in organic PV technology, current cell efficiencies are still low for electricity generation. The stability of organic PV materials must be improved as most of them are prone to degradation by oxygen and humidity in the air. The large-scale production of organic solar panels is possible, and yet the feasibility of current methods has not been investigated extensively so far.
Solar energy is a clean, renewable resource of energy and is projected to have significant role in the energy market in near future. Funding in the field of solar energy has been increasing in recent years due to the increasing need for energy and the likely reduction of fossil fuels towards the end of this century. Yet, our research efforts are still not sufficient for the advancement of this technology.
IMPORTANCE OF RENEWABLE ENERGY FOR THE ENVIRONMENT: AN ISLAMIC PERSPECTIVE
Solar energy, like other renewable energy resources, is environmentally friendly. Its use should be promoted, as fossil fuels play a dominant role in the increase in greenhouse gases, which are believed to be responsible for the increased rate of global warming and hence climate change. Global warming may cause rises in sea level and changes in the amount and pattern of precipitation. These changes may in turn increase the frequency and intensity of extreme weather events, such as floods, droughts, heat waves, hurricanes, and tornados. Other consequences may include higher or lower agricultural yields, glacial retreat, reduced summer stream flows, and species extinctions. Warming is expected to affect the number and magnitude of the events mentioned above; however, it is difficult to connect particular occurrences to global warming.
In any case, focusing on renewable energy and energy-efficient technologies is one of the best options to secure the future of our planet and all existing forms of life on it. Our effort should not only be due to the expected shortage of fossil fuels in future. Rather, it must be seen as a duty and moral act to save the environment since use of renewable energy resources has little or no negative impact on nature. Religious awareness and guidance in this area is necessary so that each individual may take active part in the protection and development of the environment. Much environmental degradation is due to our ignorance of what our Creator requires of us. People should be educated to realize that the conservation of the environment is a religious duty demanded by God. This fact is expressed in Qur’an in a number of places such as, “Do good, even as God has done you good, and do not pursue corruption in the earth. Verily God does not love corrupters” (Qasas 28:77), “And do not follow the bidding of the excessive, who cause corruption in the earth and do not work good” (Shu’ara 26:151–152), “And do not cause corruption in the earth, when it has been set in order” (A’raf 7:56). Any deliberate damage to the natural environment and its resources is a kind of corruption which is forbidden by Islam.
As Muslims, we should protect and preserve the environment because by doing so we protect the creatures which pray to God and praise Him. Although we do not know how they praise God, the Qur’an clearly points this out: “The seven heavens and the earth, and all beings therein, declare His glory: There is not a thing but celebrates His praise, and yet you understand not how they declare His Glory!” (Isra 17:44). Islam is established on the concept of good (khayr). Since it is scientifically proven that protecting the environment is of great significance for all animals and plants on earth, Muslims should see it as khayr. In the last two verses of chapter Zalzalah (99:7–8), God says, “And whoever does good an atom’s weight will see it then. And whoever does ill an atom’s weight will see it then.”
Protecting God’s creatures and the environment is a duty of humankind because human beings are the “agents” of God on earth. This task cannot be performed by other creatures. Therefore, as the Muslim community we should all commit ourselves to the preservation and to the protection of the environment. Surely, investing in and promoting improvement of the technologies based on renewable energy is one way to go.
#allah#god#prophet#Muhammad#quran#ayah#sunnah#hadith#islam#muslim#muslimah#help#hijab#revert#convert#religion#reminder#dua#salah#pray#prayer#welcome to islam#how to convert to islam#new convert#new revert#new muslim#revert help#convert help#islam help#muslim help
2 notes
·
View notes
Text
Why feeding cows better grass can help fight climate change | Eco Africa | DW
DW: How does feeding cattle Napier grass assist sort out local weather change?
Lutz Merbold: So what we principally do is baseline the environmental footprint of the present weight-reduction plan of animals. In different phrases, we have a look at what they’re consuming after which quantify the local weather influence when it comes to greenhouse gasoline emissions after which we look at choices on the way to scale back these greenhouse gasoline emissions with out hampering animal manufacturing. And one of many issues we’re testing is Napier grass.

Scientist Lutz Merbold from the ILRI
I believe it is a bit extra complicated than simply specializing in Napier grass itself as a result of the entire level is that there isn’t a silver bullet on this, or that that is the very best grass.
It does not actually matter which grass, if it is a good palatable grass of excellent high quality and amount then it may be high-quality.
The purpose is the way you domesticate this particular grass, as a result of that has an impact on how nicely it may be digestible for an animal and the way a lot methane it produces.
So simply feeding Napier grass does not essentially scale back methane emissions, because it depends upon the standard and amount of Napier grass or every other grass which is fed.
So something we do, irrespective of if it is Napier grass or no matter, no matter weight-reduction plan you have been giving which meets the demand of an animal correctly and constantly will enhance productiveness. It’ll additionally enhance methane emissions however not as rapidly because it boosts productiveness and that is the rationale why the ratio [of productivity against methane emissions] comes down.

Fetching fodder for livestock in Lushoto, Tanzania
So by boosting yields from the animal, be it meat or milk, at a larger price than the methane the animal is producing, that is what makes feeding animals high quality forage higher for the local weather. What have the challenges been in Africa?

Scientist Chris Jones from the ILRI
Chris Jones: It is a system the place animals are underfed and malnourished, they usually’re additionally challenged by the varied pests and ailments and due to this fact the productiveness on this a part of the world may be very low in comparison with extra developed methods.
Merbold: We see usually that you’ve Napier grass in a plot of a farmer who does not even fertilize it. However then many farmers let it develop till it is two meters excessive.
However as quickly because it’s that prime it is lots of biomass but it surely’s actually poor high quality, it turns into nearly like a ���woody” vegetation, which may be very tough to eat for a ruminant like a cow.
The standard suggestion is to reap a Napier grass plant each eight to 10 weeks when it is roughly a meter excessive as a result of then you will have the highest quality, probably the most vitality within the plant.
There’s lots of sugars and many others. that are simply digestible for an animal, in order that the animal can truly develop after which, after all, it should additionally produce methane.
But when it simply eats the actually outdated stuff, it should chew on it and chew on it and attempt to digest it. This will truly result in extra methane however much less manufacturing.

Cows’ productiveness will increase in the event that they eat higher fodder, making it higher for the local weather general
So that is partly about growing consciousness amongst farmers in Africa that they should not let their Napier grass develop above a sure top?
Merbold: Precisely, that is one factor. And likewise when you maintain animals, that it is best to even have a forage grass plot cultivated so as to feed your animals, as a result of very often this isn’t the case. The animals typically simply get plant residues from maize or Napier that’s grown on the roadside.
Or then individuals simply ship their cattle right into a forest, which you additionally wish to keep away from as a result of that results in a sure degradation of forests.
However once more land sizes are small and fairly often the land a farmer has is fairly used for the cultivation of maize or some greens, for instance.
Upon getting sure manure quantities out there in your farm, you wish to apply it the place you get the very best income, and that’s in all probability a maize area or a vegetable backyard.

Many farmers favor to develop extra beneficial crops than animal fodder on their land
Even in case you have a Napier plot however you do not fertilize it, your yields go down over time. The essential level is that you just’re at all times taking one thing away. As quickly as you harvest, you are taking nitrogen, as an example, away out of your area.
In the event you do not carry that again to the sphere within the type of manure you are beginning to mine vitamins out of your soil and that’s what is repeatedly occurring in Africa and results in low soil well being.
If you wish to have a cow which actually produces, you could feed it correctly. For that you could domesticate the sphere to forage grasses, you could fertilize that and many others. However that is not occurring all over the place. There’s a lack of manure in some locations. So it isn’t as easy an answer as simply suggesting a grass, you at all times have to take a look at the system.

Scientists say there ought to be extra consciousness of the advantages of rising good-quality fodder
Why is it higher that cattle eat Napier grass fairly than grazing within the forest?
Jones: So it is principally about dietary high quality. The extra productive an animal, the much less emissions per unit of productiveness. So the fundamental factor is that after they graze within the forests they’re principally scavenging or going out in search of a low high quality forage, which is something that an animal will eat.
Whereas what we’d say is that when you plant forage and handle it accurately, you will have way more productiveness per unit space, a a lot larger high quality of feed going into the animal.

Many farmers in Africa cannot afford to place fertilizer on animal fodder, prefering to make use of what little manure they’ve elsewhere
Is there a suggestion that we then give extra land over to Napier grass or related sorts of grass manufacturing and due to this fact clear forests to make approach for higher cultivated Napier grass?
Merbold: You should not clear forests. That is not an choice as these are massive carbon storages and likewise hotspots for biodiversity. However what you are able to do is principally do a greater farm administration. In the long run an improved farm administration means that you can acquire extra out of your land.
If you wish to maintain cattle and also you wish to produce one thing with cattle then you could domesticate the forages and by that you’re enhancing a system and your emission intensities emissions of methane per kilogram of product, corresponding to kilogram of meat, go down. If not, these stay comparatively excessive.
Lutz Merbold is head of the Mazingira Centre on the International Livestock Research Institute (ILRI) in Kenya. Chris Jones is program chief of Feed and Forage Growth at ILRI. The interviews have been carried out by Melanie Corridor.

Toes, paws and claws: Masterpieces of evolutionary design
Misplaced a limb? No drawback! Simply develop one other
The axolotl, often known as the Mexican strolling fish, is an amphibian thought of one of many world’s most uncommon and distinctive species of salamanders. Axolotls do not endure metamorphosis after they attain maturity, like most bugs or amphibians (caterpillars and tadpoles, for instance). They’ve a singular capability to regenerate their organs and misplaced limbs — together with, after all, their toes.

Toes, paws and claws: Masterpieces of evolutionary design
Teeny tiny and additional massive
The foot of the large Northern Luzon cloud rat subsequent to the foot of a pygmy cloud rat. Each animals stay in Southeast Asia, within the Philippines. Technically, they don’t seem to be truly rats however fairly tree-dwelling herbivores. Their habitat and habits is like that of a squirrel. And their toes are very nicely suited to climbing timber, and scuttling away rapidly from predators.

Toes, paws and claws: Masterpieces of evolutionary design
Spiderman — watch out for this scary predator!
Geckos are a kind of lizard which can be discovered on nearly each continent on the planet. They like to eat bugs and spiders for lunch. And so they can transfer identical to Spiderman with their sticky toes. Geckos have microscopic hairs, known as setae, on their toes. The hairs are solely few nanometers in diameter and allow the reptiles to climb up even the slickest of surfaces.

Toes, paws and claws: Masterpieces of evolutionary design
Jesus might have walked on water, however the frequent basilisk can run
When this “Jesus Christ lizard” is fleeing from predators it gathers velocity and runs on its two again toes. Frequent basilisks have massive hind toes with scaly fringes on the edges of the third, fourth and fifth toes. When leaping into the water, pockets of air type between the toes. With every step the pockets are newly crammed. Smaller basilisks can run on water for as much as 20 meters.

Toes, paws and claws: Masterpieces of evolutionary design
No have to run
Water striders need not run to remain above the water, just like the basilisk does. The floor stress retains them afloat. The bottoms of their toes are coated with 1000’s of microscopic hairs — much like the gecko. Tiny grooves between the hairs make the legs water resistant. The water strider likes to hunt smaller bugs on the water’s floor.

Toes, paws and claws: Masterpieces of evolutionary design
An unlikely mountain and tree climber
Goats are humorous creatures, simply as a lot at dwelling on rocky mountains and ice as they’re climbing timber. Their distinctive hooves give them unbelievable grip and traction on even probably the most slippery, rocky terrain. Mountain goats can soar over gaps a number of meters lengthy. They use their distinctive climbing abilities to evade predators, corresponding to bears, mountain lions or wolves.

Toes, paws and claws: Masterpieces of evolutionary design
Dozing in an upside-down world
Bats can see at nighttime utilizing a particular sonar system known as “echolocation.” After they aren’t flying, they spend the day hanging the wrong way up in darkish areas. Their toes are designed as the right climbing instruments, clinging to rocky and woody surfaces. When the wrong way up, the pure weight of the animals holds their claws in a closed place — they do not want muscle mass to maintain their claws tightly gripped.

Toes, paws and claws: Masterpieces of evolutionary design
Wanna hang around with me?
Orangutans are identified for his or her lengthy, curved fingers and toes. Having 4 “palms” is definitely higher than simply two. Their toes and palms are very equally structured and completely designed for climbing up timber, gripping and swinging. Orangutans stay within the rainforest, largely above floor the place they’re protected against floor dwelling predators.

Toes, paws and claws: Masterpieces of evolutionary design
A horse’s hoof — extra than simply one thing to face on
Horses often weigh between 400 and 900 kilograms (880 to 2000 kilos). The hoof helps take in 70 to 80 p.c of the influence of the horse’s weight and velocity, which might stand up to 88 kilometers per hour. The hoof’s onerous outer shell affords wonderful safety for the softer, extra delicate internal hoof, which helps pump blood into the leg and maintains circulation.

Toes, paws and claws: Masterpieces of evolutionary design
Give me a minute — simply placing on my footwear
Their identify in Latin means “100 legs.” However regardless of their identify, centipedes can have various numbers of legs, starting from 30 to 354. Centipedes are members of an invertebrate class known as Arthropods. They are often discovered on nearly each continent besides Antarctica. Their quite a few toes assist them orientate themselves in darkish areas (like antennas), to allow them to keep away from getting caught in tight areas.

Toes, paws and claws: Masterpieces of evolutionary design
Chilly ice and powerful currents? I can do each
Penguins do not get chilly toes. Like different birds, they’ve a high-quality grid of blood vessels that act as a countercurrent heat-exchanger to maintain their toes heat. Their little webbed toes rework into fins when swimming, stiff as a board and powered by their sturdy muscle mass. Mixed with the right torpedo-like form of the penguin, they propel it underwater to between 10 and 20 kilometers per hour.
Creator: Paroda Sem
doc.addEventListener(“DOMContentLoaded”, perform (occasion) { if (DWDE.dsgvo.isStoringCookiesOkay()) { facebookTracking(); } }); perform facebookTracking() { !perform (f, b, e, v, n, t, s) { if (f.fbq) return; n = f.fbq = perform () { n.callMethod ? n.callMethod.apply(n, arguments) : n.queue.push(arguments) }; if (!f._fbq) f._fbq = n; n.push = n; n.loaded = !0; n.model = ‘2.0’; n.queue = []; t = b.createElement(e); t.async = !0; t.src = v; s = b.getElementsByTagName(e)[0]; s.parentNode.insertBefore(t, s) }(window, doc, ‘script’, ‘https://join.fb.internet/en_US/fbevents.js’); fbq(‘init’, ‘157204581336210’); fbq(‘observe’, ‘ViewContent’); }
Source link
The post Why feeding cows better grass can help fight climate change | Eco Africa | DW appeared first on Fikiss Permaculture.
source https://fikiss.net/why-feeding-cows-better-grass-can-help-fight-climate-change-eco-africa-dw/ Why feeding cows better grass can help fight climate change | Eco Africa | DW published first on https://fikiss.net/ from Karin Gudino https://karingudino.blogspot.com/2020/12/why-feeding-cows-better-grass-can-help.html
0 notes
Text
Going Carbon Neutral
In her first significant discourse to Parliament in 2007, New Zealand Prime Minister Helen Clark set out an aspiring arrangement of making New Zealand the world's first ozone harming substance (GHG)- nonpartisan nation. Co2nsensus
Among measures Clark reported incorporate an arrangement that perfect consuming biofuels must record for 3.4 percent of fuel sold in the nation by 2012 to supplant gas and diesel; that each of the 47 government offices ought to utilize vitality effective vehicle, reused paper and ecologically inviting items and structures; and a crusade to enable family units to spare vitality and cut waste. Co2nsensus
"I accept we can seek to be carbon nonpartisan in our economy and lifestyle," Clark focused, albeit no timetable was given to accomplish the objective.
For sure. Furthermore, Kiwis can hurry that change by getting to be carbon unbiased themselves.

Exactly What Is Becoming Carbon Neutral, and How Does One Go About It? Carbon lack of bias alludes to vitality strategies and practices that successfully bring about zero net discharges of ozone harming substances (GHG) which contribute essentially to an Earth-wide temperature boost. Any push to help diminish these gases will balance the impacts of a worldwide temperature alteration.
Carbon nonpartisanship incorporates an entire program which incorporates lessening ozone depleting substance emanations, inquiring about and using sustainable power source assets and counterbalancing whatever discharges one can't abstain from creating. At the individual level, getting to be carbon unbiased requires a profound consciousness of one's effect to nature of their every day exercises.
To Become Carbon Neutral, One Can Do It In Two Major Ways: (1) By lessening one's very own carbon outflow by getting to be vitality proficient and purposely dodging exercises that emanate carbon gases and (2) by balancing whatever is created by some carbon-diminishing exercises some place far and wide.
The subsequent technique, counterbalancing, can be acknowledged by maintained a strategic distance from discharges and carbon sequestration. One can abstain from radiating GHG by utilizing less petroleum derivative and changing to inexhaustible sources, for example, geothermal which is locally bottomless, for power age.
Carbon sequestration includes evacuating a proportional measure of CO2 from the environment and putting away it for a given time. Recommendations on carbon sequestration run from catching the carbon dioxide emanations of coal power plants, (for example, the Huntly coal power station), exploring on how woodlands retain GHG and improving field lands the board to build soil take-up of these gases.
Instances of carbon counterbalancing tasks are the accompanying: Solar power (accommodating own capacity utilizing sun powered boards to abstain from purchasing power from the network), wind control (putting wind turbines rather than fuel-based producing plants) , hydroelectric power, eco-friendliness, fuel substitution (changing to a fuel which discharges less carbon), co-age (creating power and warmth from one source), effective lighting (supplanting glowing lights with minimal fluorescent lights), materials exchanging (swapping input materials for mechanical procedures to those with less carbon emanation), development of green structures (which are vitality and materials proficient), green vehicle (utilizing LPG as fuel and driving cross breed autos), use of modern waste (e.g., reusing), biomass control age (copying ranch buildup to create control), reforestation and proficient field the executives (e.g., between editing with plants that improve the carbon stockpiling limit of the dirt).
Efficient power Energy Projects Large-scale counterbalancing exercises regularly emerge in vitality or natural assurance activities actualized through the alleged Clean Development Mechanism (CDM) under the Kyoto Protocol. The instrument is basically exchanging a foundation's abundance carbon outflows with another's surplus to prompt a net zero wholes.
Under this component, these green activities create supposed carbon credits as Carbon Emission Reduction (CER) endorsements which are properly guaranteed by autonomous accreditation bodies. The authentications would then be able to be exchanged a carbon market, for example, the European Union Emission Trading Scheme (EU ETS), the Primary CDM showcase and the Chicago Climate Exchange (CCE) - the last being the biggest intentional carbon advertise (see underneath).
The age of CERs makes financing environmentally friendly power vitality extends in many creating nations conceivable which generally couldn't have been suitable.
In 2007, the volume of carbon exchanging the managed markets totaled 2,918 metric huge amounts of CO2 comparable ( the other ozone harming substances are changed over to proportionate CO2) with an estimation of US$ 66.1 billion, up from 1,702 mt CO2eq worth US$ 40.1 billion out of 2006 (Source: Ecosystem Marketplace, New Carbon Finance, World Bank ). Europe and Japan have been the biggest purchasers and China the biggest dealer.
The buyers extend from companies with significant carbon impressions that are hoping to limit their money related dangers in front of fixing guideline to green venture reserves.
The CERs from littler tasks like rustic breeze power and co-age can be exchanged a deliberate carbon advertise which is still little however is developing at an a lot quicker rate than its directed brethren. In 2007, the worldwide deliberate market was worth US$ 331 million, pointedly up from US$ 96.7 million the earlier year.
Straightforward Steps To Be Carbon Neutral At Home IN THE MEANTIME, one can begin trekking the way to getting to be carbon nonpartisan right inside the home. A portion of the things one can do include:
Pick home apparatuses, for example, fridges, clothes washers and dishwashers with high productivity appraisals.
Utilize a bike for short separation travel rather than the vehicle. It is likewise useful for your wellbeing.
Supplant radiant and incandescent lights with low vitality smaller fluorescent lights (CFLs)
Improve the protection of your home to keep the warmth longer during winter.
Reuse materials however much as could reasonably be expected.
Try not to leave machines and lights turned on when no one is utilizing them.
Save water.
In the event that fitting, introduce your own sustainable power source frameworks, for example, sun oriented boards and wind turbine in your home.
Going carbon impartial not just lifts one's soul realizing that one is adding to preserve the earth yet in addition spares genuine bucks.
0 notes
Text
Shanghai leads battle against China's rising mountain of trash
https://sciencespies.com/environment/shanghai-leads-battle-against-chinas-rising-mountain-of-trash/
Shanghai leads battle against China's rising mountain of trash

Every day, Shanghai produces around 26,000 tonnes of garbage –- equal in weight to the Statue of Liberty
Nie Feng used to toss his rubbish outside his Shanghai flat without a thought while rushing to work, but saving China from a garbage crisis now requires him to consult a complex diagram each morning.
On July 1, Shanghai launched China’s most ambitious garbage separation and recycling programme ever, as the country confronts a rising tide of trash created by increasing consumption.
But the programme is the talk of China’s biggest city for other reasons as well: confusion over rules and fines for infractions, and thousands of volunteers inspecting citizens’ private garbage each day.
Nie examines a wall-sized diagram saying fish and pork bones must be separated from each other, and from the plastic bag he carries them in.
“It’s for the good of our homeland, but we keep making mistakes,” said Nie, a trading company staffer, laughing as he struggled to separate the bag’s contents into various bins.
“We have to get this right before the fines really start.”
Shanghai is piloting a programme set for eventual nationwide adoption in what would likely be the world’s largest waste separation and recycling scheme—and it is desperately needed.
With its 1.4 billion consumers, China is becoming swamped by trash. Every day, Shanghai’s 25 million people alone produce around 26,000 tonnes –- equal in weight to the Statue of Liberty.

On July 1, Shanghai launched China’s most ambitious garbage separation and recycling programme ever
The issue is straining municipal services nationwide and prompting unrest.
Growing anger
Last week authorities in the central city of Wuhan sent riot police to quell protests by thousands of citizens against construction of a waste incinerator.
China is spending billions of dollars on waste-to-energy incineration plants across the country, but repeated protests have flared over fears they will emit toxins. Wuhan has shelved its plan, for now.
China produced just 30 million tonnes of trash in 1980, but that soared to 210 million in 2017, according to World Bank figures.
That is still less than the world’s trash titan, the United States, which produced 258 million tonnes. But China is gaining fast and the World Bank predicts Chinese garbage could reach a staggering 500 million tonnes annually by 2030.
Several factors are blamed, including rapid growth and the Communist Party’s ongoing push to develop a domestic consumer economy to lessen reliance on the outside world.

Authorities say strict sorting is crucial, making it far easier to process waste
Led by the likes of Alibaba, Chinese e-commerce has exploded, producing billions of parcel deliveries annually with their associated packaging.
The government indicated its alarm last year by banning certain imports of foreign waste that it used to accept for years for recycling, a move that has up-ended global garbage flows.
“We need a really big push and I think the government realised that. There is really a sense of urgency,” said Alizee Buysschaert, founder and director of environmental consultancy Zero Waste Shanghai.
With a phased national roll-out set to gain pace next year, Shanghai’s experience has become one of the most talked-about topics in the country, though sometimes for the wrong reasons.
Critics have taken aim at seemingly contradictory sorting guidelines and the limited daily hours during which dumping is allowed, which causes problems for those with irregular schedules.
Chinese media reports also have indicated that a lot of garbage was still entering bins unsorted.
Government officials declined AFP interview requests.

The World Bank predicts Chinese garbage could reach a staggering 500 million tonnes annually by 2030
‘So much rubbish’
Previous city-level sorting schemes have fizzled, but Buysschaert sees a difference this time.
“The big shift is that it is much more centralised and it’s incentivised now. That’s really a game-changer because now everyone is talking about it and everyone is involved and on their toes,” she said.
Authorities say strict sorting is crucial, making it far easier to separately process recycled items, hazardous waste, compost and biomass.
But tempers have flared. Chinese media said a 33-year-old woman was detained last week for choking a volunteer sorting inspector unconscious during a rules dispute.
Fines range from 200 yuan ($29) for household infractions to 50,000 yuan for businesses, though authorities are going easy on imposing them for now.
The scheme is a business opportunity for others, with start-ups offering app-based garbage collection and sorting services.

With its 1.4 billion consumers, China is becoming swamped by trash
True to form, the Communist Party is pushing obeisance via a public campaign larded with red banners emblazoned with revolutionary exhortations such as “storm the citadel of trash sorting.”
“We weren’t used to it at first. It was really inconvenient,” said 67-year-old pensioner Zhou Shenzhu.
But she has been won over by a noticeable reduction in flies and odour since sorting started, she says.
“The propaganda on television says we face great harm if we don’t separate.”
“Shanghai has lots of people, and so much rubbish. So much!”
Explore further
Getting to zero: the Japan town trying to recycle all its waste
© 2019 AFP
Citation: Shanghai leads battle against China’s rising mountain of trash (2019, July 14) retrieved 14 July 2019 from https://phys.org/news/2019-07-shanghai-china-mountain-trash.html
This document is subject to copyright. Apart from any fair dealing for the purpose of private study or research, no part may be reproduced without the written permission. The content is provided for information purposes only.
#Environment
0 notes
Text
Blog No. 7
The focus of this week is sustainability as it has to do with environmental sociology/demographics with respect to population and consumption as well as sustainable urban planning, design, and engineering of cities (Prof’s PowerPoint). In its chapter on how the human population has impacted the environment, Miller discusses the carrying capacity of our planet to support and sustain an increasing population of humans, as well as the non-human species and ecosystem services that an increasing population will only become even more reliant on. It's not as simple as this; however, because carrying capacity only relates to how many people the planet can support sustainability. A better and more realistic term for this is cultural carrying capacity, which is “the maximum number of people who could live in reasonable freedom and comfort indefinitely without decreasing the ability of the earth to sustain future generations” (Miller 2012, 128). This takes into account the mass differences in comfort levels and livelihoods across the planet and somewhat equalizes the concept by adding the notion of “reasonable freedom,” meaning that a change would and will have to occur in the top consumer countries who are enjoying an unreasonableamount of freedom and comfort in how they use/waste resources.
This is explicated perfectly in the “More Than Money - What Is ‘The Good Life’” parable where a business man encounters an independent fisherman and explains to him how he could expand his practice into a profitable Capitalistic enterprise and ultimately become very rich, of course at the expense of his leisure time spent with his family until he can finally retire. The fisherman rejects this idea on the basis that the eventual payoff decades from now is exactly what his life is like now, after he spends a few hours a day fishing to support this payoff. This is in contrast to the Capitalist route which demands that one makes work their entire purpose, and identity so that they can enjoy their life down the road, only after they’ve completely exhausted their bodies (Koehler 2008). A result of such Capitalistic greed was that people seemed to forget that they really don’t need much to survive and be happy. Such is part of the reason for the massive gap in quality of life between the developed and developing countries, that while history shows that people can thrive simply off the land, resources and subsistence labor, capitalism has used up a superfluous portion of these resources, which are also impacted by climate change which not only destructs these resources through natural disaster but can pose challenges to agriculture that relies on climate consistency.
One can literally watch the world population approach 8 million using the “Current World Population” tool (Worldometers). One can also watch the U.S. population increase which is obviously much slower with only one birth every eight seconds but does give insight into why it is important to help fuel the development of underdeveloped countries in order to stunt population growth (Census Bureau). The “World Death Clock” website estimates that because the world population growth rate is so disproportionate to the death rate, we are on track to double the population every three decades (MD India). Miller describes the three most effective methods of slowing this growth: “reducing poverty, elevating the status of women, and encouraging family planning” (Miller 2012, 126). All three methods require that we work to increase the livelihoods of impoverished countries that are largely experiencing the oppositeextreme of what is an unreasonable level of comfort and freedom. In other words, developed countries are for the most part too comfortable and will need to make sacrifices in order to level the global playing field. This relates to the political and economic movement known as “Degrowth” which, in its response to the “limits-to-growth” dilemma we are facing, advocates “for the downscaling of production and consumption - the contraction of economics” on the basis that “overconsumption lies at the root of long term environmental issues and social inequalities” (Wikipedia 2019).
In response to Miller’s Critical Thinking Question #9 of Chapter 22 on the three most important components for dealing with urban growth and sustainability in more developed and less developed countries, I would argue that two of the three can apply to both, the first component is low cost/high incentive green methods. In more developed countries this would involve giving better tax breaks/rebates to businesses and individuals for installing things like solar panels and green roofs and in less developed countries for installing things like clean cook stoves that use zero-waste biomass instead of wood and charcoal which pollute and burn faster. The second component would be more efficient and accessible mass transit because in more developed countries this would reduce the cars on the road and in less developed countries it would make it easier for people to either live in or commute to cities where there are more job and education opportunities. The last component for more developed countries would be to implement stricter building/energy codes, regulations and penalties to encourage buildings to modernize and install more environmentally friendly appliances. The last component for less developed countries would be to create more compelling pull factors to the city to reduce reliance on subsistence labor and agriculture such as the promise for better jobs, education, and health care.
Artist Chris Jordan’s two projects, “Running the Numbers: An American Self-Portrait” and “Running the Numbers II: Portraits of Global Mass Culture” depict consumerism in a very effective way by employing our visual senses to communicate just how much we over-consume. One of the most effective pieces, in my opinion, is the “Caps Seurat” which combines 400,000 plastic bottle caps to recreate Seurat’s beloved, “A Sunday on La Grande Jatte” or the painting of Venus that is made out of 240,000 plastic bags (Jordan 2011). My internship does something by way of environmental art where, each of its individual city branches create something representative of that city out of recycled material, for example, Seattle and salmon, and for the New York City branch we are planning to create a blue bird, which is the New York State bird. Another visual project is “The Impossible Hamster,” a comical yet effective video that describes how Capitalist economies have grown to unnatural sizes and as a result are using up the world’s resources (New Economics Foundation 2018). This is in stark contrast to another economic movement known as the “Steady-State Economy” which is capitalist by nature but instead of continually increasing its capital, it instead has a constant stock of capital relative to a constant population size, which prevents the economy from growing (Wikipedia 2019).
Unfortunately, capitalist economies do not function this way and are actually quite oppressive as is furthered by the video which explains how such an economic system fuels inequality and depletes the environment, its central message being that a reformed and improved economic system that reduces poverty is essential to reversing climate change. If reducing poverty is in the best interest of the environment then it is also in the best interest of the systems and institutions that depend on the environment, such as the economy (New Economics Foundation). The “Visualizing a Plenitude Economy” video also discusses this; specifically, that increasing workplace conditions such as reducing work time by hiring more people will benefit the economy as it will not only reduce poverty but increase worker happiness and concentration which fuels productivity (Center for a New American Dream 2011). As discussed last week, reducing poverty by giving more people jobs will benefit the environment as it will also slow down population growth because, for example, there will be less need for families to have so many children for the purpose of more subsistence labor. Pictured below is an excellent visual representation of the inverse relationship between poverty and development of some of the wealthiest and most developed countries. It should be reiterated that such development is rooted in a reduction in the population growth rate due to methods such as education for women and family planning.
(Oxford 2013)
Miller’s chapter on city sustainability explains the advantages and disadvantages of urbanization, which is “the growth of urban and suburban areas” (Miller 2012, 587). The main advantage of urbanization is that cities promote economic development and innovation, and thus create jobs. Moreover, people who live in cities tend to have longer life spans and lower infant mortality rates as well as better access to “medical care, family planning, and education.” Cities also tend to have more effective and comprehensive recycling programs and “concentrating people in cities helps to preserve biodiversity by reducing the stress on wildlife habitats.” Lastly, cities have a lot of energy conservation opportunities given that in many cities it is often faster and more convenient to take mass transit, walk, or bike than to drive. However, cities also have disadvantages, most notably their large ecological footprints. Miller writes, “although urban populations occupy only about 2% of the earth’s land area, they consume about 75% of it resources and produce about 75% of the world’s climate changing CO2 emissions from human activities” (Miller 2012, 593). This calls for a greater emphasis of sustainability and sustainable urban design in city infrastructure and agendas.
For example, former mayor of New York City Michael Bloomberg’s PlaNYCwas a strategic plan that joined several agencies together to help create a greener city by combatting climate change through mitigative methods such as reducing the city’s carbon emissions by 30% by 2030 in accordance with the Paris Agreement. The plan was in part a response to the New York City Panel on Climate Change’s statement that announced that the city could expect an increase of at least one million people over the next two decades. In contrast, its adaptivemeasures are geared more towards promoting resiliency through sturdier infrastructure by repairing and improving bridges, mass transit, buildings, etc. Another project implemented byPlaNYCdiscussed in an Environmental News Network article reduces the waste from food that it sent to landfills by converting it into energy to heat homes. The article explains, “The biogas by-product will be converted into renewable natural gas for both residential and commercial use through a partnership with National Grid” (ENN 2013). The second partnership is with the Newtown Creek Wastewater Treatment Plant which adds the organic food waste to sludge to facilitate the production of biogas which is then turned into a renewable product, this is a prime example of a totally sustainable and zero waste way to implement sustainability into a city’s agenda. To better understand how this project significantly reduces emissions, the article explains that it is the “equivalent of removing nearly 19,000 cars from city streets” (ENN 2013). PlaNYC is still very much relevant, although its name was changed to OneNYC and updated to reflect the state of the environment today under current Mayor De Blasio (Wikipedia 2019). Another example of a resiliency project is Transition Townwhich promotes self-sustainability within largely cities “to reduce the potential effects of peak oil, climate destruction, and economic instability” (Wikipedia 2019). Under the current administration, I think it's becoming increasingly important that cities and states implement protective measures again potential or future climate disaster in the event that the federal government fails to provide sufficient aid, like it has with other countries who have faced recent devastation (e.g. Puerto Rico).
Word Count: 1894
Discussion Question: Given that many of the world powers experienced their development well before the world population skyrocketed, do you think it’s feasible for less developed countries today to undergo the same process with as much ease, especially while simultaneously contending with unprecedented environmental challenges?
Work Cited
Miller, Tyler G., and Scott Spoolman. "Chapter 6: The Human Population and Its Impact." Edited by Scott Spoolman. In Living in the Environment. 17th ed. Belmont, CA: Brooks/Cole, Cengage Learning, 2012.
"Current World Population." United Arab Emirates Population (2018) - Worldometers. http://www.worldometers.info/world-population/.
"U.S. and World Population Clock." Census Bureau QuickFacts. https://www.census.gov/popclock/.
"World Death Clock." Medindia. https://www.medindia.net/patients/calculators/world-death-clock.asp.
"The Impossible Hamster." Vimeo. November 14, 2018. https://vimeo.com/8947526.
"An Economy for the People, by the People." New Economics Foundation. February 13, 2019. https://neweconomics.org/about-us/.
Koehler, Berrett. YouTube. August 08, 2008. https://www.youtube.com/watch?v=k7JlI959slY.
Dream, New. YouTube. September 15, 2011. https://www.youtube.com/watch?feature=player_embedded&v=HR-YrD_KB0M.
"Steady-state Economy." Wikipedia. February 18, 2019. https://en.wikipedia.org/wiki/Steady-state_economy.
"Degrowth." Wikipedia. February 08, 2019. https://en.wikipedia.org/wiki/Degrowth.
Jordan, Chris. "Running the Numbers: An American Self-Portrait." Chris Jordan Photography. 2011. http://www.chrisjordan.com/gallery/rtn/#caps-seurat.
Jordan, Chris. "Running the Numbers II: Portraits of Global Mass Culture." Chris Jordan Photography. 2011. http://www.chrisjordan.com/gallery/rtn2/#venus.
Van Buren, Edward. “Prof’s PowerPoint Notes.” https://drive.google.com/file/d/0BzKbjVLpnX0RMjVGYUwwZlBXa28/view
Miller, Tyler G., and Scott Spoolman. "Chapter 22: Cities and Sustainability." Edited by Scott Spoolman. In Living in the Environment. 17th ed. Belmont, CA: Brooks/Cole, Cengage Learning, 2012.
"PlaNYC." Wikipedia. January 01, 2019. https://en.wikipedia.org/wiki/PlaNYC.
"Transition Town." Wikipedia. February 11, 2019. https://en.wikipedia.org/wiki/Transition_town.
Cheeseman, Gina-Marie. "New York City to Use Food Waste to Heat Homes." Environmental News Network. December 27, 2013. https://www.enn.com/articles/46829-new-york-city-to-use-food-waste-to-heat-homes.
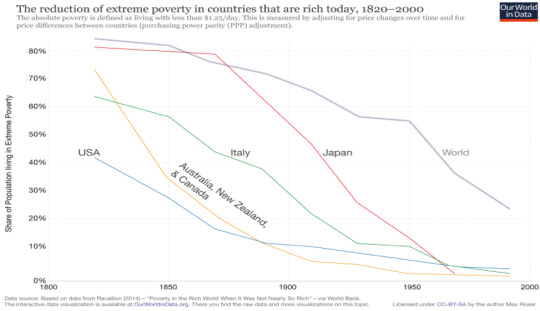
Roser, Max, and Esteban Ortiz-Ospina. "Global Extreme Poverty." Our World in Data. May 25, 2013. https://ourworldindata.org/extreme-poverty.
0 notes
Text
Ecosystem: Energy Flow


Life is dependent on energy from the sun. The organisms that use the chemical as it flows all life forms, except for roads , high-energy organic nutrients are obtained directly or indirectly from photosynthesis. The solar energy that reaches the Earth's surface of 1% less than 1/10 of a portion of the products of photosynthesis to be converted to total primary (first) gets the name of the production. Plants, the total production is 15-20% of their respiration are used. The rest is used to make new textures, and net primary production is known as. Per year approximately 6X10²⁰ gr. kal energy as predicted, the total biosphere net primary production, heterotrophic forms the basis for the energy of life in the world. Animals fungi protists bacteria and heterotrophic organisms, which are almost all of the energy they need ototrophic and most of the organisms, other organisms, called detritus or other ototrof who heterotrof the rotten parts (waste products, or dead tissues) by eating. In a community of energy that can be moved an array of organisms, the food chain is called in the usual way. In most real communities, there are many complex food chains together as in the past. These together they are the foundation of a community's food web. However, a food chain or food regardless of how complex of a network can be how it is always that you have certain basic features. Every food chain or food web for the community ototrophic the producer organisms (usually plants Yesil) at each level of each food web begins with and or chain, usually scavenger organisms such as bacteria and fungi (decomposer) called parser ends with. Also centipedes, earthworms, termites, flies, lobsters, mussels and some fish feed on detritus and partially release. All heterotrof like scavengers, they release CO2 and NH3 which can be reused by manufacturers such as simple substances. The connections between the parser and shows the diversity of manufacturers. Directly to manufacturers or producers may be processed by the parser after the death of the primary consumers which are herbivores, they can be eaten by; terrestrial plant production is about 10% is consumed in this way. In contrast, herbivore, or directly exposed to the impact of the parser may or may not be carnivores, parasites, carrion eaters, and are eaten by secondary consumers like. Ecology scientists, community, the steps of feeding in the food chain, trophic levels

denote. Thus, all manufacturers together the first traffic level; primary consumers (herbivores) at the second trophic level; herbivore-eating carnivores form the third level, traffic. A community of species at each trophic level to another vary. Apart from that, many types of different food, such as omnivores fed a single food within a network the level of traffic the level of traffic that might be functional in two or more categories are not immutable themselves. For example, seeds, herbivorous insects, carnivorous insects, and a breed that eats tit, second, third, and fourth works on the traffic levels. In spite of this complexity, the concept of trophic levels, the community retains the value in the analysis. At each successive trophic level, there is loss of energy from the system. This loss, in part, the biomass of the consumer population is the lack of capable of obtaining more energy from a piece of; partly, omissions assimilasyon capabilities (e.g., ruminants and termites except for most of the herbivores can't metabolize the cellulose wall of plant cells); partly in accordance with the second law of thermodynamics, respiratory, and as a result in the form of heat due to the loss of energy (usually heat energy loss in each Energy Transfer that can be used as required. As a result, only a part of the energy at one trophic level, can be transferred to other levels. The fraction of the transmitted energy, the most effective animals to consume other animals ektotermik 35% with a high rate of the plants, and some small endothermic animals that fed on 0.1% to the bottom of a falling rate varies between. Backwards, almost all of the remaining energy, the parser, or is lost as heat. Therefore, less of a community the herbivores feeding on plants; a herbivore carnivore shows a less than efficiency, and so on. Thus, the distribution of productivity within a community, at the base of the first trophic level (producers) at the top of the latest consumer can be represented by a pyramid where the level of traffic. From a traffic efficiency quickly drops to the next level, because in a food chain are more rare than four or five digits; the fifth digit, the first digit in the efficiency of 0.0001% is more than rarely, and a top nutrient density of a new stage of support available is very low. The pyramid of productivity (also called the pyramid of energy flow) is a feature of all ecosystems. Many other features of ecosystems, energy flow in the system is associated with, since the pyramid may be reduced in accordance with the model; however, results may deviate from the model, because secondary productivity of the distribution pyramid. The pyramid of biomass is an example. In general, each successive traffic steps means that less biomass can be supported at each level of energy reduction. Therefore, the total mass of carnivores in a particular community is always less than the total mass of herbivores. However, traffic between the different steps of a community type, body size, growth rates and life lengths of the model pyramid, the biomass is important in determining whether those communities will cover. For example, manufacturers with high metabolic and reproductive rates, small algae and some aquatic communities, at a certain time, beyoba consumers, manufacturers can be much more; the total mass of all the algae that live but a year of living in that year will be larger than the total consumer mass.

The mutual relations between organisms at different traffic levels, it can have some effect on the size of the organism. Therefore, carnivores than herbivores usually are bigger. Secondary carnivores, feed on primary carnivores are larger than they usually where. In this case, the total biomass, consecutive traffic levels tend to decrease, so if the size of individuals increases at each level if it should decrease the number of individuals (too many parsers are excluded from this).As a result, some communities n herbivores, plants from herbivores and carnivorous individuals that number less than the pyramids show. As we mentioned earlier, killer whales, such as wolves, lions or top predators (predators at the top of the food chain) they can not hunt over both of their types. they make a very wide distribution, and because these animals are very few; and very little energy to find and hunt their own breeds. However, many community does not have a pyramid of numbers. For example, biomass is less, because a much greater number of consumer the insect is close to the plant manufacturer. Because plant-eating insects, feed on plants are usually much smaller; for example, the single large spring fed by thousands of eating a leaf on a tree-boring caterpillars and insects can be found. Including parasites in the food chain, because they are generally smaller and more numerous the parasites of the hosts, population—magnitude relationship is reversed. When considering the inability to transfer energy from a level to another traffic our remote ancestors kalitlanan both animal and vegetable diet, instead of eating vegetables entirely, if we stopped being omnivorous world seems to accommodate more people. However, this common belief there are some shortcomings. First, for example, large areas of the world —Argentina, Australia, Africa, South America, Western and Western— unfit for human consumption, however, the large herbivores that can feed this kind of habitat plants which are adapted to low quality pasture. Another problem, related to human nutritional requirements, whether vegetarian diet is animal protein daily that usually requires some additional. In Western societies most individuals consume much more animal protein than is necessary to sustain their lives, in fact, cattle meat for a few weeks before slaughter to enhance the taste of high-quality feed with seed. In the United States, total grain production (mostly corn), 30% cattle and the nutrition of chickens is divided into. Cattle is fed only by beslense was a significant portion of the world that can be done in the area of Agriculture, milk production

who want to provide food for their dairy cattle for the continuation of high quality weed, it would be necessary . Another questionable part of cattle, animal farms along with that they are the main source of methane that might contribute to global warming. Malthus's other dilemma is a persistent problem in developing countries and a significant reduction in the birth rate, without any increase in World Food Production, After all, can serve to increase the number of people that will be hungry again. Any increase in the top of the pyramid; however, at lower traffic levels, a proportionally larger increase can be supported. Bibliography: https://www.sciencedirect.com Read the full article
#Ecosystem#ecosystemdefinition#ecosystemdefinitionbiology#ecosystemexamples#ecosystemofdesert#ecosystemservices#ecosystemtypes#Ecosystem:EnergyFlow#oceanecosystem
0 notes
Text
Iris Publishers - World Journal of Agriculture and Soil Science (WJASS)
Non-Conventional Methods as a New Alternative for the Estimation of Terrestrial Biomass and Carbon Sequestered
Authored by Salem Issa

Introduction
Carbon sequestration is becoming an essential component in the fight against global warming. Forests act as large carbon pools where CO2 in the atmosphere is converted massively to biomass in the plant by photosynthesis process. Afforestation projects and land use conversion to forest (reforestation) can be used to earn carbon credits and reduce the carbon footprint, hence providing a longterm reduction in greenhouse gases (GHGs) levels through carbon sequestration [1]. This attitude has a growing interest among policymakers and governments [2]. Plantation cropping as a land use system has the potential to contribute to carbon stocks, maintain soil biodiversity and improve soil fertility [3]. Precise carbon stock estimation is a necessary step to define carbon emission mitigation strategies and programs at the local and regional level [4]. This kind of studies is necessary for a better understanding of the long-term behavior and drivers of carbon sequestration under different global climate change scenarios [5].
The total carbon stock in any terrestrial ecosystem is the sum of carbon in living biomass, dead biomass and soil [6]. Eggleston et al. [7] has listed five terrestrial ecosystem carbon pools involving biomass: above-ground biomass (AGB), below-ground biomass (BGB), litter, woody debris and soil organic matter [7]. Of these five, AGB is the most visible, dominant, dynamic and important pool of the terrestrial ecosystem. AGB contributes to atmospheric carbon fluxes to a much greater extent due to fire, logging, land use changes, etc., and so is of much greater interest. Therefore, it is necessary to keep monitoring it continuously not only a single date mapping. However, estimation of forest biomass rises scientific challenges to identifying feasible approaches to assess carbon at national level [8].
Traditional biomass assessment methods based on field measurements are the most accurate methods; however, they are difficult and unpractical to conduct over large areas and for broad-scale assessments [9]. These difficulties make monitoring activities more costly, time consuming, and labor intensive [10]. Recently, remote sensing (RS) procedures have been applied to natural resources management and biomass assessment. RS has the ability to obtain forest information over large areas with repetitive coverages, at reasonable cost and with acceptable accuracy. Moreover, the integration of remote sensing data into GIS models will benefit from both technologies; bringing ancillary and field data into the analysis and producing more reliable estimation of the AGB and carbon sequestered.
The aim of this study is twofold: (1) to review conventional methods for estimating forest biomass and carbon sequestered including destructive and non-destructive methods, and (2) to review non-conventional methods that use RS and GIS as innovative techniques applied to biomass studies and carbon assessment.
Conventional Methods
Background
These include direct (destructive) and indirect (nondestructive) methods. The direct method which is the most precise method for determining carbon biomass by destructively harvest all plants, partition each into various constituent components (e.g. stem, branches, leaves, flowers, fruits, roots) and subsequently determine the carbon content of the various components analytically OR calculated as a fraction of measured biomass (indirect) [9]. The destructive methods of biomass estimation are limited to a small area due to the destructive nature, time, expense and labor involved and sometime illegal especially for trees. In addition, these methods ultimately rely on ground measurement and can cause severe destruction to the forests as well as a risk of environmental deterioration [10,11]. The indirect methods include the estimation based on allometric equations (§ Allometric subsection) or through non-conventional methods using RS and GIS (§ non-conventional section).
Two routes for achieving sequestered carbon estimation: First, estimating soil organic carbon (SOC) which is part of soil organic matter (SOM). Second, estimating vegetation biomass which can be achieved by estimating the AGB and then deriving the remaining components; BGB, Litter and Debris, from the AGB as shown in (Table 1). The most common way for estimating SOM is through soil sampling at various layers and then, the SOC is estimated using total combustion method, as explained by Walkley & Black [12]. The content of SOC included in SOM may change depending on many factors (ecosystems, type of organic residues and land management, etc.). Many studies estimate SOC from SOM using the conventional factor of 1.724 (~ 58% of SOM). This figure is widely used and has appeared in many studies and published papers in the last century; while Brady & Weil [13] concluded that this value (58% of SOM) probably applies only to highly stabilized humus [13]. After his statistical analysis of 481 studies, Pribyl [14] found that conventional factor varies from 1.35 to 7.50 with a mean value of 2.20, concluding that any single-number conversion factor, universally applied, has the potential for serious error when used to estimate the carbon content of soils [14]. However, recent studies have accepted a generic quick, simple and inexpensive coefficient of 57% for measuring SOM as percent of SOM [15]. The main objective in developing allometric equations is to avoid destructing forests when estimating their biomass and provide a cost effective and environment-friendly option since it is done without harvesting [18]. In general, allometric equation is a statistical model to estimate the biomass of the trees using their biometrical characteristics which are non-destructive and simpler to measure. Therefore, nondestructive methods through allometric relationships are increasingly used. Such equations have also been proven to be fast, inexpensive, and more suitable for largescale estimation of forest carbon stocks [6]. Allometric models are commonly used in forest inventories and ecological studies [18]. The models relate biomass of an entire tree or individual tree components (e.g., stems, branches, leaves or roots) to one or more easily tree variables and dendrometric measures (e.g. height, diameter breast height or crown size) [19]. The proportions between height and diameter, between crown height and diameter, between biomass and diameter follow rules that are common to all trees that are grown under the same conditions; and become more useful in uniform forests or plantations with similar aged stands [20]. The selection of appropriate and robust models, therefore, have considerable influence on the accuracy of estimates obtained [21]. It is worth to mention that the goal of using allometric equations is estimating biomass without the need to cut trees, but the equations must be based on destructive sampling of vegetation somewhere before they can be applied generally and they still need to be validated which requires cutting and weighting some trees components [9]. The number of trees destructively sampled to build allometric equations differ from one study to another. Currently, there is no consensus on the number of trees that should be sampled, as this is often dependent on resource availability and permission to harvest trees [9]. For example, Russell [24] and Deans et al. [25] used 15 and 14 trees, while Brown et al. [22] and Khalid et al. [23] used only 8 and 10 trees, respectively; to build their allometric equations [22–25]. In their study of oil palm plantations of Benin forests, Aholoukpè et al. [26] used 25 palms from several ages and different genetic origins to build a species specific allometric equation [26]. However, recent study showed that small sample size yield biased allometric equations [27].
Generally, there is no specific procedure to build allometric equations yet there is a recommended guideline for documenting allometric equations [28]. Jara et al. [28] recommended that researchers should only report all the details in methods section of how they build up their equations. Furthermore, sampled trees should be randomly selected, regardless of health condition or degree of damage, because sampling only trees with fully intact structural characteristics will likely result in an equation that overestimates biomass for the general case. In this respect, data outliers should not be removed simply to improve model fit metrics [9]. There are many existent allometric equations. For example, the GlobeAllomeTree database contains over 706 equations from Europe, 2843 from North America and 1058 from Africa [29]. Some are volume equations, while others are biomass equations. According to the Brown & Lugo (1992) method, the biomass can be calculated from volume of the biomass per hectare (VOB/ha) by using a generalized volume model, wood density and a biomass expansion factor [21]. One of the limitations of volume equations is that it can only be applied to stem while biomass equations cover a wide range of vegetation components [30]. Allometric models can be developed for individual species or multiple species (mixture of species) to represent a community or bioregion and can be developed to cover specific sites, regional or pan-tropical scales [9,21]. The multi-species equations built because it is practically difficult to develop allometric equations for all species present in the ecosystem [31]. For example, in their work in tropics, Chave et al. [32] has shown that one hectare of tropical forest may shelter as many as 300 different tree species [32]. So, the multi-species allometric models offer methodological efficiencies for biomass estimation compared to those developed for individual species at specific locations. However, they have the potential to misrepresent local, species- or community-specific variations and anomalies, and therefore can lead to increased error and fail to capture both variations in forest type and diversity of the natural vegetation communities [21]. Therefore, tailored equations designed for specific species are needed for more accurate biomass estimation. Such equation is still conditioned by the ecological zone where the equation had been built. Hence weakening the estimation’s accuracy of the actual forest AGB when the equation is used in another area or region [33]. Due to the different characteristics of plant species from site to site, preexisting equations developed at locations that are different from the one in consideration may have limited applicability, even if the equation is species-specific [9,10]. In their review of allometric equations in Asia, Yuen et al., (2016) concluded that applying existing allometric equations out of convenience is potentially a key source of uncertainty in above- and below-ground carbon stock estimates in many Asian landscapes [9]. The selection of allometric equations can influence local, regional and global biomass estimates, therefore, there is an importance of site-specific equations for accurate estimation of biomass as generalized equations can overestimate AGB by 50% to 65% [11]. The locally developed models are expected to provide less uncertainty than generic equations [34]. Site and species specific allometric models should logically provide a greater level of accuracy at a given location to assist the assessment of biomass carbon sequestration and that make the locally built equation a better option to produce more accurate site-specific biomass estimation [11]. Finally, since the choice of the equations is the first critical step, there has been a rapid increase in efforts to develop locally appropriate equations [29].
The mathematical model commonly used for modeling aboveground biomass is based on the power function [9]. This was founded on the basis that the growth of a plant is characterized by the relation of proportionality between its total biomass and its size [35]. Biometric variables measured in plant species were considered as independent variables (diameter breast height, total height, crown variables, stem height, etc) and incorporated into a power function model [36]. The allometry based on power model have good reliability as indicated by high coefficient of determination indices [37]. Researchers involved in the development and application of biomass allometric equations are faced with many challenges. One of them is the choice between simple bivariate power-law (typical allometric) functions and models with multiple predictors [29]. Different variables (structural and non-structural) were considered when building biomass allometric equations. Most equations for above-ground biomass, or biomass of any component (stem, branch, leaves, other) use equations with diameter and/or height as independent variables. Other variables such as girth, basal area and crown dimensions have been used even less frequently— usually in special cases [9]. Using wood density, when it is available, as a predictor is considered as significantly improving the biomass prediction equation when dealing with multispecies dataset [32]. In their study to investigate the allometric equations in China, Cheng et al. [30] found that the most frequently used predictive variable in single-variable models is diameter at breast height (DBH), and in two-variable models are DBH and tree height while wood density and crown diameter are presented in more complicated models [30]. They found that diameter variables have a dominant proportion of 87.4% of the surveyed equations. However, DBH showed a weak correlation with biomass quantity in specific species, like palm for example [38,39]. Age as a predictor used in estimating the biomass in many studies as there is a linear correlation between age and biomass accumulation [1,40–42]. Many studies have highlighted the importance of tree height as predictor variable in the aboveground biomass equation [3,10,19,35]. Crown variables as indicators for biomass estimation became more interesting as a result of improving RS technologies. Furthermore, more than one allometric equation can be developed for each plant species. The reasons behind that can be: (1) difference in ecoregion sites that these equations developed for (Tropical or Amazonian forests ..etc), (2) the decision of the developers of the allometric equations and choosing of the suitable variable/s (height, DBH, trunk height, etc.) to work as input (independent variable) to the model, (3) the use of the allometric equations to cover either specific parts of the plant (AGB, crown biomass, trunk biomass, etc.) or specific age (young, mature, mixed, etc.), and (4) the selection of the mathematical equation form (power, linear, algorithmic, etc.). Finally, more recently, allometric equations have been used, coupled with remote sensing (RS) and field-based structural variables measurements [35,43]. For example, Cheng et al. [30] recommended to develop more equations with different field structural variables that can be linked to RS predictors [30]. Likewise, Jucker et al. [44] suggested in their review of allometric equations to develop a new generation of allometric equations that estimate biomass based on attributes which can be remotely sensed [44].
Non-Conventional Methods
Background
Non-conventional methods that used RS and related technologies such as GIS have proved to be practical and cost/time effective. During the preparation of this review, 156 articles related to AGB estimation by non-conventional methods, were covered (Figure 1). Three quarters of these used optical sensors (with different spatial resolutions) and the remaining quarter used active sensors (almost equally between RADAR and LiDAR sensors). For optical sensors, half of these studies used coarse spatial resolution (>100 meter) like MODIS and SPOT VEG sensors. Around one third of studies that used optical sensors estimated the biomass by moderate spatial resolution (~10-100 meter) like Landsat, IRS, and SPOT sensors while around 20% of the studies used fine spatial resolution data (submeter to 5 meter) like IKONOS, Quickbird and World View sensors. RS can provide data over large areas at a fraction of the cost associated with extensive field works and enables access to inaccessible places. Data from RS satellites are available at various scales, from local to global, and from several different platforms. There are also different types of data both Passive, such as optical and thermal remote sensing sensors, or Active, such as Radar and LiDAR sensors, with each has its own advantages and disadvantages [45]. On the other hand, GIS is a platform hosting spatial databases capable of assembling and integrating geographically referenced data, running spatial analysis, integrating various types and formats of spatial data, building spatial models enabling the prediction of future scenarios, and allowing for good management of forests. The estimation and modelling of carbon sequestered using RS and GIS methods is receiving an increasing attention and usage due to the multiple benefits they offer to scientists. To improve the accuracy of estimating AGB, integration of more than one sensor is becoming a trend as well as the integration with GIS-based approaches. More than 46 articles were reviewed that integrated both approaches. The trend is increasing in order to improve the accuracy of AGB estimates in plant species levels, instead of forests in general or mixed species.
To read more about this article: https://irispublishers.com/wjass/fulltext/non-conventional-methods-as-a-new-alternative-for-the-estimation-of-terrestrial-biomass.ID.000579.php
Indexing List of Iris Publishers: https://medium.com/@irispublishers/what-is-the-indexing-list-of-iris-publishers-4ace353e4eee
Iris publishers google scholar citations: https://scholar.google.co.in/scholar?hl=en&as_sdt=0%2C5&q=irispublishers&btnG=
1 note
·
View note
Text
New Post has been published on Biology Dictionary
New Post has been published on https://biologydictionary.net/cellular-respiration-and-photosynthesis/
Cellular Respiration and Photosynthesis
Together, the processes of photosynthesis and cellular respiration allow life on Earth to gather energy for use in other reactions. Besides the organisms that rely on sulfur near hydrothermal vents, the majority of life on Earth relies on the sugar glucose. Glucose is created by the process of photosynthesis. Cellular respiration involves the breakdown of glucose and the storage of the energy received into the molecule ATP. Plants create their own energy through photosynthesis and also use cellular respiration to produce ATP. Animals must rely on the sugars that they’ve gathered from plants to supply their mitochondria material to produce ATP.
Process of Photosynthesis
Photosynthesis is the main process which drives life on Earth. Through photosynthesis, energy from the sun is captured in the bonds of organic molecules. These molecules, glucose molecules, are the basis of all life on Earth. Glucose will be used by the process of cellular respiration to harness chemical energy stored within the covalent bonds of the sugar.
Photosynthesis occurs in the leaves and green parts of plants. Organelles within plant cells, known as chloroplasts, contain specialized proteins capable of interacting with light. Cytochromes are these specialized proteins, which are attached to a heme group. Heme groups are also seen bound to hemoglobin, in blood cells. Instead of iron, these heme cells bind magnesium. The complex structure of the heme interacts with the photons of light passing through them.
The chloroplast uses the energy harnessed from these photons and their interaction with the cytochromes and other proteins to drive the formation of glucose. To do this, the chloroplasts will combine units of carbon dioxide into chains of 6 carbons, 12 hydrogens, and 6 oxygens. This is glucose, which can then be modified and combined with other glucose molecules to be stored as starches and complex sugars like fructose.
Photosynthesis Reaction
The photosynthesis reaction has two parts, commonly referred to as the Light reactions and the Calvin Cycle. The entire process of photosynthesis can be seen below.
Simple photosynthesis overview
At the top of the diagram, light and water combine in the chloroplasts, where the hydrogens are separated from the oxygen in chain of proteins starting from the energy-collecting cytochromes and accessory pigments. The hydrogens, electrons, and associated energy are bound to ADP and NADP+. These molecules can bind a hydrogen, electrons, and energy. In doing so, they become the main products of the light reactions, NADPH and ATP. Oxygen is produced as a by-product.
ATP and NADPH are then used within the Calvin Cycle, a series of reactions which recycles these electron-carriers and produces glucose. The energy within and the hydrogen molecules are used to energize reactions throughout the cycle. The Calvin Cycle has three phases, carbon fixation, reduction, and regeneration of ribose. These reactions can be seen in the image below. Notice that the addition of one carbon dioxide in one turn of the reaction produces the 3-carbon molecule 3-phoshphoglycerate. Two of these molecules are then combined to produce a glucose, among other things.
Calvin cycle
Process of Cellular Respiration
Once the glucose is created by the chloroplasts, it can be used to drive other reactions within the cell. It can also be exported to other cells within the organism. This is where the process of cellular respiration takes over. Cellular respiration has 4 distinct processes, which drive the creation of ATP. This ATP can be used in a number of cellular reactions, and provides activation energy to help enzymes complete tasks.
Cellular respiration happens in the mitochondria, a small organelle similar to the chloroplasts. While chloroplasts are only found in plants, mitochondria are found in all living eukaryotes. Plants provide all the glucose their cells need, and more. This extra glucose they store as starches and complex sugars. Animals, and indeed the entire food-chain, relies on the glucose produced by plants.
Cellular Respiration Reaction
The first process of cellular respiration, glycolysis, is exactly what its name implies. “Glyco-” refers to glucose, where “-lysis” refers to something being divided or split in half. Glycolysis happens within the cytosol of the cell, outside of the mitochondria. In this process, the 6-carbon glucose molecule is split into two molecules of pyruvate.
This 3-carbon molecules is then converted to Acetyl CoA in the next step. This molecule will be an essential part of the Krebs cycle. Acetyl CoA is also able to transfer into the mitochondria, where the Krebs cycle and oxidative phosphorylation will take place. This can be seen in the diagram below. The labels on the right show where the various reactions take place.
Cellular Respiration
The Krebs cycle is similar to the Calvin cycle, in that it recycles certain molecules to continually drive the production of electrons and ATP. The electrons are then passed to the inner mitochondrial membrane. This membrane is loaded with specialized proteins, capable of transferring energy derived from the passing of electrons down their potential gradient.
This electron transport chain uses a series of electron driven enzymes, which specialize in binding loose phosphate groups to ADP. In doing so, they store energy in the bond between these molecules, and create an ATP. These ATP molecules are then exported from the mitochondria, and can be used throughout the cell to provide energy in other reactions. For instance, ATP is used to pump ions out of cells, creating the electrical potential needed for nervous reactions. There are innumerous other examples.
Cellular Respiration, Photosynthesis, and Evolution
In the Theory of Evolution, the origins of life on Earth are highly unproven. However, there is a large body of evidence which points to the fact that all life has a common ancestor. This ancestor then diverged, over hundreds of millions of years, into the millions of species we see on Earth today. The process of endosymbiosis would account for this complexity.
Bacteria, the simplest organisms, likely represent a fairly unchanged version of the first form of life. Bacteria have no organelles, and complete all the reactions they need for metabolism within a single compartment. Many bacteria are able to complete glycolysis, which can provide them with energy. Others are able to photosynthesize, like primitive single-celled plants.
According to Endosymbiotic theory, these ancient bacteria began interacting and the processes of evolution drove them into different niches within the environment. Some would harness sunlight, while others would feed upon those. Eventually, some of the predatory bacteria became quite large. As such, they could take in large quantities of smaller bacteria. Instead of digesting them, they created a safe space for them and helped them produce more energy. Thus, the smaller endosymbiotic bacteria became the first organelles.
This theory suggests that chloroplasts were originally photosynthetic bacteria, and that mitochondria were originally bacteria capable of oxidative phosphorylation. The larger bacteria became eukaryotes, and developed other organelles. This theory is backed by the evidence that both chloroplasts and mitochondria are surrounded in double membranes, a supposed remnant of the ancestral engulfing process. Further, both mitochondria and chloroplast contain bits of circular DNA, similar to that found in bacteria. This DNA is replicated separately from the main DNA found within the nucleus.
Cellular Respiration, Photosynthesis, and Ecology
Hundreds of millions of years after this division of organelles, and evolution has given us what we see today. Plants are related to algae, which are related to photosynthetic bacteria. Animals are related to the ancient organisms which did not receive photosynthetic endosymbionts, and instead relied on consuming other organisms.
At the bottom of the food-chain sit the photosynthetic organisms. They form by far the largest biomass on Earth, limited only by the amount of sunlight, nutrients, and water they receive. One step above plants and algae, herbivores exploit the bounty that plants produce. Some of the largest animals in the world, such as the elephant, are entirely herbivorous. But, there are herbivores of every size, all the way down to grasshoppers and tiny insects. Because an herbivore must consume many photosynthetic organisms to grow, there are many less organisms on this level of the food-chain.
Likewise, there are many less carnivores than there are herbivores, because they must feed on many smaller organisms throughout their life to grow and reproduce. In this way, the entire food-chain and ecology in general is entirely based off of the processes of photosynthesis and cellular respiration. Ecology is also the study of how various organisms interact with each other while carrying out these reactions.
Quiz
1. Which of the following is NOT a difference between photosynthesis and cellular respiration A. Only one uses sunlight B. Only one breaks glucose down C. Only one relies on a cycle of carbon molecules
Answer to Question #1
C is correct. The Krebs cycle and the Calvin cycle, while differing in their outputs, both rely on a chain of carbon molecules which are continually recycled. The molecules are different, but the processes are very similar.
2. As a human, your cells rely on glucose to function. Where does this glucose come from? A. Your body B. Plants C. Meat
Answer to Question #2
B is correct. All of the food that you consume was at one point a plant. If you eat meat, the nutrients you receive from that meat are the same nutrients that animal ate before it died. Even the protein and fat in animals is simply a reuse of the protein and glucose found in plants.
3. Which of the following things would be MOST devastating to an ecosystem? A. All the grass in a meadow is killed with an herbicide. B. All the butterflies in a meadow are killed with a pesticide. C. All the birds in a meadow are killed by hunters.
Answer to Question #3
A is correct. Without the grass, the entire food chain will collapse. The other two examples represent higher levels of the food chain. Without grass, all the insects would die, and all the birds. But also remember that none of the options are good. Without the birds, insects may eat all the grass and the same result will occur.
References
Lodish, H., Berk, A., Kaiser, C. A., Krieger, M., Scott, M. P., Bretscher, A., . . . Matsudaira, P. (2008). Molecular Cell Biology (6th ed.). New York: W.H. Freeman and Company.
McMahon, M. J., Kofranek, A. M., & Rubatzky, V. E. (2011). Plant Science: Growth, Development, and Utilization of Cultivated Plants (5th ed.). Boston: Prentince Hall.
Nelson, D. L., & Cox, M. M. (2008). Principles of Biochemistry. New York: W.H. Freeman and Company.
0 notes
Text
Europe’s New Renewable Energy Directive
Europe’s New Renewable Energy Directive
by Helena Tavares Kennedy
You may have heard that the European Parliament voted in favor of the RED II (Renewable Energy Directive) proposal in January. Probably the most notable (or at least covered in the news the most) was their decision to remove biodiesel made from palm oil from its list of biofuels that can count towards the EU’s renewables target from 2021.
It also voted that “biomass fuels consumed in transport, if produced from food or feed crops, shall be no more than the contribution from those to the gross final consumption of energy from renewable energy sources in 2017 in that Member State, with a maximum of 7% of gross final consumption in road and rail transport.”
The European Parliament also voted to include an overall transport target of 12%, containing a 10% blending mandate for advanced fuels, including electricity, waste-based biofuels and recycled carbon fuels.
The critics
Dick Roche, a former Irish minister for the environment and a former minister for European affairs, and current advisor to the Hungarian company Pannonia Ethanol, told Euractive just last week, “A core element in the Commission’s ‘strategy’ is to phase out conventional biofuels in the hope that they will miraculously be replaced by ‘advanced’ biofuels in Europe’s transport energy mix. The proposals are not backed by science or by logic.”
Roche doesn’t mince words – “They are grossly out of step with what is happening elsewhere in the world,” he told Euractive. “If they are enacted, they will represent one of the biggest blunders the EU has ever made – a blunder with a price tag well in excess of €25 billion.”
As reported in the Digest in January, ePure and farm groups Copa-Cogeca were pushing hard on the yea side while a group of 30 NGOs including WWF and Transport and Energy on the nay side have sent a letter arguing against the use of biofuels in transportation. The European Commission, Parliament and EU Member States have all staked out different positions on how much biofuels can contribute to renewable energy targets for transport.
Environmental groups including WWF Europe, Oxfam, BirdLife Europe and Transport & Environment were hitting out at the proposed Renewable Energy Directive II even last year as reported in The Digest in October 2017. They attached the REDII’s continued support of biomass power where member state governments are allowed unlimited support of co-firing trees and crops at coal-fired power plants, calling it “burning taxpayers’ money” as well as the use of crops for liquid biofuels. They say more stringent sustainability criteria are required to fight global warming and ensure responsible resource use.
Just a few weeks ago, Germany’s UFOP and the FOP – French Federation of Growers of Oilseed and Protein Plants, were appealing to the negotiating partners that are drafting RED II to find an appropriate compromise that protects existing investments and at the same time also encourages investment into the biofuel sector in future. Both associations said in a statement, as reported in The Digest earlier in March, that they “see that this willingness to invest will be threatened if the biofuels that are currently available on the market, especially sustainable biodiesel from rapeseed, are no longer to be used in the future. As a result, the requirements for sustainability of raw materials and for greenhouse gas reduction, with which the EU has set standards worldwide, would also cease. The associations recall that many states are obliged in the Paris climate agreement to submit national climate protection plans. Biofuels from cultivated biomass can make a significant contribution to climate protection and therefore must occupy an important role in the transport sector.”
Beyond biofuels impact
On the other hand, there are plenty of people who recognize the positives of the revised REDII, especially as it relates to markets outside of biofuels, such as bioplastics. As reported in The Digest earlier in March, a press release from the European Bioplastics said that “the new legislation acknowledges that bio-based feedstock for plastic packaging as well as compostable plastics for separate bio-waste collection contribute to more efficient waste management and help to reduce the impacts of plastic packaging on the environment. The legislative package includes the revision of the Waste Framework Directive and the Packaging and Packaging Waste Directive.”
“The revised Waste Framework Directive allows biodegradable and compostable packaging to be collected together with the bio-waste and recycled in industrial composting and anaerobic digestion, which has already successfully been implemented in several Member States. By 2023, separate collection of bio-waste is set to be mandatory throughout Europe.”
“The Packaging and Packaging Waste Directive acknowledges that bio-based plastics help to minimize the environmental impacts of plastic packaging and to reduce Europe’s dependence on imported raw materials. While Member States are encouraged to promote the use of bio-based recyclable packaging and bio-based compostable packaging, the European legislators miss the chance to introduce concrete legislative measures stimulating their use and improving market conditions for such products.”
“Furthermore, the agreed text makes a clear distinction between biodegradable compostable plastics and so-called oxo-degradable plastics, which shall not be considered biodegradable. This position has also been integrated in the recently published EU Strategy on Plastics, which aims to restrict the use of oxo-degradable plastics.”
The controversy
In case you missed it, the debate continues on palm oil from Malaysia and Indonesia and the REDII’s take on banning palm oil altogether. As reported in The Digest in February, either way you slice it, the message is clear from the EU – yes to sustainable advanced biofuels like waste-based biofuels, but no way to food or crop-based biofuels. The EU wants to support biofuels that are good for the environment and sustainable while helping their domestic economy – palm oil from abroad doesn’t seem to fit the bill for either of those two goals.
What they may not realize is that this offers up opportunity for other countries like China to swoop in and up their palm oil imports. But it also offers up opportunity for advanced biofuels and non-food based biofuels to step up their game and take off with much needed support and demand. This is one instance when “what’s good for the goose is good for the gander” works. What’s good for advanced biofuels and non-crop biofuels is not so good for palm oil producers.
European Ethanol
Double counting can be an issue for European ethanol – for example, sugar molasses counting as both waste and agriculture products. Eric Sievers, the director of Ethanol Europe, which owns Europe’s largest biorefinery at Dunafoldvar (Hungary), said classifying starch slurry or molasses as waste when they are clearly food or feed products, was “just wrong,” according to Euractive.
“Doing so calls into question the integrity of the Commission in circumstances where the Commission is failing spectacularly in regulating its own standards,” Sievers told Euractive. “The EU starch industry claims to have a ‘zero waste objective’ and states that it produces ‘close to zero waste’. It has quantified waste as less than 1% of its processed materials. With industry output at circa 10 million tons of starch each year, this amounts to 100,000 tons of waste of all types per year. Ethanol production from starch slurry in the EU is well in excess of this theoretical maximum volume of waste and gives rise to the question of why there is such a gap between starch slurry waste output and starch ethanol production levels. The gap remains unexplained.”
Helena Tavares Kennedy is a writer for Biofuels Digest, where this article was first published. Biofuels Digest is the most widely read Biofuels daily read by 14,000+ organizations. Subscribe here.
https://ift.tt/2IQyO2m
0 notes
Text
Europe’s New Renewable Energy Directive
Europe’s New Renewable Energy Directive
by Helena Tavares Kennedy
You may have heard that the European Parliament voted in favor of the RED II (Renewable Energy Directive) proposal in January. Probably the most notable (or at least covered in the news the most) was their decision to remove biodiesel made from palm oil from its list of biofuels that can count towards the EU’s renewables target from 2021.
It also voted that “biomass fuels consumed in transport, if produced from food or feed crops, shall be no more than the contribution from those to the gross final consumption of energy from renewable energy sources in 2017 in that Member State, with a maximum of 7% of gross final consumption in road and rail transport.”
The European Parliament also voted to include an overall transport target of 12%, containing a 10% blending mandate for advanced fuels, including electricity, waste-based biofuels and recycled carbon fuels.
The critics
Dick Roche, a former Irish minister for the environment and a former minister for European affairs, and current advisor to the Hungarian company Pannonia Ethanol, told Euractive just last week, “A core element in the Commission’s ‘strategy��� is to phase out conventional biofuels in the hope that they will miraculously be replaced by ‘advanced’ biofuels in Europe’s transport energy mix. The proposals are not backed by science or by logic.”
Roche doesn’t mince words – “They are grossly out of step with what is happening elsewhere in the world,” he told Euractive. “If they are enacted, they will represent one of the biggest blunders the EU has ever made – a blunder with a price tag well in excess of €25 billion.”
As reported in the Digest in January, ePure and farm groups Copa-Cogeca were pushing hard on the yea side while a group of 30 NGOs including WWF and Transport and Energy on the nay side have sent a letter arguing against the use of biofuels in transportation. The European Commission, Parliament and EU Member States have all staked out different positions on how much biofuels can contribute to renewable energy targets for transport.
Environmental groups including WWF Europe, Oxfam, BirdLife Europe and Transport & Environment were hitting out at the proposed Renewable Energy Directive II even last year as reported in The Digest in October 2017. They attached the REDII’s continued support of biomass power where member state governments are allowed unlimited support of co-firing trees and crops at coal-fired power plants, calling it “burning taxpayers’ money” as well as the use of crops for liquid biofuels. They say more stringent sustainability criteria are required to fight global warming and ensure responsible resource use.
Just a few weeks ago, Germany’s UFOP and the FOP – French Federation of Growers of Oilseed and Protein Plants, were appealing to the negotiating partners that are drafting RED II to find an appropriate compromise that protects existing investments and at the same time also encourages investment into the biofuel sector in future. Both associations said in a statement, as reported in The Digest earlier in March, that they “see that this willingness to invest will be threatened if the biofuels that are currently available on the market, especially sustainable biodiesel from rapeseed, are no longer to be used in the future. As a result, the requirements for sustainability of raw materials and for greenhouse gas reduction, with which the EU has set standards worldwide, would also cease. The associations recall that many states are obliged in the Paris climate agreement to submit national climate protection plans. Biofuels from cultivated biomass can make a significant contribution to climate protection and therefore must occupy an important role in the transport sector.”
Beyond biofuels impact
On the other hand, there are plenty of people who recognize the positives of the revised REDII, especially as it relates to markets outside of biofuels, such as bioplastics. As reported in The Digest earlier in March, a press release from the European Bioplastics said that “the new legislation acknowledges that bio-based feedstock for plastic packaging as well as compostable plastics for separate bio-waste collection contribute to more efficient waste management and help to reduce the impacts of plastic packaging on the environment. The legislative package includes the revision of the Waste Framework Directive and the Packaging and Packaging Waste Directive.”
“The revised Waste Framework Directive allows biodegradable and compostable packaging to be collected together with the bio-waste and recycled in industrial composting and anaerobic digestion, which has already successfully been implemented in several Member States. By 2023, separate collection of bio-waste is set to be mandatory throughout Europe.”
“The Packaging and Packaging Waste Directive acknowledges that bio-based plastics help to minimize the environmental impacts of plastic packaging and to reduce Europe’s dependence on imported raw materials. While Member States are encouraged to promote the use of bio-based recyclable packaging and bio-based compostable packaging, the European legislators miss the chance to introduce concrete legislative measures stimulating their use and improving market conditions for such products.”
“Furthermore, the agreed text makes a clear distinction between biodegradable compostable plastics and so-called oxo-degradable plastics, which shall not be considered biodegradable. This position has also been integrated in the recently published EU Strategy on Plastics, which aims to restrict the use of oxo-degradable plastics.”
The controversy
In case you missed it, the debate continues on palm oil from Malaysia and Indonesia and the REDII’s take on banning palm oil altogether. As reported in The Digest in February, either way you slice it, the message is clear from the EU – yes to sustainable advanced biofuels like waste-based biofuels, but no way to food or crop-based biofuels. The EU wants to support biofuels that are good for the environment and sustainable while helping their domestic economy – palm oil from abroad doesn’t seem to fit the bill for either of those two goals.
What they may not realize is that this offers up opportunity for other countries like China to swoop in and up their palm oil imports. But it also offers up opportunity for advanced biofuels and non-food based biofuels to step up their game and take off with much needed support and demand. This is one instance when “what’s good for the goose is good for the gander” works. What’s good for advanced biofuels and non-crop biofuels is not so good for palm oil producers.
European Ethanol
Double counting can be an issue for European ethanol – for example, sugar molasses counting as both waste and agriculture products. Eric Sievers, the director of Ethanol Europe, which owns Europe’s largest biorefinery at Dunafoldvar (Hungary), said classifying starch slurry or molasses as waste when they are clearly food or feed products, was “just wrong,” according to Euractive.
“Doing so calls into question the integrity of the Commission in circumstances where the Commission is failing spectacularly in regulating its own standards,” Sievers told Euractive. “The EU starch industry claims to have a ‘zero waste objective’ and states that it produces ‘close to zero waste’. It has quantified waste as less than 1% of its processed materials. With industry output at circa 10 million tons of starch each year, this amounts to 100,000 tons of waste of all types per year. Ethanol production from starch slurry in the EU is well in excess of this theoretical maximum volume of waste and gives rise to the question of why there is such a gap between starch slurry waste output and starch ethanol production levels. The gap remains unexplained.”
Helena Tavares Kennedy is a writer for Biofuels Digest, where this article was first published. Biofuels Digest is the most widely read Biofuels daily read by 14,000+ organizations. Subscribe here.
https://ift.tt/2IQyO2m
0 notes
Text
The Importance of Renewable Energy to Foster the Transition to Sustainable Development
Part A: The Role of Renewable Energy in Fostering an Energy Transition to a Sustainable Future.
Introduction
The discovery of fossil fuels gave rise to a seemingly unlimited supply of cheap energy, its abundance made it seem like the supply was unlimited. However, as the use of fossil fuels increased over the years, problems that very few people realised or even anticipated developed. The benefits derived from consumption of the low cost and high energy fuels they were consuming, and this led to the creation of many great inventions that took advantage these fossil fuels. It was only later within the second half of the 21st century that the problems associated with the use of fossil fuels began to be recognised.
Alternative energy sources were already present but there was no clear need to take advantage of them since fossil fuels were so cheap; had high energy output and the technology that made use of those fuels was very efficient. Americans only acknowledged the supply of fossil fuels was finite and could cause a rise in pricing after the Arab oil embargo of 1973 (Murray & King 2012). Around the same period American car manufacturers began making more fuel-efficient vehicles, while it was discovered global warming was occurring and it was being caused by fossil fuel emissions. Unfortunately, the fact that climate change is real is still in doubt by some politicians like president Donald Trump, he recently signed an executive order to remove Obama’s climate policies which were meant to address climate change (Plumer 2017). The rise in fuel cost which led to the ‘energy crisis’, and the discovery of global warming by scientist further pushed the search for cleaner and renewable energy.
The shift towards renewable energy has begun; there are many directions in which this transition from fossil fuels to renewable energy is occurring. There are multiple governments, institutes and private companies looking at different forms of renewable energy from solar; wind power; biomass; hydropower and tidal power. Each form of renewable energy has its own advantages and drawbacks hence there is no single source you can point out as the best. Research is intensively being carried out, and the technologies are improving, thereby taking us closer to a sustainable energy future.
The Neo-liberal growth model no longer works in this environment we are living in and is now an outdated model; because resources are finite, regulation is required (Jänicke 2012). Economic growth is largely linked to oil production growth (Murray & King 2012); with finite fossil fuels and oil reserves which are running out, economic growth is bound to slow down. Green growth seems to be the best solution that can keep the trend of continuous economic growth. This literature review will be looking at the problems of our continuous dependence on fossil fuels; the prospects of renewable energy in assisting with continuous economic growth, and some of the problems that might be encountered in the energy transition to a more sustainable world.
Current Problems with Fossil Fuels
Economic Problem
Fossil fuels are globally the dominant fuel source, currently generating 85% of the total global energy demands (Smil 2016). There are three main fossil fuels in use today, those are coal which is the cheapest and currently most abundant of them all; oil which is the most used for energy and is also used in manufacturing multiple products, and finally natural gas which is primarily used for heating and cooking.
Fossil fuel sources were wrongly assumed to be endless for a major part of the time they were in use, this being due to the fact they were abundant and easily accessible for most of the period they were used. New fossil fuel reserves that were being discovered were seemingly abundant and were easily accessible which made them very cheap in terms of cost. Eventually they started running out of the easily accessible reserves, the new reserves they started finding were getting increasingly difficult and costly to extract. This, however was not a major problem because technological advancements helped with the extraction process and so prices did not rise significantly much for a while. In the meantime, oil production continued to grow to meet with demand, and oil companies enjoyed major profits while oil producing countries were experiencing fast economic growth (Zenghelis 2012).
The Arab oil embargo caused fuel prices to rise in 1973 (Morgan et al. 1986a), and this rang alarms as it caused the American economy to destabilise. Crude oil production rose from the year 1988 to 2005 along with demand, but after 2005 the oil production has been constant while the price has been increasing (Murray & King 2012); this has been causing major fluctuations in pricing which is not good for economic stability.

Figure 1. An illustration of oil production and oil pricing trends along the years (Murray & King 2012).
There is a link between oil production and economic growth; oil producing countries have started to recognise this link. As oil reserves start running out, their economies slowdown in growth and can easily go into the negative, which is what they term economic recession. This is one major reason for governments to move away from the unsustainable use of fossil fuels and start developing alternative renewable energy sources that will be able to compensate for the fall of fossil fuels. Some people are of the opinion that the way to a sustainable future is to improve the energy efficiency of current technology that makes use of fossil fuels (Morgan et al. 1986c). For instance we are currently using 55 × 1018 Joules from a primary energy of 475 × 1018 Joules globally; most of it is wasted primarily as heat energy (Murray & King 2012). Therefore, all this lost energy can be put to good use this leading to reduced use of our fossil fuel energy sources. Techniques like cogeneration can give a rise in energy efficiency by as much as 40%, countries like the United States offer incentives for energy providers that use this technique (Morgan et al. 1986b). I however disagree that improving the energy efficiency would be a good solution because it is only a short-term solution. In the long run such solutions can be counterproductive (Tainter 2011); a rebound effect is bound to occur. This rise in energy efficiency is bound to have its beneficial effects offset; an example is in the early 1970’s in America, the rise of fuel economy in American cars only led to a rise in the total mileage of American drivers (Tainter 2011).
Ecological Problem
Another major problem, that is largely ignored, associated with the current use of fossil fuels is the negative effects they have on the planet. They have resulted in climate change which has caused the average global temperatures to rise with organisations like the IPCC and many others agreeing human activities are causing climate change, with fossil fuels being a major cause of this.
The issue of global warming has been a major concern and governments have come to recognise that carbon emissions from fossil fuels are the leading cause of this issue. This has led to a number of countries signing of the UN Paris Agreement in 2015, in which they agreed to keep the global temperatures well below 2o C above pre-industrial levels (United Nations Framework Convention on Climate Change 2015). The agreement was the first of its kind with most of the countries in the world agreeing to this deal to minimise carbon emissions.
Green Growth as a Reason to Push for Renewable Energy
Renewable energy sources are offering new life for alternative energy sources. Renewable energies have the advantage of being abundant, and they have zero or even negligible running costs. Renewable energy was initially expensive, but as with all energy sources, economies of scale lead to its drop-in pricing. Some researchers had suggested that renewable energy did not have the capacity to achieve economies of scale (Fouquet 2010) but they had underestimated the effect government subsidies would have. With a reduction in electricity costs driven by subsidies, eventually there will no longer be a necessity for subsidies in countries with governments that have poured money into renewable energy; this trend may be observed in other countries that follow suit. In 1990 renewables contributed only 1.3% of global energy, this has grown to 7% as of 2017 (The Economist 2017b). They have widely grown in popularity due to the large investments that had been pumped into research and manufacturing of these renewable energy technologies, $150 billion was invested in 2015 alone (The Economist 2017a). The UNEP had suggested adding additional funds for the green growth scheme, but it was then suggested they had overlooked the issue of where to find the extra funding. It has been suggested that governments reallocate funds instead of having to make additional funding (Victor & Jackson 2011).
European and Asian countries are the leader in the renewables race (Jänicke 2012), with Africa lagging despite its richness and large potential for renewable resources. America has not vigorously pursued renewable energy due to of the discovery of fracking; the shale gas reserves are bound to last them for several years to come (Murray & King 2012); how long that is, is up for debate.
Some European countries have set goals for renewable energy and the results have gone better than expected, take for instance Scotland, it had set its goal for 50% renewable energy by 2020 but that went better than expected and in 2011 they changed the goal to 100% (Jänicke 2012). Asia has also followed the same suit and has heavily invested and focused on renewable energy; thus, turning out to be a competition between Europe and Asia. The reason for their success is due to the approach they have taken on renewable energy, they have made their policies more of industrial policies than environmental policies. Countries like Germany, China and South Korea intend on being global market leaders of renewable energy. They not only produce renewable energy for themselves but they also intend on supplying the technology they develop to other countries around the world since climate change is a global issue (Jänicke 2012). The renewable energy competition is stiff, this is driving innovation, improving efficiency in green technology and creating a major drop-in cost.
Green Growth can only be achieved by government intervention and investing in the green sector; private investors are fearful of investing because they are uncertain about the green future. Governments need to take the risk of investing into the sector using public funds; once the private sector sees positive results they will start investing their money. After a meeting of Finance Ministers and Central Bank Governors in 2012, the Communiqué suggested international organisations should attempt to fit in green growth and sustainable development policies into the agendas of countries. Such structural reform would be specific to a countries level of development and its conditions (Zenghelis 2012). Policy is a make or break factor, if a policy is favourable to investors it will be a sign that an investment into the green sector will generate revenue. Not only policy can be used to stimulate green growth; imposing carbon taxes or energy efficiency standards can also help direct growth towards the green economy.
The benefits of ‘Green Growth’ are not only to the environment but also include a country’s economy; it provides employment, improves equity and reduces poverty as was predicted by the UNEP in their ‘Green Economy Report’ (Jänicke 2012). A green economy will not grow faster than a brown economy but it will provide better economic stability in the long run. Granted initial investment in renewable energy can be expensive but in the long run it is less costly since there are negligible running costs. Investing in renewable energy will especially benefit developing countries by providing abundant sources of energy which will enable further national development, and can arguably remove a country from economic recession (Zenghelis 2012), and provide employment and create skills. Green growth lowers the cost of electricity, with lower electricity costs more people gain access to electricity including the poorer populations. Electricity access empowers the poor population through better access to education and gives them the ability to start small businesses that are not possible without cheap electricity; hence alleviating poverty. A policy proposal for the Chinese government was emphasising how energy saving and environmental protection investments could reduce energy costs and healthcare costs by as much as 1% in their Gross Domestic Product and create 11 million jobs in the process (Jänicke 2012). What makes green policy attractive is that it is not financially demanding, and revenue from carbon taxing can be diverted the implementation of the policies. A green policy will assist in meeting the targets of the UN Paris Agreement by reducing the carbon footprint of countries that agreed to the deal.
Lessons from Past Energy Transitions
Looking at past energy transitions can offer some insight into how future energy transitions occur over time. It took coal more than 200 years to penetrate the energy market, this was due to technological constraints and the cost. Only after the technological issue was solved was it widely adapted in both homes and industry. Gas took a little over 100 years to spread across the market, cost was the limiting factor and better efficiency was beneficial to the drive to dominance (Fouquet 2010). We can tell from past energy transitions that it is a long process that takes time and money. What usually drives a transition is better efficiency, low cost and improvement in supply and services; it is predicted it will take generations for our reliance on fossil fuels to disappear (Smil 2016). The industrial revolution seems to have accelerated the rate of energy transitions (Fouquet 2010).
Challenges Faced by Renewable Energy
Solar
Solar energy is abundant but it is not a continuous energy source, the sun does not shine 24 hours a day, this creates an intermittence issue. On cloudy days, the solar energy is not as intense as on a sunny day, on such cloudy days less energy is produced; it can lead to energy blackouts. On days when energy is low there is a need for alternative sources and fossil fuel power plants are the ones that are usually used for backup; there is a persistence dependence on fossil fuels even though solar energy is abundant. It is not every geographical region that is suitable for solar energy, equatorial regions experience persistent cloud cover so this reduces solar energy effectiveness in this region. Mid-latitude regions experience seasonal variations in solar radiation; and therefore, cannot solely rely on solar energy.
Wind
A similar intermittence issue is found in wind energy, wind speeds less than 16 Km/ hour are not suitable for wind turbines (Morgan et al. 1986b). Wind speed and frequency are geographically dependent variables which does not make this technology suitable for every country. In some regions, fast winds are a seasonal phenomenon; there is the same problem of dependence on fossil fuel power plants on days when there are no fast-moving winds.
Biogas
Biogas production uses human and animal waste to produce methane. Animal waste restores fertility to the soil; therefore, extensive use of animal waste will take away this natural process of nutrient cycling. The waste from the biogas digesters has lower levels of nutrients than the initial waste.
Liquid Fuels
Renewable energy does not look likely to be replacing liquid fossil fuels any time soon especially in the automobile industry. The automobile industry has such a large dependence on liquid fuels, governments have tried blending petrol with ethanol and using vegetable oil in diesel engines but there are problems that arise. These are all sources that come from agricultural sources, so two problems are encountered. Firstly, they will be competing with the food market, which creates an ethical dilemma; should you sacrifice food for automobile fuel? Such a competition between the food and automobile industry will cause a rise in food prices. Secondly it will take large amounts of land to grow enough crops to facilitate both the food market and the automobile market without affecting food costs. Increasing the amount of agricultural land as it is not recommended as agricultural expansion already has negative ecological effects.
Falling Electricity Costs
The cost of renewable energy has fallen considerably, thus giving this energy source an edge over fossil fuels. Fossil fuels have become the primary energy source partly because they are cheap; renewable energy has zero or negligible running cost which makes it a very attractive alternative to fossil fuels. The reduction in electricity cost is good, but it is also bad because it causes a fall in the cost of electricity and drives out more expensive providers like coal power plants by taking business from them. This would be ideal if the renewable energies were constantly available but that is not the case, they are not continuous sources of energy. The same fossil fuel power plants being driven out of business are the same ones the renewable energy sources fall on to compensate on the grid when they are unable to run at full capacity.
Business is all about revenue; with the whole sale cost of electricity falling it means there is less revenue for electricity providers, this chases away investors. This creates a situation where governments must subsidies the conventional power plants to keep them running. The more a government subsidises renewable energy and the more successful it is, the more it must subsidies conventional power plants to keep them running. In China, they ended up limiting wind farms to keep coal power plants running; energy was becoming too cheap and out competing the coal power plants. In the renewable sector the low revenue generated over time deters investors; in the Unites States renewable energy rich regions are struggling to find investors to build new plants due to the low revenues generated over long periods of time (The Economist 2017c). This creates a vicious cycle of the clean energy paradox, as it was perfectly put by Ronaldo Fuentes of Karpac: “The more successful you are in increasing renewables penetration, the more expensive and less effective the policy becomes.” (The Economist 2017a).
Renewables are taking the market away from the conventional power plants; the fewer the people are relying on the grid the fewer the people that are left to share the costs of running the power plants. This creates a rise in individual electricity costs and as a result more people will decide to go for renewable energy, it is a vicious cycle. The lower the whole sale cost of electricity is, the more the market will shift to cheaper renewable energy; such is the case in Australia (The Economist 2017a).
As was put by Simon Muller of IEA: “Thinking of wind and solar as a solution by themselves is not enough. You need flexibility on the other side. It only makes sense if this is a package deal,” (The Economist 2017a).
There needs to be a balance in the energy sector which can be directed by policy makers, if this is not done there will be a slowdown in the transition to renewable energy.
Conclusion
The shift towards a sustainable future is imperative and renewable energy is important if we are to move towards that goal. We have enjoyed the benefits of fossil fuels long enough and still are going to continue to make use of them in the coming future, but the shift from our sole dependence on them is occurring. The need for investment into renewable energy is a necessity if we are going to achieve the goal of reducing carbon emissions, and imposing carbon taxes has helped with the reducing emissions and making a transition to renewables.
It is no longer only about saving the environment, there are economic reasons for a transition, which are a bigger motivation for governments to enforce this transition to clean energy. This will assist with continued economic growth and even help countries in economic recession. Green growth will promote equity; reduce poverty; promote economic growth; provide energy security which can also be regarded as a national security issue. Government investment into the green sector will show private investors it is the right path to follow and policies will also encourage private investment.
The automobile industry is not likely to find replacements for liquid fuels in the near future, though biotechnology might be a possible solution for the ethanol production and vegetable oil production problems; recent efforts have been made to move to using electric cars instead. This puts emphasis on the need to use renewable energy if the transition to an electric car future is to be successful in cutting down emissions.
Complexity arises from problem solving, from those complexities more problems will arise that we need to solve (Tainter 2011). Policy makers need to adjust their policies so that they will not run conventional power plants out of business as they are still needed due to the intermittency of current renewable energy. It has been suggested that there should be an adjustment to electricity billing so that it is done accordingly to the abundance of energy; and governments will need to subsidise conventional power plants to keep them running as electricity tariffs fall (The Economist 2017a). If this issue is not solved it will slow down the transition towards a sustainable renewable energy future, which past energy transitions have shown is often a long transition. With the explosion of the Internet Of Things (IOT) it can help create smart global electricity grids that can compensate each other when one region falls short.
Part B: Argument for The Importance of a Dedicated National Renewable Energy Policy to Enable a Successful Transition to Renewable Energy.
Introduction
This case study is focused on the national energy policies which are aimed at empowering the economies they have been drawn up for; these policies intend on creating economic growth, social equity and poverty reduction. The energy policies are aimed at promoting energy generation in a sustainable manner with renewable energy partly as a way for sustainable growth. The case study will reflect and contrast on two national energy policies; those of Pakistan and Zimbabwe, both which are regarded as developing nations. Both are nations that are aiming for economic growth as a way of reducing poverty; they both have limited financial resources to generate enough electricity to meet demand and for the implementation of their policies.
Both countries are part of the 194 countries that agreed to the 2015 UN Paris Agreement which aimed at reducing each party’s carbon footprint. Both countries are importers of fossil fuel based products, and both are weary of the fact that oil prices are always fluctuating. Both countries are aiming to reduce their dependence on such fuels as a matter of national security and for continuous economic growth, since they are both oil importers.
The case study aims to create a comparison on how the two countries drew up their national energy policies; analyse how they intended on implementing their strategies for sustainable development, and reflect on whether they focused on green growth as part of that strategy. The case study also investigates if they focused on environmental needs and protection. The case study will shed light on each government’s role in the transition to renewable energy. There will be an attempt to identify the progress the two nations have made in the renewable energy sector from the conception of their policies.
Pakistani Energy Situation
At the time the government of Pakistan released it national energy policy in 2013 it was facing some challenges in the energy sector; it was in a situation where demand was far exceeding supply by a gap of 1000 MW (Government of Pakistan 2013). The national power policy was aimed at reducing the energy supply deficit, in doing so it would also be aiming at economic growth and social development. The government explicitly stated that its goals were to be achieved in a sustainable and affordable manner. The electricity charges were high at the time due to the dependence on thermal energy sources which constituted 44% of the national energy supply; RFO and HSD were the contributors in the thermal energy supply (Government of Pakistan 2013). The government acknowledged the need to move away from imported fossil fuels which have highly unstable prices and are continuously rising; the government considered this to be a matter of national security. The government wanted to shift towards cheaper energy sources and eventually move to renewable energy as a long-term goal. The national policy had three main principles:
Efficiency
There would be a shift towards low cost energy, and an encouragement of automation to optimise transmission.
Competition
The involvement of the private sector is considered important to improve infrastructure development and to drive down power electricity costs.
Sustainability
This a long-term goal within the policy, they had drafted different strategies to ensure the achievement of this goal. The implementation of energy efficient buildings to reduce resource use and technology standards for energy use. Another strategy was the creation of a green star compliance system. There was a metering system put in place that would vary electricity charges by time of day according to peak use, this is meant to encourage more efficient electricity use. They decided to subsidies low cost renewable energy among the consumers, to promote use of green technology.
Pakistani Renewable Energy Potential
The country experiences regular winds with average speeds that exceed 7 m/s at sites near to the coast, which makes it ideal for wind energy generation.
There is great hydro potential in Pakistan, it has multiple major rivers running inland. The national hydro potential was estimated to be about 45000 MW, only 6608 MW of hydro energy were generated in 2006 (Ali Jatoi 2006).
There is high solar potential in Pakistan, the country receives over 3000 hours of sunshine a year. This is abundant energy that was untapped not more than a few decades ago.
The country has plenty of biomass energy potential, it produces large quantities of animal and agricultural waste. With a population of over 150 million people it has large sewage waste production, which can be tapped into for energy.
Reasons for the Pakistani Government to Aim for a Transition to Renewable Energy
The government of Pakistan had a number of reasons for drafting a renewable energy policy that would direct a transition towards green energy sources at a national level (Ali Jatoi 2006).
Environmental Protection
The fossil fuels that the country is largely dependent on have negative environmental effects; the carbon emissions produced by the fossil fuels they use for thermal energy generation create a greenhouse effect on the global atmosphere. The move towards renewable energy is aimed at displacing the high carbon footprint the fossil fuels leave on the planet.
Intensive fossil fuel use is unsustainable due to the fact that the reserves are limited on the planet. At the rate the nation and the rest of the globe consumes carbon fuels, they are bound to run out at some point; sooner rather than later. The oil production has already failed to rise and meet demand since 2005; oil production is going to fall, and alternative energy sources will be required. Renewable energy was seen as the solution to the problem by the government of Pakistan.
Energy Security
Pakistan imports the fossil fuels it uses; if a situation like the Arab oil embargo is to occur the country would be in trouble. The country’s dependence on fossil fuels creates additional costs and risks that come with transporting and stocking the fuels, and the need to create temporary substitution arrangements in the event of shortages. Renewable energy will cut the risks and costs if or when such events do take place.
Social Equity
Renewable energy can create decentralised power generation and provide electricity to the poorer populations found in remote/ rural areas. Electricity access will create greater opportunities for those communities and improve their living standards.
Economic Benefits
The government of Pakistan believes renewable energy will add to the electricity generated by the nation and reduce the electricity generation gap that has been failing to meet demand. This reduction will improve overall economic productivity, and create more opportunities for income generation. Renewable energy will nationally create business and employment opportunities that will lead to economic growth through the green sector, economic growth my renewable energy is the ‘Green Growth’ that was emphasised in the literature review.
Renewable energy will drive down the cost of electricity since it is aimed for it to be competitive on a least cost basis with conventional fuel sources. Renewable energy has got the advantage of lower costs that come with the day to day running of the plants when compared to conventional plants. There is no need for fuel purchasing and transportation, this makes it beneficial especially for remote areas. Decentralised renewable energy will be advantageous when it comes to reducing energy losses that come with energy distribution, thereby increasing energy efficiency in terms of distribution.
Pakistani Renewable Energy Policy
In 2006 the Pakistani government released a dedicated renewable energy policy specifically targeted at promoting a transition towards renewable energy, this document was separate from the National Power Policy which was generalised for the whole energy sector.
The policy was targeting wind, solar and hydro energy promotion; the government set a goal of producing 9700 MW from renewable energy by 2030. This target was to be achieved with the assistance of the private sector, it was to be done with the assistance and guidance of the government. For the policy to enable the energy sector to reach the set target by 2030 they set several measures to attract private investors. The government setup a body called The AEDB to oversee the development of renewable energy. Investors can go to this government body for approval of renewable energy projects without going through the usual multi-step process, which conventional energy suppliers must go through to start power generating projects.
The policy aimed at providing electricity to remote and otherwise unprofitable areas that few private investors would want to put their money in. The government started public funded projects and NGO sponsored projects in these remote areas and set an example for private investors on the effectiveness of such renewable energy projects. Once private investors are convinced by the effectiveness of renewable energy projects they are encouraged follow suit.
To facilitate private investment into the renewable energy projects that connect to the grid they ensured investors there would be guaranteed payment from the public sector for energy generated. It was made mandatory for any power distributors to buy electricity from renewable energy power producers. Renewable energy suppliers can sell electricity directly to the end user while forgoing the general power distributor, this is something other conventional power plants are not allowed to do. Power purchasing agreements were made simpler for renewable energy providers as compared to the thermal power producers (Ali Jatoi 2006).
The intermittency of renewable energy projects like hydro, solar and wind tend to put off investors, when the projects are not running during their downtime that is money that is not being generated. To encourage investors despite this intermittency problem, the government put in place a mechanism to compensate suppliers during their down time. A benchmark is set up by an external party to find the average energy generated when wind, solar radiation or water flow are appropriate within a month; the compensation will be derived from the deviation from this benchmark. Redeemable carbon credits are available for renewable energy providers, which was not stated in the National Energy Policy. Renewable energy suppliers can divert surplus energy to the grid and are entitled to receive the same amount from the grid to another location without payment.
To financially support renewable energy investors the government gave investors access to loans from Pakistani banks. Investors were given leeway to import renewable energy machinery while being exempted from customs duty and sales tax on such machinery. They were exempted from income tax, a benefit thermal power producers do not enjoy. Renewable energy companies could sell discounted shares, which is otherwise illegal by law for any other company to do so in Pakistan.
The Pakistani government established as separate program in 2000 to promote biogas production in the country, especially in rural areas. There were 1200 plants in operation when the BSP started. The government offered to pay a 75% interest subsidy on bank loans given by banks for biogas projects (Ilyas 2006). The aim of the government was to replace imported fuels with Pakistani fuel sources. The government sponsored research into bio-digester designs, and it extensively promoted biogas use through posters, calendars and leaflets to gain people’s attention.
Renewable Energy Progress in Pakistan
The transition to renewable energy has been a slow one in Pakistan, this point was stated in the literature review that such energy transitions take time, history has taught us this lesson. It took a while for the wind energy sector to get started and begin taking advantage of wind energy. Wind power generating projects only started to kick off around 2013, 7 years after the publication of the renewable energy policy. It was until 2012 that only 6 MW of energy were being produced nationwide by the wind energy sector (Baloch et al. 2016) as shown in Figure 1; 6 MW is not much considering how much hydro power was generating at the time, it was a negligible amount of energy compared to the total national energy output.

Figure 2. Wind generation capacity over the years starting from 2006, the year the renewable energy policy was published. The 2017 and 2018 data sets are for projects due for completion in their respective years.
The AEDB had issued several LOI since the policy was published, but very few projects had managed to be completed (Baloch et al. 2016). It was difficult for interested parties to complete the projects they had intended on starting, this was mostly due to the government’s inability to allocate resources for the grid development.
Solar projects also took a while for them to kick start; the first solar farm started generating power in 2015, it was a 100 MW plant. The solar farm is called the QASP located in the Cholistan desert, it only took 3 months to build (Ebrahim, Zofeen 2015). This demonstrates solar plants do not take long periods to construct with the right financing when compared with fossil fuel power plants.

Figure 3. Quaid-e-Azam Solar Power (QASP) (Ebrahim, Zofeen 2015).

Figure 4. Solar generation capacity over the years starting from 2006, the year the renewable energy policy was published. The 2017 and 2018 data sets are for projects due for completion in their respective years.
The QASP solar plant is currently reducing the country’s carbon emissions by 90750 tonnes a year (Ebrahim, Zofeen 2015). The solar farm is due to be extended, by the time it is completed in 2018 it will be generating 1000 MW of energy. The QASAP solar plant is a publicly sponsored project; the public sector is spearheading the solar energy initiative. This initiative has sparked investor interest, according to the AEDB there are 35 projects under development.
As predicted the cost of renewable energy has been declining (Baloch et al. 2016) and is expected to continue with this trend. The tariff decline for both wind and solar energy is illustrated in Figure 4. The more investment that is made into wind and solar energy, the more the tariffs are going to fall over time, making electricity more affordable for the poorer population.

Figure 5. Declining electricity Tariffs for wind and solar energy in Pakistan (Baloch et al. 2016).
Biogas has become popular in Pakistan as an energy source. Pakistan has a large agricultural base with 70% of the population in the agriculture sector. The country took advantage of this fact and pushed for biogas use, as a result of the program 62% of those in rural areas ended up using biomass energy while only 24% still buy wood (Ilyas 2006). The advantage of the biomass program is that it generates biogas for energy and the slurry is used as crop fertiliser.
Zimbabwe Energy Situation
There are 5 main energy sectors in Zimbabwe that contribute to the electricity demand. There is currently an inability to meet demand and constant load shedding nationwide. The country does not have oil so it depends on importing refined petrol since the oil refinery that was located close to Mutare was closed down, this adds on to the country’s energy expenditure financially. To try to meet energy demand the country imports electricity from Zambia, Mozambique and South Africa, making the total amount of money spent on energy higher. The country has a large dependence on external sources of energy, which makes electricity and fuel costs high. This high cost of electricity leaves most of the population without electricity access.
Zimbabwe has large coal reserves which are estimated to be around 12 billion metric tonnes; it is assumed there might be more coal deposits in the country that are yet to be discovered. There are an estimated 40 terra cubic feet of CBM in reserves (Republic of Zimbabwe 2012). Since there are large coal reserves in the country, the country depends on coal as the main energy source for electricity generation. The country intends on exporting coal, but it is also understood that this can lead to unsustainable mining of coal and may lead to depleted reserves in the long run. Zimbabwe also has hydro energy which contributes to the national electricity supply, and it still has more hydro energy potential that remains untapped.
The average wind speeds in Zimbabwe are 3 m/s which are too slow for generating electricity. Wind energy is not a viable option for the country.
The country currently uses wood as the main fuel source, contributing 61% of the total energy supply, used mainly for heating and cooking (Republic of Zimbabwe 2012). Wood is the largest fuel source because most of the population does not have access to electricity so wood is the only source of energy available to them to meet their needs. 6 million tonnes of wood a year are used as fuel, 4.6 million tonnes a year was estimated to be the sustainable rate of wood fuel use (Republic of Zimbabwe 2012).
Zimbabwe National Energy Policy
The country does not have a dedicated renewable energy policy like Pakistan, instead it put the renewable energy plan into the National Energy Policy. Some of the goals of the national policy are to increase affordable electricity access for the population; sustainable economic growth and develop renewable energy which will complement conventional energy sources. In contrast to the Pakistani government the Zimbabwean government is aiming to attract private investment into the energy sector by engaging in a Public- Private Partnership, international private investors are not allowed to be in the energy generation sector independently, including renewable energy.
The National Energy Policy was focussed on the increased exploitation of coal and CBM as energy sources since they are assumed to be present in large quantities within the countries boarders. Within the policy, the government stated it was aware that both coal and CBM are finite resources and suggested increasing efficiency of the technology that utilises such fuels. The country has got a large agricultural industry, it produces large amounts of agricultural and livestock waste, as well as human sewage waste. In the policy, there was no strategy on increasing biogas production in the country using agricultural, livestock and human waste; the biogas produced can be combined with the CBM and be supplied to the population at a cheap cost for cooking purposes. This will greatly reduce pressure on wood fuel use if it works in tandem with the government’s strategy of increasing the tree planting rate, from 10 million trees a year to 20 million trees a year by 2015.
The policy clearly stated it wanted to increase the energy generated by hydro power, it set a target of 1100 MW of extra energy generated by 2020. Hydro power was the focus for renewable energy generation; to attract investment the government set a 50% reduction on taxes, licence fees and rates (Republic of Zimbabwe 2012). On the renewable energy side of liquid fuels the government intended on reducing fossil fuel imports and decided to blend petrol with ethanol produced from sugar cane grown in the country. Diesel was to be blended with biodiesel produced from jatropha and castor beans, these were chosen instead of food sources to avoid an ethical issue of diverting food to the automobile industry.
The policy to promote solar energy use in the country was aiming at solar use at household scale. The country gets 3000 hours of sunshine a year, this can generate as much as 10000 GW a year (Republic of Zimbabwe 2012), it is a useful resource base to tap into. Some money is collected from energy efficiency penalties is to be directed to solar subsidies, but it was not a clear-cut plan, it was more of a suggestion. The policy stated there were to be incentives for households that install solar geyser on existing electric geysers; and from 2013 it was mandatory for every new household to install a solar geyser. Non- compliance of new households means a penalty in the form of higher electricity charges; this is not a penalty because it is an inevitable consequence of using an electric geyser, most people who choose this type of geyser are fully aware of the extra electricity costs and are prepared to pay for them. It would be a better strategy to place higher taxes on electric geysers to deter people from buying them. From the national policy, the Zimbabwean government has not set a proper platform for major scale solar project investments, which is what they should be focusing on since in the policy itself they stated most people cannot afford the high up-front costs; there is a 15% duty charge on imported solar equipment (Lubinda 2016). The Pakistani government was aware that most people cannot afford the costs of personally installing solar systems in their homes so it started a solar farm project to supply energy to the national grid. The Zimbabwean government is depending on the general population to install solar systems in their homes instead of undertaking major solar projects to supply electric energy to the grid. The government could have redirected investment into a solar farm instead of building the Dema diesel power plant which generates 200 MW of energy; the plant produces 1072 tonnes of carbon dioxide a day (Mpofu & Mambo 2016). The power plant not only contributes to air pollution but is also dependant on imported diesel, which is unsustainable.
The Zimbabwean government assigned the Rural Electrification Fund (RUF) with the responsibility of leading the renewable energy program. The RUF gets its funding from electricity levies charged to consumers and surplus income generated by ZERA from petroleum and general energy accounts whenever ZERA deems it appropriate (Republic of Zimbabwe 2012). RUF is supposed to increase usage and investment into renewable energy and increase modern energy access in rural areas. It is also assigned with the task of finding funding for the renewable energy programme.
Renewable Energy Progress in Zimbabwe
The long standing hydro energy power plants that were installed years before the new energy policy was published are the same ones running to date; no new hydro power plants are running now. There are hydro projects that are currently being planned for construction or being constructed which will add more power to the national grid if completed, Table 1 shows some information on the hydro projects.
Table 1. Hydro energy projects in Zimbabwe

As of 2012 there were no solar projects running, there was only one project in the pipeline which was the 100 MW Gwanda Solar plant (World Bank 2017). Until now the project is still under feasibility studies. There is the Green Rhino Energy solar project that is being planned for a 50 MW power station in Marondera, but that is still pending (Green Rhino 2017). The national policy is struggling to bring investment into the renewable energy sector, fossil fuel power sectors are not struggling to find investment though. There are fossil fuel projects that have seen greater progress in the same period; some have already been completed while some are due for completion soon.
Zimbabwe is an agricultural nation that generates a lot of biomass just like Pakistan; the country started a National Domestic Biogas Programme in 2013, it is a collaboration between governmental institutions and SNV, an NGO. The program is targeting rural households and has installed roughly 150 bio-digesters, benefiting 1385 households (SNV 2017). There are other small scale projects that are currently constructing biogas digesters in rural areas across the country.
Conclusion
To conclude this case study, for there to be a successful transition to renewable energy there needs to be government involvement. Governments need to create a dedicated renewable energy policy like in the case of Pakistan, this is done to create direction and strategies how to attract the interaction of the public and private sector. Pakistan with its renewable energy policy managed to attract investment into the renewable sector while providing attractive incentives for private investors through leading by example by establishing projects and conducting research. In the case of Zimbabwe, it does not have a dedicated renewable energy policy and the government is not leading the way towards renewable energy in any way. The only renewable energy that has seen progress is the biogas project because the government created a programme for that. If a nation is to focus on green economic growth active participation of both the public and the private sector is required to foster a transition to a sustainable future.
References
Ali Jatoi, L., 2006. Policy for Development of Renewable Energy for Power Generation Minister for Water and Power Policy for Development of Renewable Energy for Power Generation, 2006 Government of Pakistan.
Baloch, M.H., Kaloi, G.S. & Memon, Z.A., 2016. Current scenario of the wind energy in Pakistan challenges and future perspectives: A case study. Energy Reports, 2, pp.201–210. Available at: http://dx.doi.org/10.1016/j.egyr.2016.08.002.
Ebrahim, Zofeen, T., 2015. World’s largest solar park to light up Pakistan’s future. Dawn. Available at: https://www.dawn.com/news/1205484.
Fouquet, R., 2010. The slow search for solutions: Lessons from historical energy transitions by sector and service. Energy Policy, 38(11), pp.6586–6596. Available at: http://dx.doi.org/10.1016/j.enpol.2010.06.029.
Government of Pakistan, 2013. National Power Policy. , pp.1–19.
Green Rhino, 2017. Projects in Zimbabwe | Green Rhino Energy. Green Rhino. Available at: http://www.greenrhinoenergy.com/projects/zimbabwe/ [Accessed April 8, 2017].
Ilyas, S.Z., 2006. Biogas Support Program Is a Reason for its Success in Pakistan. American Eurasian Jounral of Scientific Research, 1(1), pp.42–45. Jänicke, M., 2012. “Green growth”: From a growing eco-industry to economic sustainability. Energy Policy, 48, pp.13–21.
Lubinda, L., 2016. Prohibitive Costs Deter Zimbabweans From Embrassing Solar Energy. ZimNews. Available at: https://zimnews.net/solar-too-expensive-in-zim/.
Morgan, M.D., Morgan, J.M. & Wiersma, J.H., 1986a. Contemporary Energy Issues. In Introduction To Environmental Science. New York: Freeman.
Morgan, M.D., Morgan, J.M. & Wiersma, J.H., 1986b. Energy Alternatives. In Introduction To Environmental Science. New York: Freeman.
Morgan, M.D., Morgan, J.M. & Wiersma, J.H., 1986c. Toward a Sustainable Future. In Introduction To Environmental Science. New York: Freeman.
Mpofu, B. & Mambo, E., 2016. Dema plant: A case of sleaze and pollution - The Zimbabwe Independent. The Independent. Available at: https://www.theindependent.co.zw/2016/10/07/dema-plant-case-sleaze-pollution/.
Murray, J. & King, D., 2012. Comment: Oil’s tipping point has passed. Nature, 481(January), pp.433–435.
Plumer, B., 2017. Trump’s big new executive order to tear up Obama’s climate policies, explained - Vox. Vox. Available at: http://www.vox.com/energy-and-environment/2017/3/27/14922516/trump-executive-order-climate [Accessed April 8, 2017].
Republic of Zimbabwe, 2012. National Energy Policy. Available at: http://www.zera.co.zw/index_htm_files/Energy_Policy.pdf.
Smil, V., 2016. Examining energy transitions: A dozen insights based on performance. Energy Research and Social Science, 22, pp.194–197. Available at: http://dx.doi.org/10.1016/j.erss.2016.08.017.
SNV, 2017. National Domestic Biogas Programme - Zimbabwe | SNV World. Netherlands Development Organisation. Available at: http://www.snv.org/project/national-domestic-biogas-programme-zimbabwe [Accessed April 1, 2017].
Tainter, J.A., 2011. Energy, complexity, and sustainability: A historical perspective. Environmental Innovation and Societal Transitions, 1(1), pp.89–95.
The Economist, 2017a. Renewable energy: A world turned upside down. The Economist. Available at: http://www.economist.com/news/briefing/21717365-wind-and-solar-energy-are-disrupting-century-old-model-providing-electricity-what-will [Accessed March 17, 2017].
The Economist, 2017b. Wind and solar power are disrupting electricity systems. The Economist.
The Economist, 2017c. Wind and solar power are disrupting electricity systems. The Economist. Available at: http://www.economist.com/news/leaders/21717371-thats-no-reason-governments-stop-supporting-them-wind-and-solar-power-are-disrupting.
United Nations Framework Convention on Climate Change, 2015. Paris Agreement. , pp.1–16.
Victor, P. & Jackson, T., 2011. Doing the maths on the green economy. Nature, 295, pp.472295–472295.
World Bank, 2017. Data on Renewable Energy Projects in Zimbabwe - Renewable Energy Database - The World Bank. World Bank. Available at: http://ppi-re.worldbank.org/Snapshots/Country/zimbabwe [Accessed April 8, 2017].
Zenghelis, D., 2012. “A strategy for restoring confidence and economic growth through green investment and innovation.” Grantham Research Institute on Climate Change and the Environment, (April), pp.1–32.
Author: Taringana William Nyamunda
#renewable energy#sustainable#development#pakistan#zimbabwe#solar energy#wind energy#biogas#green growth
0 notes
Link
Amongst the many fallacies that the former president foisted upon the American people was 2015 Paris Climate Change Agreement.
While technically and legally a treaty, Obama signed it without it ever being ratified by the Senate, making our participation in it totally illegal according to the Constitution.
President Trump just solved that problem by declaring that the USA was withdrawing from the Paris agreement.
Trump is fulfilling yet another campaign promise and saving the country billions of dollars at the same time. Yet while conservatives everywhere applaud his actions, the liberal left is talking about how Trump’s actions will mean the end of the world.
The Ice Age that Never Came
In my opinion, global warming, or climate change as it is now called, is nothing but false science. The entire climate debate is driven by computer models, and anyone who knows anything about computer modeling can tell you that you can make models give you whatever results you want them too. It’s all in how you write the model and what data you give it.
Not all that long ago, the climate debate was about global cooling, rather than global warming. According to the environmentalists of the 1970s, we were entering into a new ice age, which would destroy all live. Their solution was to take billions of dollars away from rich countries and give that money to poor countries.
Then, there was a change in the wind and global cooling was replaced by global warming. Once again the environmentalists had a solution; take billions of dollars away from rich countries and give it to poor countries. Now that global warming has been proven to be fake, they changed its name to climate change and came up with a solution… you guessed it.
Clearly, the issue isn’t whether the world is warming or cooling. It’s about getting money into the hands of politicians, so that they can further their globalist goals and redistribute the wealth. Climate change, by any name, isn’t a science, it’s a religion, one which the left is trying to force upon us through political correctness, calling people “climate change deniers” and taking out tax dollars.
The reality of climate change is nothing like what the climate change movement claims. Yes, the climate changes; it has all through history and it probably will continue to change as long as the world exists. The world has known alternating warm and cool spells, long before man started burning fossil fuels.
Yet according to the left, man and man alone is responsible for the warming trend that their computer models show, once they massage the data. They have even gone so far as to name carbon dioxide a “greenhouse gas” and the biggest danger to the climate there is.
Obviously, these so-called scientists have forgotten their basic biology, or they would remember that animals breathe in oxygen and breathe out carbon dioxide and plants breathe in carbon dioxide and breathe out oxygen.
In fact, how would plant life would be served if we had a carbon dioxide level that was four to five times higher than what we have today? It happened before, during the Jurassic Period.
If were it to suddenly rise that high again, would we see an explosive growth of plant life around the globe? Would it be any reason to be concerned about the rain forests, as they would grow faster than the tribal farmers could cut clearings to farm? Under the circumstances, farmers would see incredible yields from their crops, going a long way towards solving global hunger, wouldn’t they?
But mankind is no more able to boost the carbon dioxide level to that point, than we are to prevent it from rising. That’s because the biggest producer of carbon dioxide in the world is the world’s oceans. After that, it’s the decomposition of biomass around the globe.
Compared to these two sources of carbon dioxide, what our atmosphere receives from the burning of fossil fuels is a miniscule amount.
Who’s Making the Difference?
Even so, the Paris agreement was supposed to be a turning point in mankind’s history, with mankind finally taking responsibility for our destruction of the climate and taking drastic action to put an end to that destruction. The goal of the summit and ensuing agreement was to reduce the average temperature of the Earth by two-tenths of a degree Celsius, by the turn of the next century.
Yet the agreement itself could only accomplish a few percentage points of even that miniscule goal, if every signatory nation fulfilled their commitment to the agreement. America’s commitment, which would have cost us billions of dollars, would account for only 0.023 degrees of change, by the end of the century.
One of the biggest problems with the agreement is that each nation is given permission to establish their own goals. Hence, China and India, the first and third largest consumers of coal, respectably, aren’t committing to reducing their coal consumption at all before 2030, the end date of the agreement.
In fact, China, which uses 41% of the coal burned in the world (more than the next 11 consumers combined), is planning on increasing their consumption of coal over the next decade and won’t even consider any reductions until after 2030.
So, what Obama and Kerry had negotiated was a treaty which hurt the United States, while allowing other countries to continue polluting. Even if we take the whole global warming hoax out of the equation and look at the agreement just from the viewpoint of polluting the world we all share, this was a horrible agreement. No wonder President Trump wants to get out of it.
By the way, the United States has drastically reduced our dependence on coal anyway, before the Paris agreement and before Obama’s war on coal. With the energy industry moving away from coal and towards natural gas, the cleanest burning fossil fuel there is, we are making great strides in reducing the pollution we create.
Of course, that creates another problem for the environmentalist; that of fracking. In order to harvest the nearly unlimited supply of natural gas trapped beneath the surface of the Earth, gas companies are using hydraulic fracking to push the gas out of the sedimentary layers in the ground and towards wells where it can be harvested.
Where is This All Going?
Getting out of the Paris agreement will be good for the country. The price tag on reducing global temperatures by 0.2°C by the turn of the century is $100 trillion (that’s not a typo).
By exiting the agreement, Trump is refusing to pay that blackmail and the high cost to our country. That will ultimately help taxpayers and businesses across the country. Oh and, all that money would have bought us essentially… nothing.
But what if it is real? What if global warming or global cooling were something that we should be concerned with? Would the methods that are being proposed by its proponents effective?
No. All that the politicians and environmentalists have done is to create a huge, expensive industry, which lines their pockets, without offering any real solutions. Spending $100 trillion without coming up with a solution isn’t effective use of money, no matter who you are.
Actually, the real cause of global climate fluctuations has been discovered. It’s caused by the main source of heat for the surface of the Earth… the Sun. Variations in the Earth’s orbit around the sun cause the warm and cool spells that have existed throughout the Earth’s history.
Nothing man has done or can do will affect that at all. The Earth will continue to go through alternating warm and cool spells, for as long as the Sun will shine and the Earth will continue its orbit around the Sun.
But let’s think about this for a moment. First of all, it appears that the orbital variations the Earth has been experiencing are evening out. As far as I know, no scientist has declared that, I’m just basing it on the fact that the “little ice age” of the 17th to 18th centuries was not as cold as previous ice ages. While there was an increase in polar ice, it didn’t come as far towards the equator as had previously happened.
Okay, so it looks like we’re safe; but what if we’re not? What if my conclusion is totally wrong? What if a huge asteroid hits the Earth with enough mass and energy to put more instability into the Earth’s orbit? Would we see an increase in the global warming and cooling periods?
Yes, most assuredly that would be the result.
In that case, with life on this Earth being such a delicate thing, how could mankind survive? What could we do to make it through another ice age or a period of global warming that brought surface temperatures up another 50 degrees? Is there an answer to that?
Actually, the answer to this question has been known for decades. While such a massive shift in the Earth’s temperature would cause massive amounts of plant and animal life to die, mankind could survive, taking at least some of nature along with us. The secret would be to go underground.
An underground bunker or even an underground city could be designed to maintain a reasonable temperature year round, even while the temperature on the surface was considerably hotter or colder than it is today. This solution was proposed as early as the 1970s, back when the argument was whether global warming or global cooling would kill us first.
Or there are other options that humankind could appeal to?
This article has been written by Bill White for Survivopedia.
References:
http://unfccc.int/paris_agreement/items/9485.php
https://skepticalscience.com/ice-age-predictions-in-1970s-intermediate.htm
http://www.dailywire.com/news/13817/scientists-we-know-what-really-causes-climate-james-barrett
http://www.livescience.com/44330-jurassic-dinosaur-carbon-dioxide.html
https://skepticalscience.com/human-co2-smaller-than-natural-emissions.htm
from Survivopedia Don't forget to visit the store and pick up some gear at The COR Outfitters. How prepared are you for emergencies? #SurvivalFirestarter #SurvivalBugOutBackpack #PrepperSurvivalPack #SHTFGear #SHTFBag
0 notes