#lookup function in excel
Explore tagged Tumblr posts
Visit Tumblr Blog
Explore Tumblr blogs with no restrictions, modern design and the best experience.
Last Seen Tumblr Blogs


Fun Fact
In Q3 of 2020, 31% of US users access the Tumblr app daily.
Text
Game Pile: For The Queers
For the Queers is a Descended from the Queen game, which is focused on developing queer relationship dynamics, at least, according to its copy text. It was produced by Scholastic Dragon Games and it’s available on itch.io and it’s in that particular category of $3 print-and-play games. Its presentation is a little ropy, it’s not exactly a looker of a game, and I don’t feel like it’s reasonable to pick on it for looking like it was made in Google Docs.
It is a challenging comparison to strike, though, because For The Queers is modelled on the storytelling pseudo-TTRPG, ‘For The Queen,’ a storytelling card game lauded for being, well, pretty solid, and for what amounts to a game of sitting around in a circle telling stories, it has a truly beautiful presentation and excellent approach. In addition to its sumptuous visuals, For the Queen is extremely well constructed in terms of its approach.
It’s built around a single deck of cards that’s set up so the first time you start the game, it’s already in order to teach you how to play the game and get you playing the game in the same fluid exchange. You just flip the cards off the top and go around reading them, in turn, for each player, until suddenly a card asks a player a question and they need to answer it. Using these questions, the players then construct a narrative, integrating the answers to one another’s questions, all building up to a dramatic conclusion to the whole narrative with a final card that, in For The Queen, is simply ‘The Queen Is Under Attack: Do you defend her?’
Everyone answers.
Game ends.
For The Queen, which is already such a simple game engine that it’s functionally impossible to control access to, has a SRD, a system reference document. You can make your own games that invoke it and use the same engine, which, like, you can do that anyway, because game rules are not copyrightable, but if you do it this way, with the SRD and invoking its branding, then you can connect your game to For The Queen, which is, you know, that’s cool. I like that, because it means that you can openly and directly show connections between games. Good stuff.
The central relationship in the story of For The Queers is that the characters are all given a central truth to their prompts: You are in the retinue of a royal, the Queen, who is ‘free of gender,’ and they are travelling with you to again, to journey to a distant land to broker an alliance, but also, this queen, they hold your heart. You are in their retinue, and they love you.
There’s a deeply different materiality to this game being a print-and-play of a paper sheet and an ordinary deck of playing cards. The game For the Queers is modelled on makes sure the deck of cards gets to be this enchanted device, a physically perfect device that controls the focus entirely. You flip a card, and that card presents the question. The art of the Queen in that game gets to be centralised and all the players are engaging with the question in front of them and only the question in front of them.
By comparison, For the Queers requires you look at the card flipped, then a lookup table, which is multiple pages long, and which has all the questions on it present ahead of time, meaning that it’s not hard for a player to mistakenly look at a question that they’re not ‘meant’ to (and isn’t even necessarily going to show up in the game), colouring their experience of the question.
It’s a testament to how a game system is not just the system but also how that system is presented. By putting the rules material in the most convenient to make form (a big a4/letter-printable sheet), the game is diminished in how it presents things that aren’t relevant to the players in the play experience. It’s hardly a real problem either — after all, there are a host of different ways you can approach this. Heck, the whole thing could be a very convenient web applet, just a website you press a ‘next card’ button on, using a simple script to randomise the prompt.
The form the game takes informs the way the game plays.
For The Queers is a For The Queen variant that promises a focus on ‘queer relationships,’ which is a really loaded place to start with things in a way that makes me pre-emptively grimace emoji. Queer relationships are massively varied; my marriage to my partner of twenty years is a queer relationship which has never been particularly in any way interesting, but so to is the relationship of one of my friends who has a literal spreadsheet to manage the intersecting commitments of their different alters’ different polycules. Capturing the breadth of those things in a game simulation of this engine runs a risk of failing to catch either end.
After all, I am one of The Queers, and reading this game’s prompts, I found myself struck by how much none of these questions invited interesting answers, or, particularly, were informed by The Queerness. Now, of course I’m not going to be a great eye level character here; after all, in a podcast about Disney movies, I routinely called out how often the narrative of every movie was a terrible relationship and everyone deserved to be guillotined, but I like to think I can suspend my sense of disbelief and personal politics easily enough to engage with the game that exists in terms of its narrative framing. This is about people who are doing something very important generally (helping the Queen on their way to trying to save the kingdom through an alliance) and very important specifically (you are travelling with someone you are in love with and the many other people that they love, and dealing with the boundaries of that).
Which means that the most prominent form of queerness this game forwards is polyamry and being loved by a queen who is ‘free of gender,’ and what that means is an exercise for the reader. The polyamry element as a form of queerness is, you know, fine, I’m not one of the people who thinks polyamry doesn’t count as a queerness, it’s something that heteronormativity wants to attack and disempower, they can come in under the umbrella as long as they want to be. But that’s kind of the extent of queerness in this space, and since we are also talking about a gender-unclarified queen, with literally no other world building information imposed, that’s kind of the limits of what kind of queerness the game and its story mechanics actually include.
In some ways, it feels breathtakingly sweet, that this game feels its vision of queer relationships are the natural outcome of what happens when you play this game, with these rules. It speaks to the idea of a player community where there is no need for anything but the natural outcome of these prompts to be a queer relationship, because queer relationships are that obvious and easy, but also, the queerness is not defined by any kind of norm. It is Queer, because it says it is Queer.
Like, you know, Dungeons & Dragons.
Let me be extremely clear on this game, though: For all that this game has this verbiage out of me about its challenge, about the things I think it mis-steps on mechanically to achieve its ends, and the implications of what it chooses to be about, none of this is to dismiss the game as a game for its own sake. You can get this game for $3 and play it and if you play it with a bunch of people who want to tell stories about messy queers entangled around their royal love, grappling with their feelings and despairs, you will absolutely be able to have a good time!
Check it out on PRESS.exe to see it with images and links!
29 notes
·
View notes
Text
damn daniel ive been thoroughly spoiled by excel 365 bc i have to lookup values to see if they're missing in this sheet n it's a bummer to do manually so i was like ok my good friend xlookup will be handy here but woe be me the xlookup function isnt avail???? girl im going to cry
2 notes
·
View notes
Text
Master Your Data: Microsoft® 365 – Excel Intermediate Level
Why Intermediate Excel Skills Are Crucial for Today's Professionals
Excel is far more than a simple spreadsheet program. At its intermediate level, it transforms into a powerful tool for data manipulation, analysis, and visualization. Acquiring these skills can drastically improve productivity, accuracy, and insights across various roles and industries.
Enhanced Data Management: Move beyond simple data entry to efficiently organize, sort, filter, and clean large datasets, making information readily accessible and reliable.
Powerful Data Analysis: Learn to use functions and tools that allow you to extract meaningful insights from raw data, identify patterns, and support strategic decision-making.
Increased Productivity: Automate repetitive tasks, create dynamic reports, and streamline workflows, saving valuable time and reducing manual errors.
Improved Reporting and Visualization: Present complex data in clear, compelling ways using charts, graphs, and structured reports that are easy for stakeholders to understand.
Career Advancement: Strong Excel skills are highly valued across all sectors, making you a more valuable asset to your organization and enhancing your career prospects.

Key Skills Covered at the Intermediate Excel Level
An intermediate Excel course focuses on equipping users with practical skills to handle more complex data scenarios and perform deeper analysis. Here are some of the essential areas covered:
Advanced Formulae and Functions:
Logical Functions: Master IF, AND, OR, and nested IF statements for complex decision-making within your spreadsheets.
Lookup Functions: Efficiently retrieve data from large tables using VLOOKUP, HLOOKUP, and the more powerful XLOOKUP (in newer M365 versions) to connect related information.
Text Functions: Manipulate text strings, extract specific parts of data, and clean up inconsistent entries using functions like LEFT, RIGHT, MID, LEN, CONCAT, and TRIM.
Date and Time Functions: Work with dates and times for scheduling, tracking, and financial analysis using functions like TODAY, NOW, DATEDIF, and NETWORKDAYS.
Data Management and Organization Techniques:
Sorting and Filtering Data: Apply advanced multi-level sorting and custom filters to quickly find and organize specific information.
Data Validation: Implement rules to ensure data consistency and accuracy, minimizing errors at the point of entry.
Conditional Formatting: Visually highlight important data, trends, or outliers using various conditional formatting rules to make your spreadsheets more insightful.
Working with Tables: Convert data ranges into Excel Tables for easier management, automatic formula propagation, and structured referencing.
Introduction to Data Analysis Tools:
PivotTables: Learn to create and manipulate PivotTables to summarize, analyze, explore, and present large datasets from different perspectives.
Charts and Graphs: Go beyond basic charts. Understand different chart types and when to use them to effectively visualize data and trends.
What-If Analysis (Goal Seek, Data Tables): Explore different scenarios and outcomes to support decision-making, such as finding the input value needed to achieve a specific target.
Spearhead Training, a leading provider in the region, offers comprehensive Microsoft Training Courses In Dubai, including their highly beneficial "Microsoft® 365 – Excel Intermediate Level" program. If you're looking for expert-led Microsoft Excel Training in Dubai that promises not only practical also real-world application.
0 notes
Text

How to Use VLOOKUP and HLOOKUP in Excel with Examples
Introduction Excel is a powerful spreadsheet tool, but it can become overwhelming when dealing with large datasets. If you've ever spent minutes scrolling to find a specific value, you're not alone. Luckily, Excel offers two powerful functions to make data searching easier VLOOKUP and HLOOKUP. These functions are simple, useful, and ideal for beginners looking to work smarter in Excel.
What Is VLOOKUP in Excel?
VLOOKUP, short for Vertical Lookup, is used when your data is organized in columns. It helps you search down the first column of a table to find a matching value and return information from the same row in another column.
For example, if you have a table of student IDs and their corresponding grades, you can use VLOOKUP to find a student's grade just by entering their ID. This function is extremely helpful when working with large sets of records like attendance sheets, mark lists, employee data, or sales information.
What Is HLOOKUP in Excel?
HLOOKUP, or Horizontal Lookup, works similarly to VLOOKUP but searches data organized in rows instead of columns. This function scans across the first row to find a value and then returns the information from a specific row underneath.
Imagine you have the months of the year listed across a row and sales figures below each month. With HLOOKUP, you can quickly find the sales number for any specific month without manually browsing through the file.
When to Use VLOOKUP and HLOOKUP
Use VLOOKUP when your data is listed vertically (top to bottom).
Use HLOOKUP when your data is listed horizontally (left to right).
Both functions serve the same purpose retrieving matching information but the layout of your table decides which one to use.
Benefits of Using VLOOKUP and HLOOKUP
Saves time: No need to scroll through endless rows or columns.
Increases accuracy: Eliminates the chance of human error when finding data manually.
Improves productivity: You can automate data lookup for reports, dashboards, or records.
Useful across fields: From education and sales to finance and admin these functions are valuable everywhere.
Final Thoughts
Learning how to use VLOOKUP and HLOOKUP in Excel can dramatically improve your data-handling skills. These functions are easy to use once you understand the basics, and they can save hours of work every week. Whether you're a student, a working professional, or someone who just wants to become better at Excel, VLOOKUP and HLOOKUP are essential tools worth mastering.
0 notes
Text
Excel Like a Pro: The Ultimate Guide to Microsoft Excel Mastery
If you've ever felt overwhelmed looking at an Excel spreadsheet, you're not alone. Microsoft Excel can look intimidating with all its formulas, charts, tables, and tabs. But here’s the thing — once you master it, Excel becomes one of the most powerful tools you’ll ever use. Whether you're managing personal finances, analyzing data, or building dashboards for work, Excel has you covered.
So, how do you go from being an Excel rookie to someone who uses pivot tables in their sleep?
Simple. By learning from the Microsoft Excel: Ultimate Mastery from Beginner to Pro course — a comprehensive program designed to turn even the most hesitant users into Excel power users.
Let’s break down why this course is worth your time and how it can transform your skills from basic to brilliant.
Why Excel Mastery Matters in 2025 (and Beyond)
Excel is not just a tool. It’s practically a language spoken across all industries — from finance and marketing to healthcare and logistics. Here's what makes it essential:
Universal Application: Almost every job requires some level of data entry, reporting, or analysis.
Efficiency & Productivity: Mastering Excel helps you complete tasks faster and more accurately.
Career Advancement: Proficiency in Excel is a highly sought-after skill that can help you stand out.
Smarter Decision Making: With Excel, you can visualize data, forecast trends, and make data-driven decisions.
So, whether you're job hunting, starting a business, or looking to automate repetitive tasks, mastering Excel is a smart move.
What Makes This Excel Course So Effective?
There are tons of Excel tutorials out there, so why choose this one? The Microsoft Excel: Ultimate Mastery from Beginner to Pro course on Korshub is different. Here’s how:
✅ All-in-One Learning Path
Instead of bouncing between YouTube videos and random blog posts, this course gives you a structured, progressive roadmap. It starts with the basics like formatting cells and quickly moves into advanced territory like macros and data analysis.
✅ Hands-On Learning with Real-Life Examples
You won’t just learn how to use VLOOKUP or SUMIF — you’ll use them in real-world scenarios that simulate actual workplace tasks. That means what you learn is immediately applicable.
✅ Latest Excel 2021 Features Covered
With tools and techniques updated for Microsoft Excel 2021, this course ensures you're learning the most relevant and up-to-date content. Features like dynamic arrays, XLOOKUP, and improved charting functionalities are all part of the package.
✅ Lifetime Access with Future Updates
Once enrolled, you’ll have lifetime access to the course. Whenever there’s a new Excel update, you’ll be the first to know and learn how to use it.
What You’ll Learn — A Peek into the Curriculum
Here’s a quick overview of the skills you'll gain from beginner to pro level:
🟢 Beginner Essentials
Navigating Excel’s interface
Formatting cells and worksheets
Basic formulas and functions (SUM, AVERAGE, COUNT)
Sorting and filtering data
Creating and formatting simple charts
🔵 Intermediate Proficiency
Conditional formatting
Data validation
Pivot tables and Pivot charts
Logical functions like IF, AND, OR
Lookup functions (VLOOKUP, HLOOKUP, XLOOKUP)
🟣 Advanced Excel Techniques
Data visualization dashboards
Advanced charts (combo, waterfall, histogram)
What-If analysis (Goal Seek, Scenario Manager)
Named ranges and data tables
Working with large datasets
🔴 Excel Power Tools
Power Query & Power Pivot
Macros and VBA basics
Automating reports
Connecting Excel to other data sources
Advanced data modeling and forecasting
Real-World Applications: How Excel Helps You Every Day
You might be wondering, "Will I really use all this?" The short answer: YES.
Here’s how Excel shows up in real life:
For Students: Organize study schedules, calculate GPA, track expenses.
For Freelancers: Invoice clients, calculate earnings, manage projects.
For Office Workers: Analyze sales data, create performance dashboards, generate automated reports.
For Small Business Owners: Track inventory, monitor cash flow, create financial projections.
And the best part? Once you’ve taken the Microsoft Excel: Ultimate Mastery from Beginner to Pro course, you’ll be doing all this with ease and speed.
Who Is This Course For?
This course is designed for everyone — regardless of your background or experience. Here's who will benefit most:
Absolute Beginners: No prior Excel knowledge needed.
Intermediate Users: Fill in knowledge gaps and explore new features.
Business Professionals: Improve productivity and data analysis.
Job Seekers: Boost your resume with a high-demand skill.
Entrepreneurs: Manage and grow your business more efficiently.
Key Features That Set This Course Apart
🌟 20+ Hours of Engaging Video Content
Packed with digestible lessons that keep you motivated.
🌟 Downloadable Resources & Workbooks
Practice what you learn with ready-to-use files.
🌟 Quizzes & Real-World Projects
Put your skills to the test with interactive assignments.
🌟 Certificate of Completion
Showcase your achievement and add it to your LinkedIn profile.
What Students Are Saying
"I thought Excel was only for accountants. After taking this course, I use it for everything — budgeting, planning, even my side hustle. Totally worth it!" — Priya M., Freelancer
"I landed a job partly because of the Excel dashboard I built as part of this course. Hiring managers were impressed!" — Jason T., Data Analyst
"This course is like having a mentor walk you through Excel step-by-step. I finally understand formulas, charts, and even macros!" — Alisha R., College Student
How to Get Started
Ready to transform how you work with data?
It only takes a few minutes to enroll in the Microsoft Excel: Ultimate Mastery from Beginner to Pro course. From there, you can start learning at your own pace — pause, rewind, practice — and gradually build mastery.
Excel Tips to Keep in Your Back Pocket
To give you a head start, here are a few tips that’ll instantly improve your Excel game:
CTRL + Arrow Keys: Jump quickly across large datasets.
Use Named Ranges: They make formulas easier to read and manage.
Combine Functions: Nest IF, AND, OR for powerful logical analysis.
Flash Fill: Excel predicts and completes repetitive entries for you.
Use Tables for Dynamic Ranges: Automatically updates data references when new rows are added.
Of course, all these tricks (and hundreds more) are covered inside the course!
Final Thoughts: Excel Isn’t Optional Anymore
Whether you're building your career, managing your own business, or simply trying to stay organized, Excel is one skill that pays for itself many times over. And you don’t need to spend months trying to figure it all out.
With the Microsoft Excel: Ultimate Mastery from Beginner to Pro course, you’ll go from confused to confident — unlocking the full power of spreadsheets, dashboards, and data automation.
0 notes
Text
Beyond Basics: Advanced Excel for Careers

When you think of Microsoft Excel, you might picture simple spreadsheets for organizing data or basic calculations. Yet, in almost all industries, Excel is far more than a mere table. It is data analysis, reporting, and automation tool. Going beyond the basics, becoming an advanced Excel pro leads to a career fast track, converting an ordinary data user to the master.
Companies across industries are drowning in data in today's data-driven world. They require workers who can handle data, extract insights, display information well, and automate processes. Advanced Excel skills thus make you an awesome asset in the finance firms, marketing agencies, HRs, and operations departments.
Why Advanced Excel Skills are Resisted in Career Growth
Many would consider basic Excel skills to be the only requirement of a job; however, the reality is that further potentials of Excel are increasingly sought after by employers. Here is why getting the hang of advanced Excel is crucial:
Data Analysis Prowess: You are able to analyze big sets of data instantaneously; identify trends; and come up with useful business decisions.
Report Creation: Develop fully interactive reports and dashboards that provide a visual representation of complex information to stakeholders.
Automation & Efficiency: Consider the fascination of automating repetitive tasks anymore and save human beings hours of work while few errors can occur due to manual operations.
Problem-Solving: Advanced functions can be used to model complex business problems, from financial decision-making to resource allocation.
Employability: Advanced Excel skills appear on almost every job listing and are sometimes considered the top requirement for many.
Key Advanced Excel Skills to Master
If you want to truly move beyond the basics, then consider sharpening your skills around these powerful features:
Pivot tables and Pivot charts: Learn to summarize, analyze, explore, and present large amounts of data interactively and flexibly. These are best used for quick reporting and spotting trends.
Advanced functions (VLOOKUP, HLOOKUP, INDEX, MATCH, IF, SUMIFS, COUNTIFS): Beyond simple sums, these allow complex lookups and conditional aggregations or tests over multiple criteria. INDEX and MATCH are a particularly powerful combo.
Data Validation: Do data cleansing by defining rules that restrict what can be entered in a cell, thus preventing errors and promoting inconsistency.
Conditional Formatting: Highlight data based on given criteria; this will help trends, exceptions, and anomalies stand out at a glance.
What-If Analysis (Goal Seek, Scenario Manager, Data Tables): Play with perhaps various scenarios and make predictions for expected results once variables have been changed; this is very important for planning and decision-making.
Macros & VBA (Visual Basic for Applications): Record or write custom code, relying heavily on automation to eliminate tedious manual tasks, create custom functions, and develop very powerful user interfaces within the Excel environment itself-this is an efficiency game-changer.
Power Query & Power Pivot: These built-in tools allow for advanced cleansing and transformations and creation of sophisticated data models, working with a much bigger volume of data compared to a traditional Excel file.
Career Roles Where Advanced Excel Shines
Having those skills opens countless career openings:
Financial Analyst: This is important for financial modeling, budgeting, forecasting, and investment analysis.
Business Analyst: For market research, performance measurement, and strategic planning.
Data Analyst: For cleaning, analyzing, and making data easier to understand from various sources.
Project Manager: For progress tracking, resource management, and detailed scheduling.
Marketing Analyst: Measuring campaign performances, analyzing customer data, and trends in sales.
Operations Manager: For workflow optimization, inventory handling, and logistics conversation.
Your Road to Advanced Excel Mastery
If you aspire to level up, taking an Advanced Excel course or a Data Analytics course in Ahmedabad is strongly recommended. These programs dive deep into advanced functions, tools, and best practices, typically going further with actual project executions to churn out a mature portfolio. For a student seeding for their first job or a working professional looking to rank higher, investing in advanced Excel skills will pay dividends through their entire career. Become the Excel expert your workplace needs. At that stage, your livelihood will be fostered by your flourish!
Contact us
Call now on +91 9825618292
Visit Our Website: http://tccicomputercoaching.com/
#AdvancedExcel#ExcelSkills#CareerGoals#DataAnalysis#BusinessTools#Productivity#ExcelTips#OfficeSkills#TCCI
0 notes
Text
Excel for Accountants & Payroll: Advanced 2025 Guide to Excel Courses, Formulas & Payroll Functions

Why Excel Still Reigns Supreme in Accounting & Payroll in 2025
Despite the rise of automation tools and cloud-based finance platforms, Excel for Accountants remains the backbone of financial operations. Whether you’re reconciling ledgers, managing payroll, or creating dynamic reports, Excel provides the flexibility, control, and power needed by finance professionals.
For those in Accountants & Payroll roles, Excel continues to be a vital tool in 2025. From creating custom templates to automating salary calculations, Excel allows for deep customization without the cost of high-end software. This guide will show you how to use Excel at an advanced level—whether you're learning from an Excel course, handling payroll in Excel, or mastering Excel formulas and functions.
The Role of Excel in Modern Accounting and Payroll
Why Accountants Still Trust Excel
Accountants need a tool that can adapt to their workflow. Excel is ideal for:
Customizing reports
Building financial models
Tracking expenses and budgets
Analyzing monthly or yearly performance
It also integrates well with many accounting systems via CSV or Excel imports, giving you the best of both worlds—automation plus manual oversight.
How Payroll in Excel Still Makes Sense
Payroll in Excel is a practical solution for small businesses, startups, and even mid-sized companies that want full control. With the right setup, you can manage:
Employee salary data
Tax deductions like TDS, PF, and ESI
Leave and attendance records
Net pay and payslip generation
The best part? It’s all customizable, and once you build a payroll model, you can reuse it month after month.
Must-Know Excel Formulas and Functions for Accountants & Payroll Professionals
To level up your spreadsheet game, focus on these Excel formulas and functions commonly used by accounting teams:
VLOOKUP / XLOOKUP: Pull employee info or match salary brackets
IF, AND, OR: Apply conditional logic in tax or bonus calculations
SUMIF, SUMIFS: Aggregate values based on departments or dates
TEXT, DATE: Format reports and payroll periods neatly
ROUND, CEILING: Ensure precision in salary and tax figures
Pivot Tables: Analyze total earnings, tax deductions, or benefits by category
Data Validation: Prevent incorrect data entry
By mastering these, you can minimize errors and speed up payroll processing.
Automating Payroll Tasks Using Excel
Why spend hours every month repeating the same steps? Excel macros let you automate tasks such as:
Updating attendance
Generating monthly payslips
Summarizing payroll reports for HR or Finance teams
If you’re already familiar with formulas, learning to record macros is the next logical step. It’s a must-learn for any serious Excel for Accountants workflow.
How to Create a Complete Payroll System in Excel
If you're ready to build a complete payroll setup in Excel, here’s a simple structure to follow:
Employee Master Sheet – Stores employee names, IDs, roles, and salary slabs.
Attendance Sheet – Tracks present days, leaves, overtime hours.
Salary Sheet – Auto-calculates gross and net pay using formulas.
Deductions Sheet – Calculates TDS, PF, ESI based on government rules.
Payslip Generator – Dynamic, printable payslips using lookup and reference formulas.
Include dropdowns for designations, departments, and tax brackets to make the system dynamic and user-friendly.
Best Excel Courses for Accountants & Payroll in 2025
If you're planning to sharpen your skills, enrolling in an Excel course is a smart move. In 2025, the best Excel training programs for accountants focus on:
Payroll automation
Financial modeling
Tax compliance in spreadsheets
Dashboards and reporting
Top platforms to explore:
LinkedIn Learning – Excel for Financial Professionals
Coursera – Payroll & Excel Integration
Udemy – Advanced Excel for Accountants & Payroll
Microsoft Learn – Excel Business Training Modules
Courses with real projects and certification can also help you stand out in the job market.
Common Excel Errors in Payroll and How to Avoid Them
Even pros make mistakes—here are some common ones and how to fix them:
#N/A in VLOOKUP: Usually a mismatch in lookup values
#VALUE!: Often due to text being used in a numeric formula
Wrong date formats: Use TEXT function to standardize
Copy-paste errors: Use named ranges or structured tables to reduce mistakes
Building error-free systems is part of becoming a trusted Accountants & Payroll expert.
Keeping Payroll Data Secure in Excel
Payroll involves sensitive data like salaries, bank accounts, and tax IDs. Here's how to keep your Excel sheets safe:
Use password protection for files and sheets
Lock formulas to prevent accidental edits
Limit access through OneDrive or SharePoint
Regularly back up your payroll files
With these steps, your payroll in Excel will remain secure and compliant.
Creating Dashboards for Payroll Reports in Excel
Turn your payroll data into powerful visual summaries using:
Bar charts for department-wise salary expenses
Line charts to show salary trends over time
Pivot tables with slicers for interactive filtering
Dashboards improve communication with leadership and make your work more impactful.
Excel or Payroll Software – Do You Need Both?
Many companies use both Excel and payroll software. Why?
Pros of Excel:
Total customization
Low cost
Full transparency
Cons:
Manual data entry can be time-consuming
No automatic compliance updates
You can bridge the gap by exporting reports from payroll tools into Excel for deeper analysis. This hybrid approach is very effective.
Final Thoughts: Excel for Accountants & Payroll is Here to Stay
Mastering Excel for Accountants is still one of the smartest investments you can make in 2025. With new functions, better performance, and growing integration with cloud tools, Excel is evolving—but its core strengths remain the same.
Whether you're learning via an Excel course, processing payroll in Excel, or creating custom formulas, the key is to keep practicing and improving. With the right knowledge of Excel formulas and functions, you'll save time, avoid errors, and bring more value to your team.
Let Excel be your financial command center—flexible, efficient, and fully in your control.
0 notes
Text
What You’ll Learn in a Data Analyst Course in Noida: A Complete Syllabus Breakdown

If you are thinking about starting a career in data analytics, you’re making a great decision. Companies today use data to make better decisions, improve services, and grow their businesses. That’s why the demand for data analysts is growing quickly. But to become a successful data analyst, you need the right training.
In this article, we will give you a complete breakdown of what you’ll learn in a Data Analyst Course in Noida, especially if you choose to study at Uncodemy, one of the top training institutes in India.
Let’s dive in and explore everything step-by-step.
Why Choose a Data Analyst Course in Noida?
Noida has become a tech hub in India, with many IT companies, startups, and MNCs. As a result, it offers great job opportunities for data analysts. Whether you are a fresher or a working professional looking to switch careers, Noida is the right place to start your journey.
Uncodemy, located in Noida, provides industry-level training that helps you learn not just theory but also practical skills. Their course is designed by experts and is updated regularly to match real-world demands.
Overview of Uncodemy’s Data Analyst Course
The Data Analyst course at Uncodemy is beginner-friendly. You don’t need to be a coder or tech expert to start. The course starts from the basics and goes step-by-step to advanced topics. It includes live projects, assignments, mock interviews, and job placement support.
Here’s a detailed syllabus breakdown to help you understand what you will learn.
1. Introduction to Data Analytics
In this first module, you will learn:
What is data analytics?
Why is it important?
Different types of analytics (Descriptive, Diagnostic, Predictive, Prescriptive)
Real-world applications of data analytics
Role of a data analyst in a company
This module sets the foundation and gives you a clear idea of what the field is about.
2. Excel for Data Analysis
Microsoft Excel is one of the most used tools for data analysis. In this module, you’ll learn:
Basics of Excel (formulas, formatting, functions)
Data cleaning and preparation
Creating charts and graphs
Using pivot tables and pivot charts
Lookup functions (VLOOKUP, HLOOKUP, INDEX, MATCH)
Conditional formatting
Data validation
After this module, you will be able to handle small and medium data sets easily using Excel.
3. Statistics and Probability Basics
Statistics is the heart of data analysis. At Uncodemy, you’ll learn:
What is statistics?
Mean, median, mode
Standard deviation and variance
Probability theory
Distribution types (normal, binomial, Poisson)
Correlation and regression
Hypothesis testing
You will learn how to understand data patterns and make conclusions from data.
4. SQL for Data Analytics
SQL (Structured Query Language) is used to work with databases. You’ll learn:
What is a database?
Introduction to SQL
Writing basic SQL queries
Filtering and sorting data
Joins (INNER, LEFT, RIGHT, FULL)
Group By and aggregate functions
Subqueries and nested queries
Creating and updating tables
With these skills, you will be able to extract and analyze data from large databases.
5. Data Visualization with Power BI and Tableau
Data visualization is all about making data easy to understand using charts and dashboards. You’ll learn:
Power BI:
What is Power BI?
Connecting Power BI to Excel or SQL
Creating dashboards and reports
Using DAX functions
Sharing reports
Tableau:
Basics of Tableau interface
Connecting to data sources
Creating interactive dashboards
Filters, parameters, and calculated fields
Both tools are in high demand, and Uncodemy covers them in depth.
6. Python for Data Analysis
Python is a powerful programming language used in data analytics. In this module, you’ll learn:
Installing Python and using Jupyter Notebook
Python basics (variables, loops, functions, conditionals)
Working with data using Pandas
Data cleaning and transformation
Visualizing data using Matplotlib and Seaborn
Introduction to NumPy for numerical operations
Uncodemy makes coding easy to understand, even for beginners.
7. Exploratory Data Analysis (EDA)
Exploratory Data Analysis helps you find patterns, trends, and outliers in data. You’ll learn:
What is EDA?
Using Pandas and Seaborn for EDA
Handling missing and duplicate data
Outlier detection
Data transformation techniques
Feature engineering
This step is very important before building any model.
8. Introduction to Machine Learning (Optional but Included)
Even though it’s not required for every data analyst, Uncodemy gives you an introduction to machine learning:
What is machine learning?
Types of machine learning (Supervised, Unsupervised)
Algorithms like Linear Regression, K-Means Clustering
Using Scikit-learn for simple models
Evaluating model performance
This module helps you understand how data analysts work with data scientists.
9. Projects and Assignments
Real-world practice is key to becoming job-ready. Uncodemy provides:
Mini projects after each module
A final capstone project using real data
Assignments with detailed feedback
Projects based on industries like banking, e-commerce, healthcare, and retail
Working on projects helps you build confidence and create a strong portfolio.
10. Soft Skills and Resume Building
Along with technical skills, soft skills are also important. Uncodemy helps you with:
Communication skills
Resume writing
How to answer interview questions
LinkedIn profile optimization
Group discussions and presentation practice
These sessions prepare you to face real job interviews confidently.
11. Mock Interviews and Job Placement Assistance
Once you complete the course, Uncodemy offers:
Multiple mock interviews
Feedback from industry experts
Job referrals and placement support
Internship opportunities
Interview scheduling with top companies
Many Uncodemy students have landed jobs in top IT firms, MNCs, and startups.
Tools You’ll Learn in the Uncodemy Course
Throughout the course, you will gain hands-on experience in tools like:
Microsoft Excel
Power BI
Tableau
Python
Pandas, NumPy, Seaborn
SQL (MySQL, PostgreSQL)
Jupyter Notebook
Google Sheets
Scikit-learn (Basic ML)
All these tools are in high demand in the job market.
Who Can Join This Course?
The best part about the Data Analyst Course at Uncodemy is that anyone can join:
Students (B.Tech, B.Sc, B.Com, BBA, etc.)
Fresh graduates
Working professionals looking to switch careers
Business owners who want to understand data
Freelancers
You don’t need any prior experience in coding or data.
Course Duration and Flexibility
Course duration: 3 to 5 months
Modes: Online and offline
Class timings: Weekdays or weekends (flexible batches)
Support: 24/7 doubt support and live mentoring
Whether you’re a student or a working professional, Uncodemy provides flexible learning options.
Certifications You’ll Get
After completing the course, you will receive:
Data Analyst Course Completion Certificate
SQL Certificate
Python for Data Analysis Certificate
Power BI & Tableau Certification
Internship Letter (if applicable)
These certificates add great value to your resume and LinkedIn profile.
Final Thoughts
The job market for data analysts is booming, and now is the perfect time to start learning. If you’re in or near Noida, choosing the Data Analyst Course at Uncodemy can be your best career move.
You’ll learn everything from basics to advanced skills, work on live projects, and get support with job placement. The trainers are experienced, the syllabus is job-focused, and the learning environment is friendly and supportive.
Whether you’re just starting or planning a career switch, Uncodemy has the tools, training, and team to help you succeed.
Ready to start your journey as a data analyst? Join Uncodemy’s Data analyst course in Noida and unlock your future today!
0 notes
Text
Mastering Excel: Unlocking the Power of Advanced Formulas
In the world of data analysis and management, Microsoft Excel has long been a trusted companion for professionals across various industries. While the software’s basic functionality is well-known, many users often overlook the true power that lies within its advanced formulas. In this blog post, we’ll dive deep into the realm of Excel’s advanced formulas, exploring how they can streamline your workflow, enhance your data analysis, and unlock new levels of productivity.
Understanding the Basics of Excel Formulas At the core of Excel’s functionality are its formulas, which allow users to perform a wide range of calculations and manipulations on their data. The standard formulas, such as SUM, AVERAGE, and COUNT, are well-known and widely used. However, Excel’s advanced formulas take things to the next level, providing more sophisticated and customizable solutions to complex problems.
The Power of Excel’s Advanced Formulas Excel’s advanced formulas are like a toolbox filled with specialized tools, each designed to tackle specific data-related challenges. These formulas offer a level of complexity and flexibility that can significantly enhance your analytical capabilities. Let’s explore some of the most powerful advanced formulas and how they can benefit your work:
VLOOKUP: This formula is a game-changer when it comes to cross-referencing data across different tables or worksheets. By using the VLOOKUP function, you can quickly find and retrieve corresponding values, making it a valuable tool for data consolidation and reporting.
SUMIFS and COUNTIFS: These advanced formulas allow you to perform complex conditional summations and counts, respectively. They enable you to aggregate data based on multiple criteria, providing a more targeted and insightful analysis.
INDEX and MATCH: The combination of these two formulas is a powerful way to look up and retrieve data from a range of cells, even if the data is not organized in a traditional table format. This is particularly useful when dealing with dynamic or non-standardized data sources.
PIVOT TABLES: While not a formula per se, pivot tables are an advanced feature in Excel that allows you to quickly analyze and summarize large datasets. By organizing and aggregating data in a flexible manner, pivot tables enable you to uncover insights and trends that may not be readily apparent in the raw data.
ARRAY FORMULAS: Array formulas are a unique and powerful type of formula that can perform operations on entire arrays of data, rather than individual cells. They are particularly useful for complex calculations, data manipulation, and statistical analysis.
OFFSET and INDIRECT: These advanced formulas provide dynamic and flexible ways to reference and manipulate cell ranges, making them valuable for tasks such as creating interactive dashboards, automating reports, and building complex financial models.
LOOKUP and CHOOSE: The LOOKUP formula allows you to search for a value in a range and return a corresponding value, while the CHOOSE formula lets you select a value from a list based on an index number. These formulas can be particularly useful for data lookup and decision-making processes.
Mastering Advanced Formulas: Practical Applications Now that you’ve been introduced to some of the most powerful advanced formulas in Excel, let’s explore how you can apply them to real-world scenarios:
Financial Analysis: Advanced formulas can be invaluable in financial modeling and forecasting. For example, you can use SUMIFS to calculate total revenue or expenses based on multiple criteria, such as product category, region, or time period.
Sales Reporting: Combine VLOOKUP and SUMIFS to create comprehensive sales reports that consolidate data from multiple sources, allowing you to analyze performance, identify trends, and make informed decisions.
Inventory Management: Use advanced formulas to track and manage your inventory, automating calculations for reorder points, stock levels, and more. This can help you optimize your supply chain and minimize the risk of stockouts or overstocking.
HR and Payroll: Advanced formulas can streamline HR and payroll processes, such as calculating overtime pay, deductions, and employee benefits. SUMIFS and COUNTIFS can be particularly useful in these scenarios.
Data Validation: Leverage advanced formulas to implement data validation rules, ensuring the integrity and accuracy of your data. This can include checks for duplicate entries, data range validation, and more.
Project Management: Utilize advanced formulas to track project timelines, budgets, and resource allocation. Formulas like DATEDIF and NETWORKDAYS can help you monitor progress and identify potential bottlenecks.
Marketing Analytics: Advanced formulas can be used to analyze marketing data, such as campaign performance, lead generation, and customer retention. Formulas like CONCATENATE and TRIM can help you clean and prepare data for analysis.
Mastering the Art of Advanced Formulas Becoming proficient in Excel’s advanced formulas requires a combination of practice, patience, and a willingness to explore. Start by familiarizing yourself with the basic syntax and structure of each formula, then experiment with different use cases to understand their full potential. Many online resources, such as tutorial videos and Excel forums, can be invaluable in your learning journey.
As you become more comfortable with advanced formulas, consider creating your own custom formulas or combining multiple functions to tackle complex problems. Embrace the creative aspect of Excel and challenge yourself to find innovative solutions that streamline your workflow and enhance your data analysis capabilities.
Conclusion: Excel’s advanced formulas are the keys to unlocking the true power of the software. By mastering these specialized tools, you can transform your data analysis, reporting, and decision-making processes, ultimately leading to increased productivity, better-informed decisions, and a more efficient work environment. Take the time to explore and experiment with Excel’s advanced formulas, and you’ll soon discover a world of new possibilities at your fingertips.
0 notes
Text
Inventory Management System Development

Inventory management is essential for businesses that deal with physical goods. An efficient inventory system helps track stock levels, manage orders, reduce waste, and improve overall operational efficiency. In this blog post, we’ll explore the key components and programming approach for building an Inventory Management System (IMS).
Core Features of an Inventory Management System
Product Catalog: Add, edit, delete, and categorize products.
Stock Tracking: Monitor stock levels in real-time.
Purchase & Sales Records: Track incoming and outgoing items.
Supplier & Customer Management: Manage business relationships.
Reports & Analytics: Generate sales, inventory, and purchase reports.
Alerts: Notify when stock is low or out of stock.
Tech Stack Suggestions
Frontend: React.js, Vue.js, or Angular
Backend: Node.js, Django, Laravel, or Spring Boot
Database: MySQL, PostgreSQL, or MongoDB
Authentication: JWT, OAuth, or Firebase Auth
Deployment: Docker + AWS/GCP/Heroku
Basic Database Structure
Products Table: - product_id (PK) - name - category - quantity - price - supplier_id (FK) Suppliers Table: - supplier_id (PK) - name - contact_info Sales Table: - sale_id (PK) - product_id (FK) - quantity_sold - date Purchases Table: - purchase_id (PK) - product_id (FK) - quantity_purchased - date
Sample API Endpoints (Node.js Example)
GET /products – List all products
POST /products – Add a new product
PUT /products/:id – Update product details
DELETE /products/:id – Remove a product
GET /inventory/report – Generate inventory report
Frontend Functionality Tips
Use modals for adding/editing items
Display stock levels using color indicators (e.g., red for low stock)
Enable filtering/searching by product category or supplier
Use charts for visual stock and sales analytics
Bonus Features to Consider
Barcode Scanning: Integrate barcode scanning for quick item lookup
Role-Based Access: Allow different permissions for admin, staff, and viewer
Mobile Access: Build a mobile-responsive UI or companion app
Data Export: Export inventory reports to Excel/PDF
Conclusion
Building an inventory management system can significantly benefit any business that handles products or stock. By designing a system with clean UI, efficient backend logic, and accurate data handling, you can help companies stay organized and save time. Start simple, scale gradually, and always prioritize usability and security in your system design.
0 notes
Text
Unlocking the Power of Skip Smasher: A Look at the Screen Smasher Interface
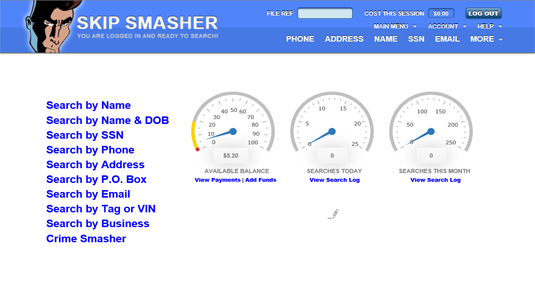
In the world of investigative research and skip tracing, access to real-time, accurate data is crucial. Professionals rely on reliable data tools to locate individuals, verify records, and gather critical information. Skip Smasher has established itself as a trusted platform for skip tracers, private investigators, and professionals who need fast and accurate search results. One of the most impressive features of Skip Smasher is its Screen Smasher tool, which provides a seamless user experience. Whether you're conducting a Mega People Search, Open People Search, or workplace data search, Skip Smasher delivers real-time results with unparalleled accuracy.
Exploring the Skip Smasher Interface
The Screen Smasher interface is designed to be user-friendly while maintaining robust functionality. Professionals in skip tracing and investigations need a streamlined platform that allows them to perform searches quickly and efficiently.
The screenshots available on the Skip Smasher website offer a glimpse into the well-structured main menu and search tools. These visuals provide an overview of how users can navigate the platform, making it easier to understand before signing up.
Skip Smasher connects directly to the Big Data cloud, ensuring that users get fresher and more cost-effective data compared to traditional data services. With its advanced capabilities, professionals can conduct searches such as:
Mega People Search – Locate individuals through extensive address history and contact details.
Open People Search – Perform searches using publicly available data sources.
Workplace Data Search – Gain insights into employment details and workplace connections.
Mega Public Records Search – Access large volumes of public records with ease.
Directory Assistance Plus – Retrieve phone numbers and associated details efficiently.
Why Skip Smasher Stands Out
Skip Smasher is built for efficiency, providing investigators with an intuitive interface, affordable pricing, and real-time results. Unlike many outdated search platforms, Skip Smasher gives users direct access to the most current data, eliminating delays often associated with traditional data providers.
The pricing model is another advantage. With a monthly access fee of just $11.95, plus individual search costs, it remains an affordable option for professionals who require regular data access. Searches like Mega People Search cost only $0.90 per search, while Phone Subscriber ID (landline only) costs just $0.25 per lookup. This makes Skip Smasher a cost-effective alternative for those who need comprehensive data without breaking the bank.
Is Skip Smasher Right for You?
If you're an investigator, skip tracer or professional researcher, Skip Smasher is an excellent tool to enhance your workflow. However, it's important to note that Skip Smasher is not a consumer reporting agency and does not provide consumer reports under the Fair Credit Reporting Act (FCRA). This means the data retrieved should not be used for credit, employment, insurance, or housing decisions.
Final Thoughts: Take Advantage of Skip Smasher Today
With a powerful Screen Smasher interface, affordable pricing, and real-time data access, Skip Smasher is a top-tier platform for professionals needing accurate investigative data. Whether you're looking for public records, people searches, or workplace details, Skip Smasher provides a simple yet effective solution. Don’t wait to enhance your investigative searches today! Subscribe to Skip Smasher and unlock better data now!
0 notes
Text
Canada Postal Code Lookup in Excel: A Step-by-Step Guide
Introduction Need to perform a Canada postal code lookup in Excel? Whether managing customer addresses or analyzing location data, Excel makes it easy to organize postal codes.

1. Using Online Postal Code Lookup Tools
Canada Post’s website provides a lookup feature.
Copy and paste postal codes into Excel.
2. Automating Postal Code Lookup in Excel
Use the VLOOKUP function to match postal codes with locations.
Integrate API calls for real-time postal code retrieval.
3. Why Use Excel for Postal Code Lookup?
Bulk processing: Handle large datasets.
Data verification: Ensure accuracy in mailing lists.
Conclusion
With the right tools, Canada postal code lookup in Excel is quick and efficient. Use built-in functions or APIs for automation.
youtube
SITES WE SUPPORT
Drop off Box Code – Blogpost
0 notes
Text
Top Benefits of Learning Advanced Excel

In today’s competitive job market, technical skills like Advanced Excel can make a huge difference in your career. Whether you are a student, working professional, or entrepreneur, learning advanced Excel is a smart investment that can boost productivity, improve data handling, and open doors to new job opportunities.
The Institute Tririd Computer Coaching Institute Ahmedabad handles all the functional training courses for Excel from the beginners to experts. The course covers Pivot Tables, VLOOKUP, HLOOKUP, Charts, Conditional Formatting, Advanced Formulas, and Macros. Most real-life scenarios where these features are applied are financial analysis, inventory management, HR reporting, and data visualization.
Advanced Excel Learning Benefits:
Save Management Data: Understand how to handle large collections of data using the filtering, sorting, and formatting tools.
Decision Making With No Better Alternative: Analyze data with the help of functions like IF, SUMIFS, and LOOKUP to make data-driven decisions.
Automation: Save time using macros to automate repetitive tasks.
Increase Productivity: More speed, accuracy, and efficiency using formulas and shortcut keys.
Career Upliftment: Excel is a common requirement almost everywhere—finance, marketing, HR, and so on. Hence, these people are more preferred over other candidates by the employers.
TCCI is providing focused coaching, practical training, and flexibility of timings to each student so that each can learn according to their own pace. Whether you're learning for the job or the future, we make Excel simple and powerful.
Location: Bopal & Iskon-Ambli Ahmedabad, Gujarat
Call now on +91 9825618292
Visit Our Website: http://tccicomputercoaching.com/
#TCCI - MS Excel Training in Bopal - Ahmedabad#TCCI - Tririd Computer Coaching Institute#AdvancedExcel#ExcelTraining#LearnExcel#TCCI#DataSkills
0 notes
Text
How to Get Data from Another Sheet in Excel Easily
Introduction Microsoft Excel is a powerful tool for managing and analyzing data. One essential skill is extracting data from one sheet to another, which helps with consolidation, calculations, and referencing. This guide covers various methods to accomplish this efficiently.
Understanding Excel's Structure
Workbook: The primary Excel file containing one or more sheets.
Worksheet/Sheet: Tabs within a workbook for organizing data.
Cell: The smallest unit identified by a row and column (e.g., A1, B2).
Accurate referencing is crucial for seamless data retrieval across sheets.
Fundamentals of Referencing in Excel Referencing allows linking data across worksheets, workbooks, or external sources. References can be:
Absolute: Fixed cell reference (e.g., $A$1).
Relative: Adjusts based on position.
For another sheet: =Sheet2!A1 For another workbook: ='C:\Users\Username\Documents[Workbook2.xlsx]Sheet2'!A1
Method 1: Using Cell References
Select the destination cell.
Type = and navigate to the source sheet.
Click the desired cell; Excel generates a reference.
Press Enter to retrieve the data.
This method is best for simple references without calculations.
Method 2: Using Excel Functions
VLOOKUP: Searches for a value in a column and retrieves corresponding data.
INDEX & MATCH: A flexible alternative for complex lookups.
These functions help pull data dynamically from another sheet based on conditions.
Method 3: Consolidating Data with PivotTables
Select data ranges across sheets.
Insert a PivotTable (Insert > PivotTable).
Define fields (rows, columns, values).
View and analyze the summarized data.
PivotTables are ideal for summarizing and consolidating large datasets.
Method 4: Utilizing Power Query
Navigate to Data > Get Data.
Select a source (another workbook, CSV, database).
Transform data (filter, merge, clean).
Load the transformed data back into Excel.
Power Query is excellent for advanced data manipulation and automation.
Linking Data Across Spreadsheets To link data from another workbook: ='[WorkbookName]SheetName'!CellReference Alternatively, use Data > Link to connect without entering formulas manually.
Best Practices for Data Retrieval
Use named ranges for clarity.
Use relative references where applicable.
Regularly check formulas for errors.
Use external references for data from other workbooks.
Troubleshooting Common Issues
#REF! Error: Ensure references are valid and sheets exist.
Circular References: Avoid formulas referring back to themselves.
Incorrect Data: Verify source data and update links.
Conclusion Retrieving data from another sheet enhances efficiency in Excel. Whether using cell references, functions, PivotTables, or Power Query, mastering these techniques streamlines data management. Applying best practices ensures accuracy and reliability, helping you make informed, data-driven decisions.
For more details, visit our blog: Get Data from Another Sheet in Excel.
0 notes
Text
Oracle Fusion Technical & OIC Online: From Fundamentals to Advanced Strategies
Oracle Fusion Applications and Oracle Integration Cloud (OIC) have become essential for organizations looking to streamline their business processes and optimize enterprise applications. Our Oracle Fusion Technical + OIC Online Training is designed to equip professionals with in-depth knowledge of technical aspects such as BIP Reports, OTBI, FBDI, Web Services, REST APIs, and Oracle Integration Cloud (OIC) for seamless integrations. This hands-on course provides real-world scenarios, expert guidance, and practical exercises to help learners excel in their careers.
Why Choose Our Training?
Comprehensive Curriculum: Covers both Oracle Fusion Technical and OIC with hands-on exercises.
Real-Time Scenarios: Learn with practical examples and case studies.
Expert Instructors: Get trained by industry professionals with years of real-world experience.
Hands-On Practice: Gain access to a fully functional Oracle Fusion instance for hands-on experience.
Career-Oriented Approach: Enhance your job prospects with industry-relevant skills.
Flexible Learning: Access course materials and recorded sessions anytime.
Who Should Enroll?
This training is ideal for:
Oracle Technical Consultants looking to enhance their skills in Fusion applications.
Developers & IT Professionals interested in mastering OIC integrations.
ERP Consultants & Administrators seeking in-depth knowledge of Oracle Fusion Technical modules.
Beginners who wish to start a career in Oracle Fusion Technical and OIC.
Course Curriculum
Module 1: Introduction to Oracle Fusion Technical
Overview of Oracle Fusion Applications
Understanding the Fusion Cloud Architecture
Key Technical Components of Oracle Fusion
Navigation and User Interface Overview
Module 2: BI Publisher (BIP) Reports Development
Introduction to BI Publisher (BIP)
Creating Data Models and Reports
Formatting Reports with RTF, Excel, and eText Templates
Scheduling and Bursting BI Reports
Security and Access Control in BIP
Module 3: OTBI (Oracle Transactional Business Intelligence)
Understanding OTBI and its Importance
Creating and Customizing OTBI Reports
Using Subject Areas for Report Development
Implementing Filters, Views, and Dashboards
Module 4: File-Based Data Import (FBDI) & ADFDI
Understanding Data Migration in Oracle Fusion
File-Based Data Import (FBDI) Process Overview
Working with ADFDI for Data Uploads
Troubleshooting and Error Handling in FBDI
Module 5: Web Services and API Integrations
Introduction to Web Services in Oracle Fusion
SOAP and REST API Overview
Creating and Testing Web Services
Consuming Oracle Fusion APIs for Integrations
Authentication and Security Best Practices
Module 6: Oracle Integration Cloud (OIC) Fundamentals
Overview of Oracle Integration Cloud (OIC)
Understanding Integration Architecture
Components of OIC: Adapters, Connections, and Agents
OIC Monitoring and Error Handling
Module 7: Building Integrations with OIC
Designing and Developing OIC Integrations
Working with Pre-Built Adapters
Configuring REST and SOAP Adapters
Real-Time and Scheduled Integrations
Hands-on Exercise: Creating an End-to-End OIC Integration
Module 8: Advanced OIC Concepts
Implementing Complex Business Logic
Working with Lookup Tables and Mappings
Using Business Process Automation (BPA) in OIC
Hands-on Use Cases for Real-Time Integration
Module 9: Security and Performance Optimization
Security in Oracle Fusion and OIC
Managing Roles and Access Control
Performance Tuning for OIC Integrations
Best Practices for Efficient Data Handling
Module 10: Real-Time Use Cases and Hands-on Projects
Real-World Business Scenarios and Case Studies
Implementing an E2E Business Integration Process
Practical Assignment and Capstone Project
Resume Building and Interview Preparation
Hands-On Exercises & Real-World Projects
Our course provides hands-on exercises, practical assignments, and real-world case studies to reinforce learning. Learners will work on industry-based projects, such as:
Automating Data Imports using FBDI & ADFDI
Building Custom BIP & OTBI Reports
Creating OIC Integrations for Real-Time Business Needs
Developing API-Based Connections for ERP Integration
Benefits of the Training
Industry-Relevant Expertise: Master Oracle Fusion Technical and OIC with real-time projects.
Hands-On Learning: Gain practical experience in integration, data migration, and reporting.
Job-Oriented Training: Prepare for high-demand Oracle Fusion and OIC roles.
Lifetime Access to Learning Resources: Access recorded sessions and course materials anytime.
Certification Assistance: Get guidance for Oracle Fusion and OIC certification exams.
Resume and Interview Support: Receive job interview preparation and resume-building tips.
Training Delivery Mode
Our training is delivered online with:
Live Instructor-Led Sessions
Recorded Video Access
24/7 Learning Portal for Revisions
Q&A Sessions for Doubt Clarification
Practical Assignments & Mock Interviews
Why Learn Oracle Fusion Technical + OIC?
Oracle Fusion Applications are widely adopted by enterprises worldwide, and the demand for skilled Oracle Fusion Technical Consultants and OIC experts is skyrocketing. Learning Oracle Fusion Technical + OIC will open up career opportunities in ERP consulting, integration development, and cloud solutions. Companies seek professionals who can bridge the gap between Oracle Fusion ERP and various third-party applications through OIC integrations.
Conclusion
Our Best Oracle Fusion Technical + OIC Online Training is designed to provide a strong foundation and advanced expertise in Fusion Technical and OIC concepts. With real-world projects, hands-on exercises, and expert guidance, you will gain the skills needed to succeed in today’s competitive job market.
Whether you are a beginner looking to start your career in Oracle Fusion or an experienced professional aiming to upskill, this course will help you advance your career.

0 notes
Text
Introduction
Microsoft Excel is a powerhouse for data management, and mastering its advanced functions can significantly improve efficiency in data analysis. Among its most powerful lookup functions are VLOOKUP, HLOOKUP, and XLOOKUP, which help users retrieve data quickly and accurately. Whether you’re a student, an aspiring data analyst, or a professional looking to enhance your Excel skills, understanding these functions is crucial.
Understanding Lookup Functions in Excel
Lookup functions are used to find specific values in a dataset. They are widely applied in data analysis, financial modeling, inventory management, and reporting. Let’s break down these essential functions: READ MORE
0 notes