#polls schmolls
Text
this is a survey and i'm very interested to see the results so please reblog after answering!
(also everything with two or more pronouns in one option is in any order of preference)
7K notes
·
View notes
Text


By: Nate Silver
Published: Mar 15, 2024
Earlier this week, John Burn-Murdoch of the Financial Times posted a thread that purported to show substantial losses for Democrats among non-white voters, which he termed a “racial realignment”. If you’re an election data junkie, you’ve probably seen it; it’s been viewed more than 7 million times on Twitter. Here is the graphic that kicked it off:
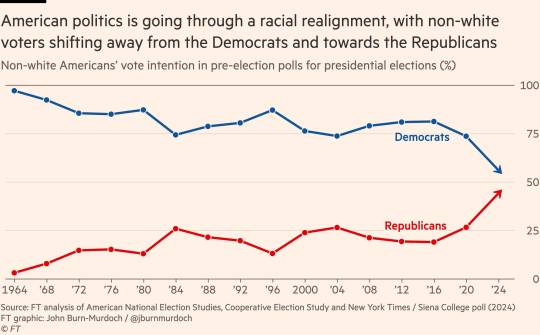
It’s worth reading the whole thread. There’s a lot of data, and Burn-Murdoch notes that the problems are particularly bad for Democrats among working-class voters of color, and younger ones. Many Black, Hispanic and Asian American voters have long identified as moderate or conservative rather than liberal, and Burn-Murdoch theorizes that Democrats’ tilt toward more liberal policies (though I’d prefer to call them “left” or “progressive” rather than “liberal”) is catching up with them, especially as memory of the Civil Rights Era fades.
The thread triggered its share of responses from the usual suspects, part of a recent pattern of poll denialism among Democrats that has crept its way into even the White House. And it’s true that there are some things you could critique. Burn-Murdoch is mixing and matching data from different polls, and the observation from 2024 is based solely on the recent New York Times / Siena College poll, which has a relatively small sample size; I’d rather that he’d have taken an average of different surveys.
If he’d done that, though, he’d likely have found the same thing. As you may know, I’m not much of a fan of digging into poll crosstabs. Because of the small sample sizes an
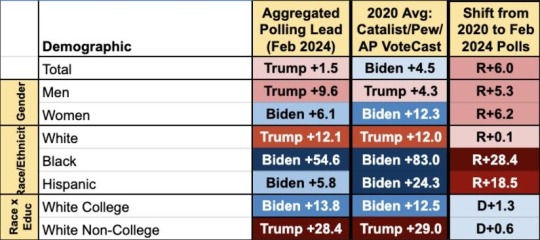
d difficulties in reaching certain underrepresented groups, you can always find something “wrong” with them and use that to dismiss polling results you don’t like. However, the Adam Carlson1 has been performing an invaluable service by aggregating the results of different polls together, which at least solves the sample size problem. And he’s finding that Joe Biden’s share of the vote has dropped dramatically among Black and Hispanic voters as compared with an average reliable estimates of the 2020 vote:
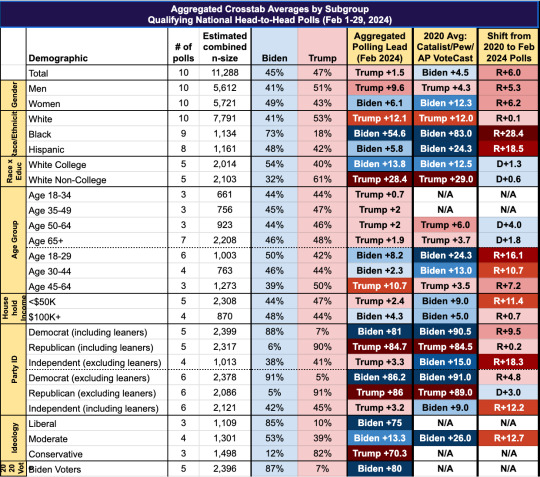
As you can see, Biden’s margin against Donald Trump has basically not moved an inch among white voters; he’s losing them by 12 percentage points, as he did in 2020. However, Biden is now only winning Hispanics by 7 percentage points — down from 24 points in 2020 — and Black voters by “only” 55 points, as compared with 83 points in 2020.
I’m not going to cover every possible difficulty when surveying non-white voters, who generally have lower response rates to polls than white voters do. I’m just saying this has been a consistent pattern; Carlson has been doing the same analysis for months now, and he’s been finding the same thing every time. So at the very least, Democrats can’t wish this problem away by complaining about small sample sizes, although that doesn’t mean they won’t try.
But polls, schmolls. Is it really plausible that there could be swings this large when it comes to actual votes?
Sure. It’s at least plausible. Let’s look at data from two places where non-white voters are plentiful. One is somewhere I’ve never been to, Starr County in South Texas, and the other is the place where I live, New York City.
Starr County is 98 percent Hispanic — the most of any county in the country outside of Puerto Rico — which makes it a uniquely valuable data point. There are no possible problems with ecological inference — misconstruing the behavior of individuals or particular subgroups from aggregate data — when basically everyone there is Hispanic. Starr County is also quite poor, in the Rio Grande Valley along the Mexican border, so it’s a particularly good place to look for patterns among working-class Hispanics. And what’s happening there ought to be frightening to Democrats. Here are the presidential election results in Starr County from 2008 through 2020:
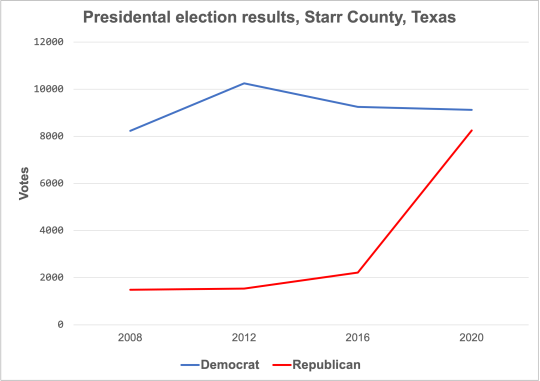
I’ve charted these as the total number of votes rather than just the vote margin, because that’s really what tells the story. Biden received about as many votes in Starr County as Hillary Clinton did in 2016, or as Barack Obama did in 2008 or 2012. But Trump surged from receiving 2218 votes in 2016 to 8247 votes, almost four times as many, in 2020. I’ve rarely seen anything like that, especially in the contemporary American political landscape where partisan preferences tend to be relatively stable. Turnout was much higher in Starr County in 2020 — but those new voters came out overwhelmingly for Trump, contradicting the longstanding belief that Democrats benefit from higher turnout among minority groups. The shift of the Hispanic vote in South Texas has undermined Democrats’ dreams of turning Texas blue, or at least purple, offsetting gains that Democrats have made in the Houston, Dallas and Austin metro areas.
It’s not just a Trump thing, either. In 2022, Henry Cuellar, the Democratic congressman in Texas’s 28th congressional district which represents Starr County and others along the Mexican border, won by 13 points. That’s not bad, I guess. But Cueller had won the race by 19 points in 2020, and by 69 points in 2018 against a Libertarian candidate as Republicans hadn’t even bothered to contest the race. He won by 35 points in 2016, when Republicans did have a nominee.
Another place to find heavy concentrations of non-white voters is New York City. And here are the results there in presidential and gubernatorial elections since 2012 in the five boroughs as well as the three innermost suburban counties, Westchester County north of New York City on the mainland, and Nassau and Suffolk counties on Long Island:
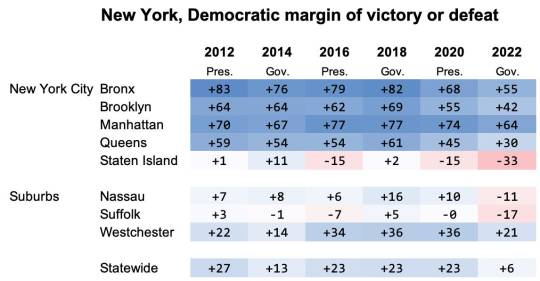
The story here is somewhat more nuanced: Andrew Cuomo, the Democrats’ gubernatorial nominee in 2014 and 2018, was relatively popular in Long Island and in Staten Island, whereas the Republican gubernatorial nominee in 2022, Lee Zeldin, represented Eastern Long Island (mostly Suffolk County) in Congress.
But still, these trends are ominous for Democrats. In the Bronx, where less than 10 percent of the population is non-Hispanic white, Democrats went from winning the presidential race by 83 points in 2012 to winning the gubernatorial race by only 55 points in 2022, a 28-point swing. And there was a 29-point swing against Democrats in Queens — which is just 26 percent non-Hispanic white — between 2012 and 2022. Democrats’ results have been steadier in wealthier (although still relatively diverse) Manhattan, conversely, and in well-to-do Westchester County.
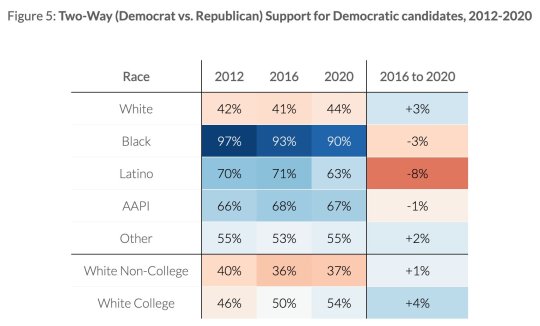
Nationwide trends aren’t this dramatic, although you see some of the same pattern. Modeling from Catalist, a Democratic firm, found that Democrats went from getting 97 percent of the two-party Black vote (that is, the vote excluding third parties) in 2012 to 90 percent in 2020. And they dropped from 70 percent of the Hispanic vote to 63 percent over the same period:

Democrats’ share of the Asian American vote had been steadier by comparison — but then it fell substantially in the 2022 midterms as compared with 2020, according to a Catalist analysis:
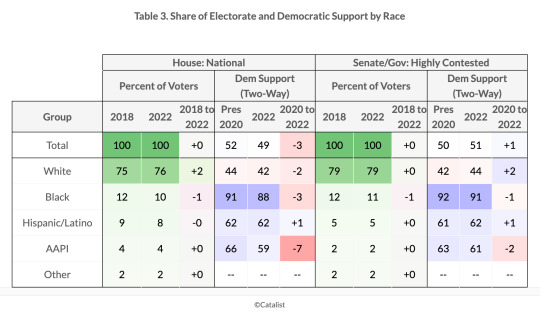
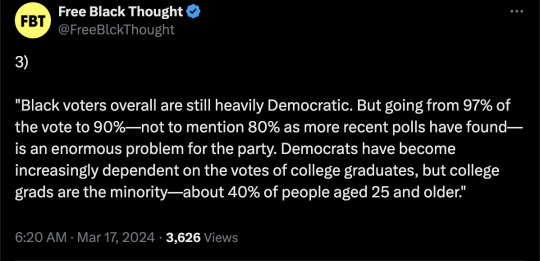
It’s worth pointing out that Black voters overall are still heavily Democratic. But going from 97 percent of the vote to 90 percent — not to mention 80 percent as more recent polls have found — is an enormous problem for the party. Democrats have become increasingly dependent on the votes of college graduates, but college grads are the minority — about 40 percent of people aged 25 and older have a bachelor’s degree or higher, and the share is no longer really increasing as the number of Americans attending college is leveling off, particularly among men. Without winning huge majorities of Black voters, and solid majorities of Hispanics and Asian Americans, Democrats’ electoral math doesn’t add up to a majority.
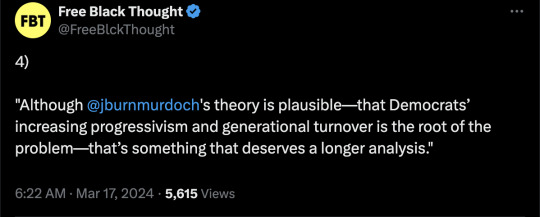
Let’s keep it to that, for now. Although Burn-Murdoch’s theory is plausible — that Democrats’ increasing progressivism and generational turnover is the root of the problem — that’s something that deserves a longer analysis. What he’s seeing in the data shouldn’t be dismissed as some kind of outlier, however. It’s been replicated in poll after poll, and it has become increasingly apparent in election results, too.
#Free Black Thought#Nate Silver#US politics#Democratic Party#Republican party#US elections#religion is a mental illness
1 note
·
View note
Text
Here's what kids think of Trump's first year in office
Here’s what kids think of Trump’s first year in office
[ad_1]
Opinion polls schmopinion schmolls, we want to know what the kids think!
On Thursday night Jimmy Kimmel Live took to the street to ask passing kids what they thought of how Trump’s first year in office has gone.
One child thought that Trump has done “great” at saving the world from “harmony.” Another would like the POTUS to stop threatening North Korea because he doesn’t want to “get…
View On WordPress
0 notes
Text
Here's what kids think of Trump's first year in office
[ad_1]
Opinion polls schmopinion schmolls, we want to know what the kids think!
SEE ALSO: Jimmy Kimmel skewers Trump’s Fake News Awards with a little help from his dad
On Thursday night Jimmy Kimmel Live took to the street to ask passing kids what they thought of how Trump’s first year in office has gone.
One child thought that Trump has done “great” at saving the world from “harmony.”…
View On WordPress
0 notes
Text
340 notes
·
View notes
Text
98 notes
·
View notes
Text
okay a poll based on the results of my other one because now i'm interested:
as always, be as specific as you like in the tags and reblog for more exposure!!
34 notes
·
View notes
Text
13 notes
·
View notes
Text
#school#education#private school#public school#polls#mine#polls schmolls#personally i went to private school for the first five years and then went to public#feel free to comment on which you preferred as well
5 notes
·
View notes
Text
and then, related to my last poll;
#jordi babbles#i had a helix i had to take out which i was really disappointed about#so im interested in how many people have done the same#mine#polls#piercings#polls schmolls
8 notes
·
View notes
Text
#idk this is a sort of how do you think of love/what does love mean to you thing#or what you think the best theme or comparison for love is#especially in poetry or prose idk#jordi babbles#polls schmolls
7 notes
·
View notes

Text
5 notes
·
View notes
Text
3 notes
·
View notes
Text
4 notes
·
View notes
Last Seen Blogs

soft-lavender
cowgals? more like i love you

binkybois
hangry axolotl

xr0tting-baul-teethx
Weirdcore shitpost blog

physioservices
Physiotherapy Services

kris-artery
Gaming und Multiplayer auf hohem Niveau