#sql sum function
Explore tagged Tumblr posts
Visit Tumblr Blog
Explore Tumblr blogs with no restrictions, modern design and the best experience.
Last Seen Tumblr Blogs


Fun Fact
Total funding amounts to $125.3M.
Text
Python Libraries to Learn Before Tackling Data Analysis
To tackle data analysis effectively in Python, it's crucial to become familiar with several libraries that streamline the process of data manipulation, exploration, and visualization. Here's a breakdown of the essential libraries:
1. NumPy
- Purpose: Numerical computing.
- Why Learn It: NumPy provides support for large multi-dimensional arrays and matrices, along with a collection of mathematical functions to operate on these arrays efficiently.
- Key Features:
- Fast array processing.
- Mathematical operations on arrays (e.g., sum, mean, standard deviation).
- Linear algebra operations.
2. Pandas
- Purpose: Data manipulation and analysis.
- Why Learn It: Pandas offers data structures like DataFrames, making it easier to handle and analyze structured data.
- Key Features:
- Reading/writing data from CSV, Excel, SQL databases, and more.
- Handling missing data.
- Powerful group-by operations.
- Data filtering and transformation.
3. Matplotlib
- Purpose: Data visualization.
- Why Learn It: Matplotlib is one of the most widely used plotting libraries in Python, allowing for a wide range of static, animated, and interactive plots.
- Key Features:
- Line plots, bar charts, histograms, scatter plots.
- Customizable charts (labels, colors, legends).
- Integration with Pandas for quick plotting.
4. Seaborn
- Purpose: Statistical data visualization.
- Why Learn It: Built on top of Matplotlib, Seaborn simplifies the creation of attractive and informative statistical graphics.
- Key Features:
- High-level interface for drawing attractive statistical graphics.
- Easier to use for complex visualizations like heatmaps, pair plots, etc.
- Visualizations based on categorical data.
5. SciPy
- Purpose: Scientific and technical computing.
- Why Learn It: SciPy builds on NumPy and provides additional functionality for complex mathematical operations and scientific computing.
- Key Features:
- Optimized algorithms for numerical integration, optimization, and more.
- Statistics, signal processing, and linear algebra modules.
6. Scikit-learn
- Purpose: Machine learning and statistical modeling.
- Why Learn It: Scikit-learn provides simple and efficient tools for data mining, analysis, and machine learning.
- Key Features:
- Classification, regression, and clustering algorithms.
- Dimensionality reduction, model selection, and preprocessing utilities.
7. Statsmodels
- Purpose: Statistical analysis.
- Why Learn It: Statsmodels allows users to explore data, estimate statistical models, and perform tests.
- Key Features:
- Linear regression, logistic regression, time series analysis.
- Statistical tests and models for descriptive statistics.
8. Plotly
- Purpose: Interactive data visualization.
- Why Learn It: Plotly allows for the creation of interactive and web-based visualizations, making it ideal for dashboards and presentations.
- Key Features:
- Interactive plots like scatter, line, bar, and 3D plots.
- Easy integration with web frameworks.
- Dashboards and web applications with Dash.
9. TensorFlow/PyTorch (Optional)
- Purpose: Machine learning and deep learning.
- Why Learn It: If your data analysis involves machine learning, these libraries will help in building, training, and deploying deep learning models.
- Key Features:
- Tensor processing and automatic differentiation.
- Building neural networks.
10. Dask (Optional)
- Purpose: Parallel computing for data analysis.
- Why Learn It: Dask enables scalable data manipulation by parallelizing Pandas operations, making it ideal for big datasets.
- Key Features:
- Works with NumPy, Pandas, and Scikit-learn.
- Handles large data and parallel computations easily.
Focusing on NumPy, Pandas, Matplotlib, and Seaborn will set a strong foundation for basic data analysis.
7 notes
·
View notes
Text
My strengths and ambitions


Generic skills and forces:
Research, "Creative" Writing & Analysis (atlases, encyclopedias, reference works...)
Multimedia Collaging and Video Compositing
Analog Media and Digital Data Preservation
Composing tracker music
Technical documentation
(explorable?) multimedia explainers
History (& alternate history)
Information technologies
Historical hardware & software
Sidestream software & "operating" systems
Linguistics?
Casual spirituality topics?
TTRPG crawl campaign setting & systemic designs...
Toybox tools and manifestation games...
Causal collectible card games and expansive board game mods...
Demoscene and game modding...
Vector / Retro Aliased Raster illustrations
Animations & interactive (A?)SVG cartoons
Free, Libre and Open Source movement (open culture, open hardware and open software, et cetera.)
Computer builds and overall customization (especially the looks but also functionality, both virtual and physically informed)
Sensible, caring and detail-oriented.
Specific skills (existing and upcoming) and emphasis points for my career
Page pixel dolls, banner blinkies, panels & other animated GIF graphics...
Printables (blanks, worksheet, guestbooks, greeting cards...)
Stickers & clipart
Stationery (especially legacy/obsoleted types)
Desktop organizers with bundled theme packs (even cursors, icons, sounds, widgets and almost everything else under the sun?)
Monero+Liquid online shop
ClipStudioPaint (upcoming...)
WordPerfect from Corel (upcoming...)
OpenMPT + MilkyTracker (tracker music)
ReNoise (upcoming...)
LibreOffice
GIMP with G'MIC
Krita with G'MIC
GrafX2 (upcoming...)
Kate & KDevelop
Version control with Git (GitHub, GitLab, GitTea...)
Homebrew responsive yet retro stylized HTML5/CSS3 static sites/blogs with Neocities + Hexo (and Jekyll?)
XML+XSL
SQL?
Vim & Emacs
Linux + BSD commands with both Bash and Fish shells
KDE Plasma
Linux/BSD/POSIX certifications?
Common Lisp & Nim (with C bindings?)
WDC & KKIT
SLADE & GZDOOM
Godot + Qodot
Hammer++
Entrepreneurship / autonomous work?
Dreams and projects:
Video rental-store full-stack ticket database
Fiction atlases and themed pointcrawl semi-historical adventures...
Cozy game levels for raycasters and doom-clones
Cozy social spaces in Qodot & Hammer++
Cartoon pitches & short animated explainers
Toybox sets and modular building easy assemblers...
TTRPG campaign setting and supplementary rulesets...
Stylized yesterweb responsive pages
Analog media production (music video and data Digipaks)
SVG stickers, PDF printables and OGG content...
Fully custom developer desktop environment themes & scripted auto-riced workflows
Tutorials, listicles and other long-form content threads...
Raw art files and game-ready asset / clipart bundles
Manifestation / affirmation Tarot-sized card deques
Alternate technological implementations...
Dumbphone / "feature phone", two-way pagers and other dumb specialized devices... designing.
Constructed language(s) with nuanced dialects and poetic audio recordings...
Library economy in diecast car miniature worlds for sci-fi films
My very own guidebooks and curations
Lofi illustrations, podcast covers and album digipaks with feelies...
I hope that does sum up my professional + hobby goals well enough.
6 notes
·
View notes
Text
Boost Your SQL Skills: Master Aggregate Functions Step-by-Step
Boost your SQL skills by mastering aggregate functions step-by-step! Learn how to use SUM, COUNT, AVG, MIN, and MAX effectively with practical examples to level up your database querying abilities.
0 notes
Text
A Beginner’s Guide to NVH Testing in India’s Automotive Industry

In today’s fast-paced world of data analytics, staying relevant means knowing how to turn raw data into smart decisions—and fast. Sure, tools like Python, SQL, and Power BI are gaining popularity, but if there’s one tool that still stands strong in 2025, it’s Microsoft Excel.
Whether you’re just starting out or you’ve been crunching numbers for years, Excel for data analyst roles remains one of the most practical and in-demand skills. It strikes that perfect balance between simplicity and capability, making it the go-to for countless data tasks.
In this post, we’ll look at why Excel isn’t going anywhere, the most valuable Excel job skills right now, and how you can sharpen your expertise to keep up with the latest demands in data analytics.
The Modern-Day Data Analyst: More Than Just a Number Cruncher
Back in the day, data analysts were mostly behind the scenes—collecting numbers, making charts, and maybe sending the occasional report. Fast forward to 2025, and their role is far more central. Today’s analysts are storytellers, business advisors, and problem solvers.
Here’s what a typical day might include:
Pulling raw data from different platforms (think CRMs, ERPs, databases, web analytics tools)
Cleaning and organizing that data so it actually makes sense
Analyzing trends to help forecast what’s coming next
Creating reports and dashboards that communicate findings clearly
Presenting insights to decision-makers in a way that drives action
And you guessed it—Excel shows up in almost every one of these steps.
Why Excel Still Matters (a Lot)
Some might argue that Excel is “old-school,” but here’s the reality: it’s still everywhere. And for good reason.
1. It’s Familiar to Everyone
From finance teams to marketing departments, most professionals have at least a basic grasp of Excel. That makes collaboration easy—no need to explain a tool everyone’s already using.
2. Quick Results, No Coding Required
Need to filter a dataset or run a few calculations? You can do it in Excel in minutes. It’s great for ad-hoc analysis where speed matters and there’s no time to build complex code.
3. Plays Nice with Other Tools
Excel isn’t an island. It connects smoothly with SQL databases, Google Analytics, Power BI, and even Python. Power Query is especially useful when pulling in and reshaping data from different sources.
4. It’s on Every Work Computer
You don’t need to install anything or get IT involved. Excel is ready to go on pretty much every company laptop, which makes it incredibly convenient.
Top Excel Skills Every Data Analyst Needs in 2025
To really stand out, you’ll want to move past the basics. Employers today expect you to do more than just sum a column or build a pie chart. Here’s where to focus your energy:
1. Data Cleaning and Transformation
Use functions like CLEAN(), TRIM(), and Text to Columns to fix messy data.
Power Query is a game-changer—it lets you clean, merge, and reshape large datasets without writing a line of code.
2. Advanced Formulas
Learn how to use INDEX, MATCH, XLOOKUP, IFERROR, and dynamic arrays. These help you build smarter, more flexible spreadsheets.
Nesting formulas (formulas within formulas) is super helpful for building logic into your models.
3. PivotTables and PivotCharts
Still one of the fastest ways to analyze large data sets.
Great for grouping, summarizing, and drilling into data—all without writing any SQL.
4. Power Query and Power Pivot
These tools turn Excel into a mini-BI platform.
You can pull in data from multiple tables, define relationships, and use DAX for more advanced calculations.
5. Interactive Dashboards
Combine charts, slicers, and conditional formatting to build dashboards that update as data changes.
Form controls (like drop-downs or sliders) add a professional touch.
6. Automation with Macros and VBA
Automate tasks like data formatting, report generation, and file creation.
Even basic VBA scripts can save hours each week on repetitive tasks.
Real-World Excel Use Cases That Still Matter
Let’s get practical. Here’s how Excel is still making an impact across industries:
Sales & Marketing: Track campaign performance, customer engagement, and conversion rates—all in a single dashboard.
Finance: Build cash flow models, scenario forecasts, and budget reports that help CFOs make data-driven calls.
Healthcare: Monitor key performance indicators like patient wait times or readmission rates.
Logistics: Analyze delivery times, shipping costs, and supplier performance to streamline operations.
These aren’t theoretical use cases—they’re actual day-to-day tasks being done in Excel right now.
Excel vs. Other Tools
Let’s be real: no single tool does it all. Excel fits into a broader ecosystem of data tools. Here’s a quick breakdown:TaskBest ToolHow Excel ContributesQuick AnalysisExcelFast and easy to useDashboardsPower BI / TableauExcel dashboards are perfect for internal or lightweight reportsData CleaningSQL / Power QueryExcel connects and transforms with Power QueryBig DataPython / RUse Excel for summary views and visualizations of Python output
Excel’s strength lies in how easily it fits into your workflow—even when you’re working with more advanced tools.
How to Get Better at Excel in 2025
If you’re serious about leveling up, here’s how to grow your skills:
1. Take a Course That Focuses on Analytics
Pick one that emphasizes real business problems and gives you projects to work on. Case studies are gold.
2. Practice on Real Data
Websites like Kaggle, data.gov, or even your company’s historical data (with permission, of course) are great places to start.
3. Learn Keyboard Shortcuts
You’ll work faster and feel more confident. Start with common ones like Ctrl + Shift + L for filters or Alt + = for autosum.
4. Dive into Power Query and Power Pivot
Once you get the hang of them, you’ll wonder how you ever worked without them.
5. Build Mini Projects
Create dashboards or models that solve specific business problems—like tracking customer churn or sales performance. These can become portfolio pieces for your next job interview.
Conclusion
Excel isn’t going anywhere. It’s deeply woven into how businesses run, and in 2025, it’s still one of the best tools in a data analyst’s toolkit. It might not be as flashy as Python or as powerful as Tableau, but it gets the job done—and done well.
If you’re aiming to future-proof your career, investing in advanced Excel job skills is a smart move. From dashboards to data modeling, the possibilities are endless. And when paired with other tools, Excel helps you deliver even more value to your team.
So keep practicing, keep building, and remember—being great at Excel can set you apart in the data world.
FAQs
Is Excel still worth learning for data analysis in 2025?Yes! Excel remains one of the top skills hiring managers look for in data analyst roles. It’s everywhere—from startups to large enterprises.
What are the most useful Excel features for analysts? Advanced formulas, PivotTables, Power Query, Power Pivot, and dashboard design are the big ones. Knowing VBA is a bonus.
Can Excel handle big datasets?To an extent. While Excel has limits, features like Power Query and Power Pivot help it manage more data than it could in the past. For really massive data, combine it with tools like SQL or Power BI.
Should I learn Excel or Python?Both. Excel is great for quick analysis and reporting. Python is better for automation, data science, and machine learning. Together, they’re a powerful combo.
How can I show off my Excel skills to employers? Create dashboards or reports based on real data and include them in a portfolio. Show how you used Excel to solve actual business problems on your resume.
0 notes
Text
Essential Technical Skills and Qualities to Look for in a Django Developer

The rising scalability of digital products adds to the rising demand for secure and scalable backend solutions. Django, a Python-based web framework, is a popular choice among tech companies for its clean design, rapid development potential, and strong security protocols.
If you are considering hiring software developers skilled in Django, knowing the skills and traits to prioritize can save time, money, and headaches down the road. From startups to enterprise-level tech companies, the right developer is someone who not not only understands Django inside out but can also collaborate and grow with your team. Let’s understand what balance between technical finesse and soft skills is required when you are hiring Django developers.
What Tech Companies Should Know Before Making a Hire
Proficient in Python and Django framework
Python basics, such as OOP ideas, list comprehensions, and data structures, are essential for a proficient Django developer. On the Django side, they ought to be familiar with:
Optimizing queries using Django ORM.
Views based on classes and functions.
Developing APIs using the Django REST Framework.
Signals, form handling, and middleware.
These are essential for creating programs that are dependable and maintainable.
Database and backend knowledge
SQL expertise and familiarity with PostgreSQL or MySQL are essential because Django developers work directly with databases. Additional value is added by those who are also knowledgeable in indexing and schema design. Django knowledge is a solid starting point if you're trying to hire backend developers because many tech businesses also favour applicants with general backend abilities.
Version control and deployment expertise
A competent developer ought to be familiar with Git. Beyond that, however, it is a huge plus to have experience with Docker, CI/CD pipelines, and deploying Django projects on platforms such as AWS, Heroku, or DigitalOcean. As a result, the developer can contribute to production-ready code more successfully.
Soft skills and collaboration
Your workflow may be slowed down by a technically proficient developer who struggles with communication. When hiring Django developers, try to find someone who can take initiative, communicate ideas clearly, and work well in a team. These attributes are crucial, particularly in cross-functional workplaces.
Summing Up
Tech organizations want talent that blends technical expertise with teamwork in order to create scalable online apps. Whether you are looking to expand your backend team or hire software developers for a new product, Django developers with a solid background in Python, databases, and deployment should be at the top of your list. Setting the proper skills as a top priority early on will guarantee that your initiatives go more smoothly and launch sooner.
0 notes
Text
Unlock the Power of Data: SQL - Your Essential First Step in Data Science
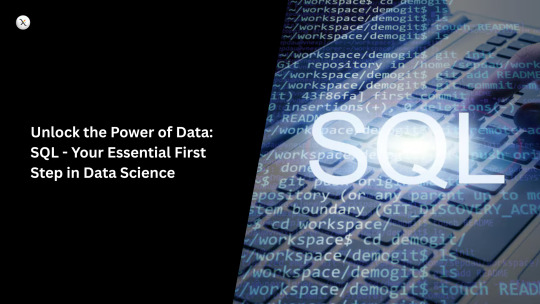
So, you're eager to dive into the fascinating world of data science? You've heard about Python, R, and complex machine learning algorithms. But before you get swept away by the advanced stuff, let's talk about a foundational skill that's often underestimated but absolutely crucial: SQL (Structured Query Language).
Think of SQL as the universal language for talking to databases – the digital warehouses where most of the world's data resides. Whether you're aiming to analyze customer behavior, predict market trends, or build intelligent applications, chances are you'll need to extract, manipulate, and understand data stored in databases. And that's where SQL shines.
Why SQL is Your Best Friend as a Beginner Data Scientist:
You might be wondering, "With all the fancy tools out there, why bother with SQL?" Here's why it's the perfect starting point for your data science journey:
Ubiquitous and Essential: SQL is the standard language for interacting with relational databases, which are still the backbone of many organizations' data infrastructure. You'll encounter SQL in almost every data science role.
Mastering Data Wrangling: Before you can build models or create visualizations, you need to clean, filter, and transform your data. SQL provides powerful tools for these crucial data wrangling tasks. You can select specific columns, filter rows based on conditions, handle missing values, and join data from multiple tables – all with simple, declarative queries.
Understanding Data Structure: Writing SQL queries forces you to understand how data is organized within databases. This fundamental understanding is invaluable when you move on to more complex analysis and modeling.
Building a Strong Foundation: Learning SQL provides a solid logical and analytical foundation that will make it easier to grasp more advanced data science concepts and tools later on.
Efficiency and Performance: For many data extraction and transformation tasks, SQL can be significantly faster and more efficient than manipulating large datasets in memory with programming languages.
Bridging the Gap: SQL often acts as a bridge between data engineers who manage the databases and data scientists who analyze the data. Being proficient in SQL facilitates better communication and collaboration.
Interview Essential: In almost every data science interview, you'll be tested on your SQL abilities. Mastering it early on gives you a significant advantage.
What You'll Learn with SQL (The Beginner's Toolkit):
As a beginner, you'll focus on the core SQL commands that will empower you to work with data effectively:
SELECT: Retrieve specific columns from a table.
FROM: Specify the table you want to query.
WHERE: Filter rows based on specific conditions.
ORDER BY: Sort the results based on one or more columns.
LIMIT: Restrict the number of rows returned.
JOIN: Combine data from multiple related tables (INNER JOIN, LEFT JOIN, RIGHT JOIN).
GROUP BY: Group rows with the same values in specified columns.
Aggregate Functions: Calculate summary statistics (COUNT, SUM, AVG, MIN, MAX).
Basic Data Manipulation: Learn to insert, update, and delete data (though as a data scientist, you'll primarily focus on querying).
Taking Your First Steps with Xaltius Academy's Data Science and AI Program:
Ready to unlock the power of SQL and build a strong foundation for your data science journey? Xaltius Academy's Data Science and AI program recognizes the critical importance of SQL and integrates it as a fundamental component of its curriculum.
Here's how our program helps you master SQL:
Dedicated Modules: We provide focused modules that systematically introduce you to SQL concepts and commands, starting from the very basics.
Hands-on Practice: You'll get ample opportunities to write and execute SQL queries on real-world datasets through practical exercises and projects.
Real-World Relevance: Our curriculum emphasizes how SQL is used in conjunction with other data science tools and techniques to solve actual business problems.
Expert Guidance: Learn from experienced instructors who can provide clear explanations and answer your questions.
Integrated Skill Development: You'll learn how SQL complements other essential data science skills like Python programming and data visualization.
Conclusion:
Don't let the initial buzz around advanced algorithms overshadow the fundamental importance of SQL. It's the bedrock of data manipulation and a crucial skill for any aspiring data scientist. By mastering SQL, you'll gain the ability to access, understand, and prepare data – the very fuel that drives insightful analysis and powerful AI models. Start your data science journey on solid ground with SQL, and let Xaltius Academy's Data Science and AI program guide you every step of the way. Your data-driven future starts here!
0 notes
Text
What is the best way to begin learning Power BI, and how can a beginner smoothly progress to advanced skills?
Introduction to Power BI
Power BI is a revolutionary tool in the data analytics universe, famous for its capacity to transform raw data into engaging visual insights. From small startups to global multinationals, it is a vital resource for making informed decisions based on data.

Learning the Core Features of Power BI
At its essence, Power BI provides three fundamental features:
Data Visualization – Designing dynamic and interactive visuals.
Data Modelling – Organizing and structuring data for proper analysis.
DAX (Data Analysis Expressions) – Driving complex calculations and insights.
Setting Up for Success
Getting started starts with downloading and installing Power BI Desktop. Getting familiar with its interface, menus, and features is an essential step in your learning process.
Starting with the Basics
Beginners often start by importing data from Excel or SQL. Your initial focus should be on creating straightforward visuals, such as bar charts or line graphs, while learning to establish relationships between datasets.
Importance of Structured Learning Paths
A structured learning path, such as enrolling in a power BI certification course in washington, San Francisco, or New York, accelerates your progress. These courses provide a solid foundation and hands-on practice.
Working with Hands-On Projects
Hands-on projects are the optimal method to cement your knowledge. Begin with building a simple sales dashboard that monitors revenue patterns, providing you with instant real-world exposure.
Building Analytical Skills
Early on, work on describing data in tables and matrices. Seeing trends using bar charts or pie charts improves your capacity to clearly communicate data insights.
Moving on to Intermediate Skills
After becoming familiar with the fundamentals, it's time to go deeper. Understand how to work with calculated fields, measures, and Power Query Editor. Data model optimization will enhance report performance.
Learning Advanced Visualization Methods
Elevate your reports to the next level with personalize visuals. Add slicers to slice data or drill-through features for detailed analysis, making your dashboards more interactive.
Mastering Data Analysis Expressions (DAX)
DAX is the powerhouse behind Power BI’s analytics capabilities. Start with simple functions like SUM and AVERAGE, and gradually explore advanced calculations involving CALCULATE and FILTER.
Working with Power BI Service
Publishing your reports online via Power BI Service allows for easy sharing and collaboration. Learn to manage datasets, create workspaces, and collaborate effectively.
Collaborative Features in Power BI
Use shared workspaces for collaboration. Utilize version control to avoid conflicts and allow seamless collaboration.
Data Security and Governance
Data security is top-notch. Master setting roles, permissions management, and adherence to data governance policies to guarantee data integrity.
Power BI Integration with Other Tools
Maximize the power of Power BI by integrating it with Excel or linking it with cloud platforms such as Azure or Google Drive.
Preparing for Power BI Certification
Certification proves your proficiency. A power BI certification course in san francisco or any other city can assist you in excelling on exam content, ranging from data visualization to expert DAX.
Emphasizing the Top Courses for Power BI
Courses in Washington and New York city’s provide customized content to fit the demands of skilled professionals at all levels. Their complete curriculum helps students learn in-depth.
Keeping Current with Power BI Trends
Stay ahead by exploring updates, joining the Power BI community, and engaging with forums to share knowledge.
Common Challenges and How to Overcome Them
Troubleshooting is part of the process. Practice resolving common issues, such as data import errors or incorrect DAX outputs, to build resilience.
Building a Portfolio with Power BI
A well-rounded portfolio showcases your skills. Include projects that demonstrate your ability to solve real-world problems, enhancing your appeal to employers.
Conclusion and Next Steps
Your Power BI journey starts small but culminates in huge rewards. You may be learning on your own or doing a power BI certification course in new york, but whatever you choose, embrace the journey and feel the transformation as you develop into a Power BI master.
0 notes
Text
Aggregation Functions in CQL Programming Language
A Developer’s Guide to Aggregation Functions in CQL for Cassandra Databases Hello CQL Developers! Aggregation functions in CQL (Cassandra Query Language) help you perform essential data analysis directly within your queries. With functions like COUNT, SUM, AVG, MIN, and MAX, you can quickly compute statistics without needing complex application logic. Unlike traditional SQL databases,…
0 notes
Text
SQL for Data Science: Essential Queries Every Analyst Should Know
Introduction
SQL (Structured Query Language) is the backbone of data science and analytics. It enables analysts to retrieve, manipulate, and analyze large datasets efficiently. Whether you are a beginner or an experienced data professional, mastering SQL queries is essential for data-driven decision-making. In this blog, we will explore the most important SQL queries every data analyst should know.
1. Retrieving Data with SELECT Statement
The SELECT statement is the most basic yet crucial SQL query. It allows analysts to fetch data from a database.
Example:
SELECT name, age, salary FROM employees;
This query retrieves the name, age, and salary of all employees from the employees table.
2. Filtering Data with WHERE Clause
The WHERE clause is used to filter records based on specific conditions.
Example:
SELECT * FROM sales WHERE amount > 5000;
This query retrieves all sales transactions where the amount is greater than 5000.
3. Summarizing Data with GROUP BY & Aggregate Functions
GROUP BY is used with aggregate functions (SUM, COUNT, AVG, MAX, MIN) to group data.
Example:
SELECT department, AVG(salary) FROM employees GROUP BY department;
This query calculates the average salary for each department.
4. Combining Data with JOINs
SQL JOIN statements are used to combine rows from two or more tables based on a related column.
Example:
SELECT employees.name, departments.department_name FROM employees INNER JOIN departments ON employees.department_id = departments.id;
This query retrieves employee names along with their department names.
5. Sorting Data with ORDER BY
The ORDER BY clause sorts data in ascending or descending order.
Example:
SELECT * FROM customers ORDER BY last_name ASC;
This query sorts customers by last name in ascending order.
6. Managing Large Datasets with LIMIT & OFFSET
The LIMIT clause restricts the number of rows returned, while OFFSET skips rows.
Example:
SELECT * FROM products LIMIT 10 OFFSET 20;
This query retrieves 10 products starting from the 21st record.
7. Using Subqueries for Advanced Analysis
A subquery is a query within another query.
Example:
SELECT name FROM employees WHERE salary > (SELECT AVG(salary) FROM employees);
This query retrieves employees earning more than the average salary.
8. Implementing Conditional Logic with CASE Statement
The CASE statement allows conditional logic in SQL queries.
Example:
SELECT name, CASE WHEN salary > 70000 THEN 'High' WHEN salary BETWEEN 40000 AND 70000 THEN 'Medium' ELSE 'Low' END AS salary_category FROM employees;
This query categorizes employees based on their salary range.
9. Merging Data with UNION & UNION ALL
UNION combines results from multiple SELECT statements and removes duplicates, while UNION ALL retains duplicates.
Example:
SELECT name FROM employees UNION SELECT name FROM managers;
This query retrieves a list of unique names from both employees and managers.
10. Advanced Aggregation & Ranking with Window Functions
Window functions allow calculations across a set of table rows related to the current row.
Example:
SELECT name, department, salary, RANK() OVER (PARTITION BY department ORDER BY salary DESC) AS salary_rank FROM employees;
This query ranks employees within each department based on their salary
0 notes
Text
Explain advanced transformations using Mapping Data Flows.

Advanced Transformations Using Mapping Data Flows in Azure Data Factory
Mapping Data Flows in Azure Data Factory (ADF) provide a powerful way to perform advanced transformations on data at scale. These transformations are executed in Spark-based environments, allowing efficient data processing. Below are some of the key advanced transformations that can be performed using Mapping Data Flows.
1. Aggregate Transformation
This transformation allows you to perform aggregate functions such as SUM, AVG, COUNT, MIN, MAX, etc., on grouped data.
Example Use Case:
Calculate total sales per region.
Find the average transaction amount per customer.
Steps to Implement:
Add an Aggregate transformation to your data flow.
Choose a grouping column (e.g., Region).
Define aggregate functions (e.g., SUM(SalesAmount) AS TotalSales).
2. Pivot and Unpivot Transformations
Pivot Transformation: Converts row values into columns.
Unpivot Transformation: Converts column values into rows.
Example Use Case:
Pivot: Transform sales data by year into separate columns.
Unpivot: Convert multiple product columns into a key-value structure.
Steps to Implement Pivot:
Select a column to pivot on (e.g., Year).
Define aggregate expressions (e.g., SUM(SalesAmount)).
Steps to Implement Unpivot:
Select multiple columns to unpivot.
Define a key-value output structure.
3. Window Transformation
Allows performing operations on a specific window of rows, similar to SQL window functions.
Example Use Case:
Calculate a running total of sales.
Find the rank of customers based on their purchase amount.
Steps to Implement:
Define partitioning (e.g., partition by CustomerID).
Use window functions (ROW_NUMBER(), RANK(), LEAD(), LAG(), etc.).
4. Lookup Transformation
Used to join two datasets based on a matching key.
Example Use Case:
Enrich customer data by looking up additional details from another dataset.
Steps to Implement:
Define the lookup source dataset.
Specify the matching key (e.g., CustomerID).
Choose the columns to retrieve.
5. Join Transformation
Allows joining two datasets using various join types (Inner, Outer, Left, Right, Cross).
Example Use Case:
Combine customer and order data.
Steps to Implement:
Select the join type.
Define join conditions (e.g., CustomerID = CustomerID).
6. Derived Column Transformation
Allows adding new computed columns to the dataset.
Example Use Case:
Convert date format.
Compute tax amount based on sales.
Steps to Implement:
Define expressions using the expression builder.
7. Conditional Split Transformation
Splits data into multiple outputs based on conditions.
Example Use Case:
Separate high-value and low-value orders.
Steps to Implement:
Define conditional rules (e.g., SalesAmount > 1000).
8. Exists Transformation
Checks if records exist in another dataset.
Example Use Case:
Identify customers who have made a purchase.
Steps to Implement:
Select the reference dataset.
Define the existence condition.
9. Surrogate Key Transformation
Generates unique IDs for records.
Example Use Case:
Assign unique customer IDs.
Steps to Implement:
Define the start value and increment.
10. Rank Transformation
Assigns ranking based on a specified column.
Example Use Case:
Rank products by sales.
Steps to Implement:
Define partitioning and sorting logic.
Conclusion
Azure Data Factory’s Mapping Data Flows provide a variety of advanced transformations that help in complex ETL scenarios. By leveraging these transformations, organizations can efficiently clean, enrich, and prepare data for analytics and reporting.
WEBSITE: https://www.ficusoft.in/azure-data-factory-training-in-chennai/
0 notes
Text
How to Learn Power BI: A Step-by-Step Guide
Power BI is a powerful business intelligence tool that allows users to analyze data and create interactive reports. Whether you’re a beginner or looking to enhance your skills, learning Power BI can open doors to career opportunities in data analytics and business intelligence. For those looking to enhance their skills, Power BI Online Training & Placement programs offer comprehensive education and job placement assistance, making it easier to master this tool and advance your career.

Here’s a step-by-step guide to mastering Power BI.
Step 1: Understand What Power BI Is
Power BI is a Microsoft tool designed for data analysis and visualization. It consists of three main components:
Power BI Desktop – Used for building reports and dashboards.
Power BI Service – A cloud-based platform for sharing and collaborating on reports.
Power BI Mobile – Allows users to access reports on smartphones and tablets.
Familiarizing yourself with these components will give you a clear understanding of Power BI’s capabilities.
Step 2: Install Power BI Desktop
Power BI Desktop is free to download from the Microsoft website. It’s the primary tool used to create reports and dashboards. Installing it on your computer is the first step to hands-on learning.
Step 3: Learn the Power BI Interface
Once installed, explore the Power BI interface, including:
Home Ribbon – Where you access basic tools like importing data and formatting visuals.
Data Pane – Displays the data tables and fields available for reporting.
Visualizations Pane – Contains different chart types, tables, and custom visuals.
Report Canvas – The workspace where you design and organize your reports.
Getting comfortable with the interface will make learning easier.
Step 4: Import and Transform Data
Power BI allows you to connect to various data sources like Excel, SQL databases, and cloud applications. Learning how to:
Import data from multiple sources.
Use Power Query Editor to clean and shape data.
Handle missing values, remove duplicates, and structure data for analysis. It’s simpler to master this tool and progress your profession with the help of Best Online Training & Placement programs, which provide thorough instruction and job placement support to anyone seeking to improve their talents.

Data transformation is a crucial step in building accurate and meaningful reports.
Step 5: Create Visualizations
Power BI provides multiple visualization options, including:
Bar charts, pie charts, and line graphs.
Tables, matrices, and cards.
Maps and custom visuals from the Power BI marketplace.
Experimenting with different visualizations helps you present data effectively.
Step 6: Learn DAX (Data Analysis Expressions)
DAX is a formula language used in Power BI to create calculated columns, measures, and custom calculations. Some key DAX functions include:
SUM() – Adds values in a column.
AVERAGE() – Calculates the average of a set of values.
IF() – Creates conditional calculations.
Mastering DAX enables you to perform advanced data analysis.
Step 7: Build and Publish Reports
Once you’ve created a report, learn how to:
Organize multiple pages in a dashboard.
Add filters and slicers for interactive analysis.
Publish reports to Power BI Service for sharing and collaboration.
Publishing reports makes them accessible to teams and decision-makers.
Step 8: Explore Power BI Service and Cloud Features
Power BI Service allows you to:
Schedule automatic data refreshes.
Share dashboards with team members.
Implement row-level security for restricted data access.
Learning cloud-based features enhances collaboration and security in Power BI.
Step 9: Join Power BI Communities
Engaging with the Power BI community can help you stay updated with new features and best practices. You can:
Follow the Microsoft Power BI blog for updates.
Participate in Power BI forums and LinkedIn groups.
Attend webinars and join Power BI user groups.
Networking with other Power BI users can provide valuable insights and learning opportunities.
Step 10: Get Certified and Keep Practicing
If you want to showcase your expertise, consider obtaining a Microsoft Power BI Certification (PL-300: Power BI Data Analyst). Certification enhances your resume and validates your skills.
To stay ahead, keep practicing by working on real-world datasets, building dashboards, and experimenting with advanced Power BI features. Continuous learning is the key to becoming a Power BI expert.
By following these steps, you can systematically learn Power BI and develop the skills needed to analyze and visualize data effectively. Happy learning!
0 notes
Text
MySQL in Data Science: A Powerful Tool for Managing and Analyzing Data

Data science relies on large-scale ability in information collection, storage, and analysis. Strong emphasis on advanced generation through machine learning and artificial intelligence disregards the fundamental steps involved in the process-data management. MySQL is a popular relational database management system that is used significantly in structured data organizations and management.
In this article, we will dive into the relevance of MySQL for data science and its features and applications. Furthermore, we shall explain why each aspiring data professional should master this. Whether one is looking for learning data science from scratch or searching for the best data analytics courses, one must understand the importance of mastering MySQL.
What is MySQL?
MySQL is an open source, RDBMS, which allows users to store and administer structured data in a very efficient manner. It executes operations such as inserting, updating, deleting, and retrieving data using SQL.
Since structured data is a must for data analysis, MySQL provides a well-structured way of managing large datasets before they are processed for insights. Many organizations use MySQL to store and retrieve structured data for making decisions.
Why is MySQL Important in Data Science?
Efficient Data Storage and Management
MySQL helps in storing vast amounts of structured data in an optimized manner, ensuring better accessibility and security.
Data Extraction and Preprocessing
Before data analysis, raw data must be cleaned and structured. MySQL allows data scientists to filter, sort, and process large datasets efficiently using SQL queries.
Integration with Data Science Tools
MySQL seamlessly integrates with Python, R, and other data science tools through connectors, enabling advanced data analysis and visualization.
Scalability for Large Datasets
Organizations dealing with massive amounts of data use MySQL to handle large-scale databases without compromising performance.
Security and Reliability
MySQL provides authentication, encryption, and access control, so that data is kept safe and secure for analysis purposes.
Key Features of MySQL for Data Science
SQL Queries for Data Manipulation
SQL makes it easy to interact with the database for any data scientist. Some of the most common SQL queries are as follows:
SELECT – Retrieves data
WHERE – Filters results
GROUP BY – Groups records
JOIN – Merges data from multiple tables
Indexing for Faster Queries
It uses indexes for speeding up data retrieval. Querying large data is efficient, using MySQL.
Stored Procedures and Functions
These facilitate automation of repetitive tasks. Efficiency in working with big data is enhanced by these techniques.
Data Aggregation
Support for functions SUM, COUNT, AVG, MIN, and MAX is there in MySQL to sum up the data prior to actual analysis.
Data Export and Integration
Data scientists can export MySQL data in formats like CSV, JSON, and Excel for further processing in Python or R.
Applications of MySQL in Data Science
Exploratory Data Analysis (EDA)
MySQL helps data scientists explore datasets, filter records, and detect trends before applying statistical or machine learning techniques.
Building Data Pipelines
Many organizations use MySQL in ETL (Extract, Transform, Load) processes to collect and structure data before analysis.
Customer Behavior Analysis
Businesses study customer purchase behavior and interaction data housed in MySQL to customize marketing campaigns.
Real-Time Analytics
MySQL can monitor real-time data in finance and e-commerce fields.
Data Warehousing
Businesses use MySQL databases to store historical data. This type of data can be used by firms to analyze long-term business trends and performance metrics.
How to Learn MySQL for Data Science
Mastering MySQL is the first step for anyone interested in data science. A step-by-step guide on how to get started is as follows:
SQL Basic Learning
Start with fundamental SQL commands and learn how to build, query, and manipulate databases.
Practice with Real Datasets
Work on open datasets and write SQL queries to extract meaningful insights.
Integrate MySQL with Python
Leverage Python libraries like Pandas and SQLAlchemy to connect with MySQL for seamless data analysis.
Work on Data Projects
Apply MySQL in projects like sales forecasting, customer segmentation, and trend analysis.
Explore the Best Data Analytics Courses
This means that you will be able to master MySQL as well as other advanced analytics concepts.
Conclusion
MySQL is a vital tool in data science because it offers effective data storage, management, and retrieval capabilities. Whether you're analyzing business performance or building predictive models, MySQL is a foundational skill. With the continued development of data science, mastering MySQL will give you a competitive advantage in handling structured datasets and extracting meaningful insights.
By adding MySQL to your skill set, you can unlock new opportunities in data-driven industries and take a significant step forward in your data science career.
0 notes
Text
Python Full Stack Development Course AI + IoT Integrated | TechEntry
Join TechEntry's No.1 Python Full Stack Developer Course in 2025. Learn Full Stack Development with Python and become the best Full Stack Python Developer. Master Python, AI, IoT, and build advanced applications.
Why Settle for Just Full Stack Development? Become an AI Full Stack Engineer!
Transform your development expertise with our AI-focused Full Stack Python course, where you'll master the integration of advanced machine learning algorithms with Python’s robust web frameworks to build intelligent, scalable applications from frontend to backend.
Kickstart Your Development Journey!
Frontend Development
React: Build Dynamic, Modern Web Experiences:
What is Web?
Markup with HTML & JSX
Flexbox, Grid & Responsiveness
Bootstrap Layouts & Components
Frontend UI Framework
Core JavaScript & Object Orientation
Async JS promises, async/await
DOM & Events
Event Bubbling & Delegation
Ajax, Axios & fetch API
Functional React Components
Props & State Management
Dynamic Component Styling
Functions as Props
Hooks in React: useState, useEffect
Material UI
Custom Hooks
Supplement: Redux & Redux Toolkit
Version Control: Git & Github
Angular: Master a Full-Featured Framework:
What is Web?
Markup with HTML & Angular Templates
Flexbox, Grid & Responsiveness
Angular Material Layouts & Components
Core JavaScript & TypeScript
Asynchronous Programming Promises, Observables, and RxJS
DOM Manipulation & Events
Event Binding & Event Bubbling
HTTP Client, Ajax, Axios & Fetch API
Angular Components
Input & Output Property Binding
Dynamic Component Styling
Services & Dependency Injection
Angular Directives (Structural & Attribute)
Routing & Navigation
Reactive Forms & Template-driven Forms
State Management with NgRx
Custom Pipes & Directives
Version Control: Git & GitHub
Backend
Python
Python Overview and Setup
Networking and HTTP Basics
REST API Overview
Setting Up a Python Environment (Virtual Environments, Pip)
Introduction to Django Framework
Django Project Setup and Configuration
Creating Basic HTTP Servers with Django
Django URL Routing and Views
Handling HTTP Requests and Responses
JSON Parsing and Form Handling
Using Django Templates for Rendering HTML
CRUD API Creation and RESTful Services with Django REST Framework
Models and Database Integration
Understanding SQL and NoSQL Database Concepts
CRUD Operations with Django ORM
Database Connection Setup in Django
Querying and Data Handling with Django ORM
User Authentication Basics in Django
Implementing JSON Web Tokens (JWT) for Security
Role-Based Access Control
Advanced API Concepts: Pagination, Filtering, and Sorting
Caching Techniques for Faster Response
Rate Limiting and Security Practices
Deployment of Django Applications
Best Practices for Django Development
Database
MongoDB (NoSQL)
Introduction to NoSQL and MongoDB
Understanding Collections and Documents
Basic CRUD Operations in MongoDB
MongoDB Query Language (MQL) Basics
Inserting, Finding, Updating, and Deleting Documents
Using Filters and Projections in Queries
Understanding Data Types in MongoDB
Indexing Basics in MongoDB
Setting Up a Simple MongoDB Database (e.g., MongoDB Atlas)
Connecting to MongoDB from a Simple Application
Basic Data Entry and Querying with MongoDB Compass
Data Modeling in MongoDB: Embedding vs. Referencing
Overview of Aggregation Framework in MongoDB
SQL
Introduction to SQL (Structured Query Language)
Basic CRUD Operations: Create, Read, Update, Delete
Understanding Tables, Rows, and Columns
Primary Keys and Unique Constraints
Simple SQL Queries: SELECT, WHERE, and ORDER BY
Filtering Data with Conditions
Using Aggregate Functions: COUNT, SUM, AVG
Grouping Data with GROUP BY
Basic Joins: Combining Tables (INNER JOIN)
Data Types in SQL (e.g., INT, VARCHAR, DATE)
Setting Up a Simple SQL Database (e.g., SQLite or MySQL)
Connecting to a SQL Database from a Simple Application
Basic Data Entry and Querying with a GUI Tool
Data Validation Basics
Overview of Transactions and ACID Properties
AI and IoT
Introduction to AI Concepts
Getting Started with Python for AI
Machine Learning Essentials with scikit-learn
Introduction to Deep Learning with TensorFlow and PyTorch
Practical AI Project Ideas
Introduction to IoT Fundamentals
Building IoT Solutions with Python
IoT Communication Protocols
Building IoT Applications and Dashboards
IoT Security Basics
TechEntry Highlights
In-Office Experience: Engage in a collaborative in-office environment (on-site) for hands-on learning and networking.
Learn from Software Engineers: Gain insights from experienced engineers actively working in the industry today.
Career Guidance: Receive tailored advice on career paths and job opportunities in tech.
Industry Trends: Explore the latest software development trends to stay ahead in your field.
1-on-1 Mentorship: Access personalized mentorship for project feedback and ongoing professional development.
Hands-On Projects: Work on real-world projects to apply your skills and build your portfolio.
What You Gain:
A deep understanding of Front-end React.js and Back-end Python.
Practical skills in AI tools and IoT integration.
The confidence to work on real-time solutions and prepare for high-paying jobs.
The skills that are in demand across the tech industry, ensuring you're not just employable but sought-after.
Frequently Asked Questions
Q: What is Python, and why should I learn it?
A: Python is a versatile, high-level programming language known for its readability and ease of learning. It's widely used in web development, data science, artificial intelligence, and more.
Q: What are the prerequisites for learning Angular?
A: A basic understanding of HTML, CSS, and JavaScript is recommended before learning Angular.
Q: Do I need any prior programming experience to learn Python?
A: No, Python is beginner-friendly and designed to be accessible to those with no prior programming experience.
Q: What is React, and why use it?
A: React is a JavaScript library developed by Facebook for building user interfaces, particularly for single-page applications. It offers reusable components, fast performance, and one-way data flow.
Q: What is Django, and why should I learn it?
A: Django is a high-level web framework for building web applications quickly and efficiently using Python. It includes many built-in features for web development, such as authentication and an admin interface.
Q: What is the virtual DOM in React?
A: The virtual DOM represents the real DOM in memory. React uses it to detect changes and update the real DOM as needed, improving UI performance.
Q: Do I need to know Python before learning Django?
A: Yes, a basic understanding of Python is essential before diving into Django.
Q: What are props in React?
A: Props in React are objects used to pass information to a component, allowing data to be shared and utilized within the component.
Q: Why should I learn Angular?
A: Angular is a powerful framework for building dynamic, single-page web applications. It enhances your ability to create scalable and maintainable web applications and is highly valued in the job market.
Q: What is the difference between class-based components and functional components with hooks in React?
A: Class-based components maintain state via instances, while functional components use hooks to manage state, making them more efficient and popular.
For more, visit our website:
https://techentry.in/courses/python-fullstack-developer-course
0 notes
Text
How to Assess a MySQL Developer’s Expertise Before Hiring

To hire the right database expert is the key to ensuring data security, efficiency, and performance. MySQL is a most widely used relational database management system that powers everything from small websites to large-scale applications. If you are considering MySQL developers for hire, to properly assess their skills before hiring serves as the key to developing a reliable and scalable database system.
As a SaaS business, where your databases handle high traffic and complex queries, choosing the right MySQL developer becomes even more vital. If you are wondering how to find top talent, what should be the attributes that need to be assessed, this article will serve all the answers.
Key Skills and Assessment Criteria for Hiring a Skilled MySQL Developer
Evaluate their database design skills
A proficient MySQL developer should be able to create effective database structures. Evaluate their knowledge in:
Indexing and normalisation to maximize efficiency.
Relational database design to ensure data integrity.
Optimizing queries to effectively handle big data sets.
Test their MySQL Query Writing abilities
For any MySQL developer, creating optimized queries is a fundamental requirement Prior to hiring a MySQL engineer, evaluate their capacity to:
Create intricate JOIN queries for effective data retrieval.
For automation, make use of functions, triggers, and stored processes.
To increase speed, optimize the SELECT, INSERT, UPDATE, and DELETE operations.
Check their understanding of top-rated security practices
Security is crucial, particularly for SaaS businesses that handle private client information. Enquire about:
Methods for preventing SQL injection.
Implementation of role-based access control (RBAC).
Backup plans and data encryption.
Assess their experience in database performance tuning
Continuous performance optimization is necessary for effective databases. When hiring MySQL engineers, consider their capacity to:
Utilize EXPLAIN plans for analyzing sluggish queries.
Optimizing database indexing techniques.
Handle load balancing and replication for systems with large traffic.
Consider their experience with cloud and scalability
As a SaaS business that uses cloud-based services, MySQL developers ought to be familiar with:
Cloud databases such as Azure Database for MySQL, Google Cloud SQL, or AWS RDS.
Methods for handling large-scale applications via sharding.
Disaster recovery and backup plans that are automated.
Summing Up
It's important to carefully assess a MySQL developer's knowledge of database design, query optimization, security, and scalability. Making sure a MySQL developer satisfies these requirements is crucial, regardless of whether you need to hire MySQL developers for a short-term project or a comprehensive database solution.
Hiring a knowledgeable MySQL specialist ensures improved data management, quicker performance, and long-term dependability for SaaS businesses.
0 notes
Text
SQL Techniques for Handling Large-Scale ETL Workflows
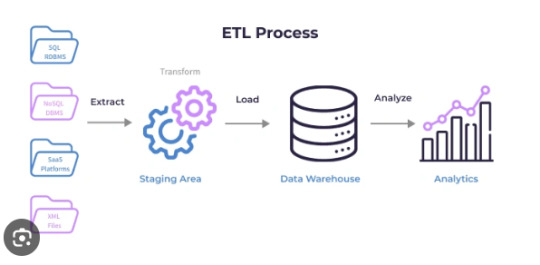
Managing and analyzing large datasets has become a critical task for modern organizations. Extract, Transform, Load (ETL) workflows are essential for moving and transforming data from multiple sources into a centralized repository, such as a data warehouse. When working with large-scale datasets, efficiency, scalability, and performance optimization are crucial. SQL, a powerful language for managing relational databases, is a core component of ETL workflows. This article explores SQL techniques for effectively handling large-scale Extract Transform Load SQL workflows.
Understanding the ETL Process
ETL workflows consist of three key stages:
Extract: Retrieving data from various sources, such as databases, APIs, or files.
Transform: Applying business logic to clean, validate, and format the data for analysis.
Load: Inserting or updating the processed data into a target database or data warehouse.
SQL is widely used in ETL processes for its ability to handle complex data transformations and interact with large datasets efficiently.
Challenges of Large-Scale ETL Workflows
Large-scale ETL workflows often deal with massive data volumes, multiple data sources, and intricate transformations. Key challenges include:
Performance Bottlenecks: Slow query execution due to large data volumes.
Data Quality Issues: Inconsistent or incomplete data requiring extensive cleaning.
Complex Transformations: Handling intricate logic across disparate datasets.
Scalability: Ensuring the workflow can handle increasing data volumes over time.
SQL Techniques for Large-Scale ETL Workflows
To address these challenges, the following SQL techniques can be employed:
1. Efficient Data Extraction
Partitioned Extraction: When extracting data from large tables, use SQL partitioning techniques to divide data into smaller chunks. For example, query data based on date ranges or specific IDs to minimize load on the source system.
Incremental Extraction: Retrieve only the newly added or updated records using timestamp columns or unique identifiers. This reduces the data volume and speeds up the process.
2. Optimized Data Transformation
Using Window Functions: SQL window functions like ROW_NUMBER, RANK, and SUM are efficient for complex aggregations and calculations. They eliminate the need for multiple joins and subqueries.
Temporary Tables and CTEs: Use Common Table Expressions (CTEs) and temporary tables to break down complex transformations into manageable steps. This improves readability and execution performance.
Avoiding Nested Queries: Replace deeply nested queries with joins or CTEs for better execution plans and faster processing.
3. Bulk Data Loading
Batch Inserts: Load data in batches instead of row-by-row to improve performance. SQL’s INSERT INTO or COPY commands can handle large data volumes efficiently.
Disable Indexes and Constraints Temporarily: When loading large datasets, temporarily disabling indexes and constraints can speed up the process. Re-enable them after the data is loaded.
4. Performance Optimization
Indexing: Create appropriate indexes on columns used in filtering and joining to speed up query execution.
Query Optimization: Use EXPLAIN or EXPLAIN PLAN statements to analyze and optimize SQL queries. This helps identify bottlenecks in query execution.
Partitioning: Partition large tables based on frequently queried columns, such as dates or categories. Partitioning allows SQL engines to process smaller data chunks efficiently.
5. Data Quality and Validation
Data Profiling: Use SQL queries to analyze data patterns, identify inconsistencies, and address quality issues before loading.
Validation Rules: Implement validation rules during the transformation stage to ensure data integrity. For example, use CASE statements or conditional logic to handle null values and invalid data.
6. Parallel Processing
Parallel Queries: Many modern SQL databases support parallel query execution, enabling faster data processing for large workloads.
Divide and Conquer: Divide large datasets into smaller subsets and process them in parallel using SQL scripts or database-specific tools.
Best Practices for Large-Scale ETL Workflows
Use Dedicated ETL Tools with SQL Integration: Tools like Apache Spark, Talend, and Informatica can handle complex ETL workflows while leveraging SQL for transformations.
Monitor and Optimize Performance: Regularly monitor query performance and optimize SQL scripts to handle growing data volumes.
Automate and Schedule ETL Processes: Use schedulers like cron jobs or workflow orchestration tools such as Apache Airflow to automate SQL-based ETL tasks.
Document and Version Control SQL Scripts: Maintain detailed documentation and version control for SQL scripts to ensure transparency and ease of debugging.
Advantages of SQL in Large-Scale ETL Workflows
Scalability: SQL is highly scalable, capable of handling petabytes of data in modern database systems.
Flexibility: Its ability to work with structured data and perform complex transformations makes it a preferred choice for ETL tasks.
Compatibility: SQL is compatible with most databases and data warehouses, ensuring seamless integration across platforms.
Conclusion
Handling large-scale Extract Transform Load SQL workflows requires a combination of efficient techniques, performance optimization, and adherence to best practices. By leveraging SQL’s powerful capabilities for data extraction, transformation, and loading, organizations can process massive datasets effectively while ensuring data quality and consistency.
As data volumes grow and workflows become more complex, adopting these SQL techniques will enable businesses to stay ahead, making informed decisions based on accurate and timely data. Whether you are managing enterprise-scale data or integrating multiple data sources, SQL remains an indispensable tool for building robust and scalable ETL pipelines.
0 notes
Text
SQL SUM Function: Master Aggregate Calculations Like a Pro
Dive into SQL SUM function fundamentals and advanced techniques. From basic syntax to complex aggregations, learn how to effectively analyze numerical data in databases with practical examples and expert guidance.
The SQL SUM Function Aggregate stands as a fundamental tool for performing aggregate calculations in databases. Moreover, this powerful function enables data analysts and developers to efficiently compute numerical totals across database columns. Furthermore, understanding how to leverage the SUM function effectively can significantly enhance your data analysis capabilities. Why Master the SQL…
0 notes