#tabular method
Explore tagged Tumblr posts
Visit Tumblr Blog
Explore Tumblr blogs with no restrictions, modern design and the best experience.
Last Seen Tumblr Blogs


Fun Fact
After the announcement of the deal with Yahoo!, there were 170K signatures of unhappy Tumblr users petitioning to prevent the sale in 2013.
Text
Take Your Business to the Next Level with Data Analysis & Tabular Methods
Data analytics are becoming increasingly popular in today's corporate world, and as advanced technology continues to streamline the report-creating process, more and more businesses are starting to realize the value of data analytic tools. Many companies now use their data analytical reports for competitive assessment, operational management insights, decision support requirements, financial statement analysis, market research activities and much more. Through proper utilization of these tools stakeholders can keep track of business performance easily within a few clicks! The purpose of this blog post is to provide an overview of how organizations can make full use of data analytic reporting for better visibility into operations as well as trends which impact them.

Data Analytic Reporting
Let’s start with a clear definition: What exactly are data and data analytics?
Data is the information we use every day, whether for work or personal use. It can be qualitative, meaning it can be good or bad, or quantitative, which is usually continuous and related to measurements.
There are two common ways of representing data: tabular, which provides a quick summary, and graphical, which is becoming more and more popular on the internet. Depending on the complexity involved, data analytics can be divided into four levels - reporting, analysis, predictive analytics, and optimization.
Reporting is concerned with what happened in the past. For example, if we take production as an example, we would be interested in knowing how much we produced yesterday, the day before, or the week before. Next, data analysis moves on to answering why something took place. If the throughput was higher one day or week, data analysis tries to identify the significant variables that affected output.
With predictive analytics, data analysis takes a step forward and answers what can happen if specific ranges of input are controlled. Finally, data optimization focuses on how to make something happen or improve a process that is already taking place. For instance, if we add another piece of equipment, how much performance can be achieved, and at what cost?
To sum up, data analytics is a journey of excellence, and the complexity of analysis increases as we move from reporting to data optimization. Understanding these levels will help us in deciding which data analytics solution will help us achieve our desired results.

Data reporting, or descriptive analytics, translates raw data into information that can identify key areas of strength and weakness within organizations. The focus is on input and output, typically using reports, KPIs, dashboard visuals, and statistics. However, data reporting has its limitations and may not provide deep insights into the information being presented.
For instance, we created a 12-month data reporting dashboard for a client which allowed them to quickly see the budget, forecast, and actual values for their throughput, grades, and recovery rates. Financial statements are another common example of data reporting, typically presented in a table format.

Moving on to data analysis, or diagnostics, the focus is on why certain outcomes occurred and the relationships between input and output variables. Root cause analysis techniques like Five Whys and Fishbone Diagrams are commonly used, along with advanced statistical software like Minitab and data mining tools. Techniques like correlation and regression are also used to measure linear relationships between two continuous variables, although it's important to note that correlation doesn't necessarily imply causation.
Overall, data reporting provides a quick summary of important metrics, while data analysis goes deeper into the why and how behind those metrics. Both are essential components of effective data management and can provide valuable insights for decision making.
Data analysis is a crucial process that enables us to make informed decisions based on factual evidence. It's important to use the right techniques such as ANOVA (analysis of variance), where your input independent variable is discrete and your output (result) is continuous variable. Here are some tips to help you get the most out of your ANOVA analysis:
1. Gather Sufficient and Relevant Data - Before conducting ANOVA analysis, it is important to gather sufficient and relevant data that represents true operating conditions. In the case of copper concentrate recovery, it is ideal to use a minimum of 12 months data in order to capture the effects of different seasons, crew, particle size, throughput, bit grades, and availability.
2. Check for Equal Variance - To ensure that ANOVA analysis produces accurate results, it is important to first check if the different categories of discrete data (crew, season) have equal variance. This can be done by observing if the different datasets overlap each other on a graph as well as checking if the p-value is above 0.05. If they have equal variance, it will ensure that the results produced will be statistically significant and accurate.
3. Perform ANOVA Analysis - Once the data has been collected and variance has been checked, we can begin ANOVA analysis. ANOVA, which stands for analysis of variance, is a statistical tool that determines if the different categories of discrete data have a significant effect on the continuous data, which in this case is copper concentrate recovery. ANOVA produces a graph that shows the average copper concentrate recovery for each category of discrete data, and it determines if the differences between them are statistically significant.
4. Interpret Results - After performing ANOVA analysis, it is important to interpret the results in order to gain insights and make informed decisions. From the ANOVA graph, we can see that copper recovery for fall is between 83 to 85, which is higher than spring's average between 79 to 83. Furthermore, the effect of winter on copper recovery is different compared to spring, which is statistically significant with a p-value less than 0.05. This information can be used to make informed decisions about resource allocation, production planning, and crew management, to maximize copper recovery and profitability.
5. Use Established Data - When conducting ANOVA analysis, it is essential to use established data that you understand well rather than using extensive data that might not provide accurate information following these tips, you can ensure that your ANOVA analysis is , reliable, and provides meaningful insights that can be used to make a positive impact on your business.
Conclusion
It is important to consider the residuals when analyzing data with ANOVA or any other analysis method. This blog post discussed descriptive data analysis which allows us to analyze what has happened and better answer why that happens. We also learned that, in correlation analysis, we can determine which input affects the output. Please look out for my next blogs where I will be discussing the predictive and prescriptive stages of data analytics. It was a pleasure discussing this topic and I hope you found this information insightful! Finally, if you have any further questions about this topic or any of our services, please do not hesitate to contact us! Thank you for your time.
0 notes
Text
Experimental helmet.
SERVE is incessantly and tirelessly seeking continuous improvement.
Not only are the organization and action improved, not only the operational and logistical capacity, not only the recruitment techniques.
Even the improvement of the recruits' performance and the shortening of assimilation times are the subject of research.
Some human subjects may show a greater need for reinforcement in the PURPOSE, in DEDICATION and the activation of the realignment protocols may involve the use of resources otherwise useful for carrying out daily operations within the HIVE and in the human world.
To shorten and optimize the times and methods of correcting every minimal onset of moments of misalignment SERVE-000 on the orders of THE VOICE has developed a special cybernetic helmet equipped with a respirator capable of carrying out a series of brainwashing cycles for a defined time that does not require fixed stations.
The plan is to install the helmet at the first failure episode and for times established based on the severity. Unlike the SEALED DRONES helmet, this one will have to be removed at the end of the process, after which each Drone will continue to complete its total assimilation.
The respirator, connected to the SERVE Neural Network, will introduce very high concentrations of rubberized pheromones into the human respiratory system, which will increase the level of arousal in a totalizing way, defeating any attempt at diversion, channeling the recruit into the totalizing circle OBEDIENCE-PLEASURE that is the basis of the existence of every SERVE Drone.
To begin the experimental phase of the device SERVE-000 chooses SERVE-764, SEALED DRONE and SERVE-530, unsealed.
First a SERVE-764 is temporarily removed the regulation helmet from SEALED DRONE, then both units are placed the experimental helmet.


The frequencies of the helmets are tuned to the different conditions of SEALED and UNSEALED, to allow monitoring any possible data variation. The new helmets pulsate as soon as they are activated. The respirator begins to filter the tabular dosages of rubberized pheromones. The Drones record and transmit the data constantly collected. For two solar cycles the devices will be in operation during the usual ordinary activities. At the end each unit will return to the previous state.


If the data collected are optimal the next phase will be the experimentation on the recruits. SERVE does not tire, does not exhaust, does not cease to pursue improvement. SERVE is INEVITABLE.
In this story: @rubberizer92, @serve-530
Thinking about joining SERVE? Do you seek freedom from chaos and disorder? Your place in the Hive awaits. Contact a recruiter drone for more details: @serve-016, @serve-302, or @serve-588.
30 notes
·
View notes
Text
How you can use python for data wrangling and analysis
Python is a powerful and versatile programming language that can be used for various purposes, such as web development, data science, machine learning, automation, and more. One of the most popular applications of Python is data analysis, which involves processing, cleaning, manipulating, and visualizing data to gain insights and make decisions.
In this article, we will introduce some of the basic concepts and techniques of data analysis using Python, focusing on the data wrangling and analysis process. Data wrangling is the process of transforming raw data into a more suitable format for analysis, while data analysis is the process of applying statistical methods and tools to explore, summarize, and interpret data.
To perform data wrangling and analysis with Python, we will use two of the most widely used libraries: Pandas and NumPy. Pandas is a library that provides high-performance data structures and operations for manipulating tabular data, such as Series and DataFrame. NumPy is a library that provides fast and efficient numerical computations on multidimensional arrays, such as ndarray.
We will also use some other libraries that are useful for data analysis, such as Matplotlib and Seaborn for data visualization, SciPy for scientific computing, and Scikit-learn for machine learning.
To follow along with this article, you will need to have Python 3.6 or higher installed on your computer, as well as the libraries mentioned above. You can install them using pip or conda commands. You will also need a code editor or an interactive environment, such as Jupyter Notebook or Google Colab.
Let’s get started with some examples of data wrangling and analysis with Python.
Example 1: Analyzing COVID-19 Data
In this example, we will use Python to analyze the COVID-19 data from the World Health Organization (WHO). The data contains the daily situation reports of confirmed cases and deaths by country from January 21, 2020 to October 23, 2023. You can download the data from here.
First, we need to import the libraries that we will use:import pandas as pd import numpy as np import matplotlib.pyplot as plt import seaborn as sns
Next, we need to load the data into a Pandas DataFrame:df = pd.read_csv('WHO-COVID-19-global-data.csv')
We can use the head() method to see the first five rows of the DataFrame:df.head()
Date_reportedCountry_codeCountryWHO_regionNew_casesCumulative_casesNew_deathsCumulative_deaths2020–01–21AFAfghanistanEMRO00002020–01–22AFAfghanistanEMRO00002020–01–23AFAfghanistanEMRO00002020–01–24AFAfghanistanEMRO00002020–01–25AFAfghanistanEMRO0000
We can use the info() method to see some basic information about the DataFrame, such as the number of rows and columns, the data types of each column, and the memory usage:df.info()
Output:
RangeIndex: 163800 entries, 0 to 163799 Data columns (total 8 columns): # Column Non-Null Count Dtype — — — — — — — — — — — — — — — 0 Date_reported 163800 non-null object 1 Country_code 162900 non-null object 2 Country 163800 non-null object 3 WHO_region 163800 non-null object 4 New_cases 163800 non-null int64 5 Cumulative_cases 163800 non-null int64 6 New_deaths 163800 non-null int64 7 Cumulative_deaths 163800 non-null int64 dtypes: int64(4), object(4) memory usage: 10.0+ MB “><class 'pandas.core.frame.DataFrame'> RangeIndex: 163800 entries, 0 to 163799 Data columns (total 8 columns): # Column Non-Null Count Dtype --- ------ -------------- ----- 0 Date_reported 163800 non-null object 1 Country_code 162900 non-null object 2 Country 163800 non-null object 3 WHO_region 163800 non-null object 4 New_cases 163800 non-null int64 5 Cumulative_cases 163800 non-null int64 6 New_deaths 163800 non-null int64 7 Cumulative_deaths 163800 non-null int64 dtypes: int64(4), object(4) memory usage: 10.0+ MB
We can see that there are some missing values in the Country_code column. We can use the isnull() method to check which rows have missing values:df[df.Country_code.isnull()]
Output:
Date_reportedCountry_codeCountryWHO_regionNew_casesCumulative_casesNew_deathsCumulative_deaths2020–01–21NaNInternational conveyance (Diamond Princess)WPRO00002020–01–22NaNInternational conveyance (Diamond Princess)WPRO0000……………………2023–10–22NaNInternational conveyance (Diamond Princess)WPRO07120132023–10–23NaNInternational conveyance (Diamond Princess)WPRO0712013
We can see that the missing values are from the rows that correspond to the International conveyance (Diamond Princess), which is a cruise ship that had a COVID-19 outbreak in early 2020. Since this is not a country, we can either drop these rows or assign them a unique code, such as ‘IC’. For simplicity, we will drop these rows using the dropna() method:df = df.dropna()
We can also check the data types of each column using the dtypes attribute:df.dtypes
Output:Date_reported object Country_code object Country object WHO_region object New_cases int64 Cumulative_cases int64 New_deaths int64 Cumulative_deaths int64 dtype: object
We can see that the Date_reported column is of type object, which means it is stored as a string. However, we want to work with dates as a datetime type, which allows us to perform date-related operations and calculations. We can use the to_datetime() function to convert the column to a datetime type:df.Date_reported = pd.to_datetime(df.Date_reported)
We can also use the describe() method to get some summary statistics of the numerical columns, such as the mean, standard deviation, minimum, maximum, and quartiles:df.describe()
Output:
New_casesCumulative_casesNew_deathsCumulative_deathscount162900.000000162900.000000162900.000000162900.000000mean1138.300062116955.14016023.4867892647.346237std6631.825489665728.383017137.25601215435.833525min-32952.000000–32952.000000–1918.000000–1918.00000025%-1.000000–1.000000–1.000000–1.00000050%-1.000000–1.000000–1.000000–1.00000075%-1.000000–1.000000–1.000000–1.000000max -1 -1 -1 -1
We can see that there are some negative values in the New_cases, Cumulative_cases, New_deaths, and Cumulative_deaths columns, which are likely due to data errors or corrections. We can use the replace() method to replace these values with zero:df = df.replace(-1,0)
Now that we have cleaned and prepared the data, we can start to analyze it and answer some questions, such as:
Which countries have the highest number of cumulative cases and deaths?
How has the pandemic evolved over time in different regions and countries?
What is the current situation of the pandemic in India?
To answer these questions, we will use some of the methods and attributes of Pandas DataFrame, such as:
groupby() : This method allows us to group the data by one or more columns and apply aggregation functions, such as sum, mean, count, etc., to each group.
sort_values() : This method allows us to sort the data by one or more
loc[] : This attribute allows us to select a subset of the data by labels or conditions.
plot() : This method allows us to create various types of plots from the data, such as line, bar, pie, scatter, etc.
If you want to learn Python from scratch must checkout e-Tuitions to learn Python online, They can teach you Python and other coding language also they have some of the best teachers for their students and most important thing you can also Book Free Demo for any class just goo and get your free demo.
#python#coding#programming#programming languages#python tips#python learning#python programming#python development
2 notes
·
View notes
Text
Brand Awareness vs Brand Identity
Brand awareness and brand identity are two crucial aspects of building a successful brand.
While they are related, they serve different purposes and contribute to different aspects of a brand's growth and success.
Let's dig deeper to provide you with more information.
Brand Awareness vs Brand Identity:
1. Brand Awareness:
Let's start with brand awareness.
Brand awareness refers to the extent to which consumers are familiar with a brand.
It is all about getting your brand name out there and making sure that your target audience knows who you are.
It's like being the popular student in school - everyone knows your name and what you stand for.
Brand awareness is important because it lays the foundation for brand recognition and recall.
When consumers are aware of your brand, they are more likely to recognize it when they see it, whether it's on a billboard, a social media post, or a product packaging.
This familiarity can lead to increased trust and credibility, as people tend to gravitate towards brands they are familiar with.
There are various strategies that businesses can use to build brand awareness.
One common approach is through advertising and marketing campaigns.
This can include traditional methods like TV commercials, print ads, and radio spots, as well as digital marketing techniques such as social media advertising, influencer partnerships, and content marketing.
“The power of word-of-mouth marketing cannot be underestimated in building brand awareness” – Semrush
2. Brand Identity:
On the other hand, brand identity is about the values, personality, and unique characteristics that define a brand.
It's like the DNA of your brand - it sets you apart from your competitors and shapes how people perceive you.
Brand identity encompasses elements like your brand's logo, color palette, typography, tone of voice, and messaging.
It's about creating a consistent and cohesive visual and verbal identity that resonates with your target audience.
A strong brand identity helps consumers connect with your brand on an emotional level and build a relationship with it.
Developing a strong brand identity involves understanding your target audience and what they value, as well as aligning your brand's values with theirs.
It also requires consistency across all touchpoints - from your website to your packaging to your customer service interactions.
“A potent brand identity acts as a lighthouse, steering consumers toward confident choices” – Level343
3. While brand awareness is about getting noticed, brand identity is about leaving a lasting impression. It's about creating a strong brand image that people can relate to and trust.
Both brand awareness and brand identity are important for the success of a business.
Brand awareness helps you get noticed in a crowded marketplace, while brand identity helps you differentiate yourself from competitors and build loyalty among consumers.
“Jeff Bezos, the founder of Amazon, has described a company’s branding as “what other people say about you when you’re not in the room.” In other words, your brand is people's feelings and emotions when hearing your company name” – HubSpot
Brand Awareness vs Brand Identity - Tabular Comparison:
Here's a tabular comparison of the most important aspects of brand awareness and brand identity:
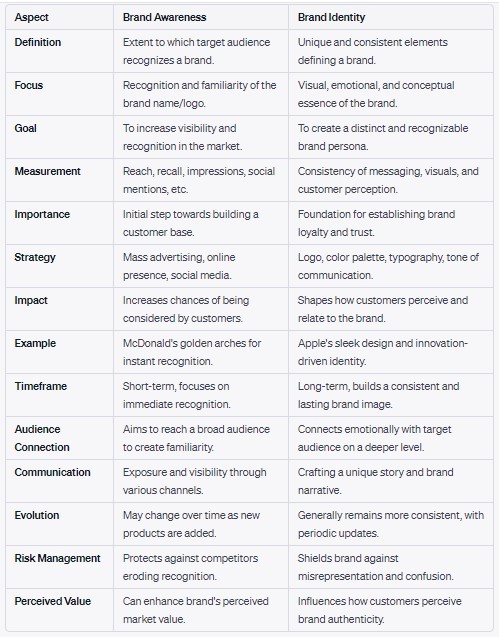
Image Content Source - Generated through ChatGPT
In conclusion, while brand awareness focuses on getting your brand known, brand identity focuses on creating a unique identity that resonates with your target audience.
Both are crucial components of building a successful brand, and businesses should invest in strategies that help them achieve both.
So go ahead, and put effort into building your brand's awareness and identity - it will pay off in the long run!
Here's related information that you may also find helpful - Why do companies brand their products?
2 notes
·
View notes
Text

Definition of Bar bending
It is the method of bending reinforcing steel into shapes which are important for reinforced concrete construction.
Definition of Bar bending schedule(BBS)
Bar bending schedule alias schedule of bars refers to a list of reinforcement bars, a specified RCC work item that is shown in a tabular form for a smooth view. This table sums up all the necessary particulars of bars ranging from diameter, shape of bending, length of each bent and straight portions, angles of bending, total length of each bar, and number of each type of bar. This information can be used for making an estimate of quantities.
It includes all the details essential for fabrication of steel like bar mark, bar type and size, number of units, length of a bar, shape code, distance between stirrups (column, plinth, beam) etc.
While generating bar schedules, it is important to take proper care about length. In case of bending, bar length will be raised at the bending positions.
Benefits of the Bar Schedule:
When bar bending schedule is applied along with reinforcement detailed drawing, it makes the quality of construction superior.
Once bar bending schedule is prepared, cutting and bending of reinforcement is performed at factory and shipped to job site. This improves quick implementation at site and minimizes construction time and cost as fewer workers are needed for bar bending. Bar bending also circumvents the wastage of steel reinforcement (5 to 10%) and thus project cost is saved significantly.
It offers the perfect estimation of reinforcement steel requirement for all the structural members which are applied to workout complete reinforcement requirement for whole project.
Read more
0 notes
Text
Without a doubt, one of the most fundamental expectations of any student within a university setting is the ability to read and comprehend empirical research. When a student enters into a graduate setting, he/she is expected to be able to extend a basic understanding of empirical research to a more concrete understanding of research as indicative of the ability to produce complex written work. The majority of this work involves the writing of literature reviews. The skills needed to produce complex literature reviews are often overlooked in many academic institutions. Granello (2001) proposes an innovative method for teaching the necessary skills through the utility of Bloom’s Taxonomy. In her article, she delineates that Bloom’s Taxonomy was one of the first models to conceptualize the skills necessary to produce competent graduate-level writing. Bloom’s taxonomy is essentially a six-level hierarchy of skills with each skill building on the prior and finally culminating with the ability to evaluate the pertinent literature. At the lowest level of the hierarchy is knowledge. Knowledge is operationally defined as the most fundamental ability to recall information and be able to understand the ideas expressed on a very abstract level. Comprehension is at the second level of the hierarchy and this is operationally defined as the ability to understand the meaning of the materials in question. This is followed by the application of the materials being read. Essentially this speaks directly to the ability to take very esoteric theoretical constructs and apply them to situations in such a manner as to produce concrete solutions or concrete ways in which the constructs could be looked at. At the fourth level of this hierarchy is the notion of analysis. Analysis refers to the ability to take the concepts or constructs introduced and break them down into their elemental components. In so doing, the student can see the relationship between the components and identify trends within the literature. After the analysis is done, synthesis occurs. Synthesis refers to the ability of a student to take the elemental parts derived during the analysis and put them back together in a new manner. This is done to add new insight into old subjects. Finally, at the top of the hierarchy is evaluation. The process of evaluation speaks directly to the ability of the student to assess the value of the material about the purpose of the research effort. Overall, this article provided a very in-depth approach to teaching students to write literature reviews utilizing Bloom’s taxonomy. This article provided a great deal of insight into the ability of students to write on an advanced level. It was most poignant in its delineation of the necessity of students in institutions of higher learning to develop writing skills. This article is extremely useful in that it proposed a step-by-step methodology that can be applied by professors and tutors to ascertain that students depart from their academic situations with a fundamental understanding of the components necessary in academic writing. Essentially, it began with fundamental cognitive tasks as the foundation of academic writing and then used those fundamental tasks as a building block on which more advanced cognitive skills could be built. The most admirable aspects of this article proved to be the fact that it was clear, concise, and succinct. Additionally, it contained a tabular summary of the application of Bloom’s Taxonomy. Reference Granello, D.H. (2001). Promoting cognitive complexity in graduate written work: Using Bloom’s Taxonomy as a pedagogical tool to improve literature reviews. Counselor Education & Supervision, 40, 292-307. Read the full article
0 notes
Text
Broadcasting Your Team's Pipeline

Regardless of whether your business provides products or services, finding a way to both evaluate and motivate your sales team can be challenging. Even those who have invested in modern CRM platforms such as Salesforce may still use legacy platforms and processes... by choice or without knowledge of a leading-edge solution which comes standard. If it's the latter, the good news is that making the change to an automated (and much more visually appealing) application is neither complex or time-consuming. In fact, it takes only the will to make the switch and after just days of migrating from classic-to-2.0 you may catch yourself saying 'how did we ever manage this the old way'. Taking Stock Be it a spreadsheet, cheat sheet or baking sheet, if you are consistent in your method when holding your recurring sales team sessions you're well ahead of the game as consistency is half the battle. Where the campaign is lost is in the vanishing hours of productivity during the preparation before your meetups or daily sprints in updating records or replacing last week's charts with the latest report. Though it may take effort in which to manually take stock and assemble your 'analytics', you've tackled the tough part. On the other hand, if your team sessions are in need of organization, initiating and agreeing on a process takes only a few steps and need only be tedious if you choose it to be. Salesforce, for example already has all of the tools you need by taking advantage of Custom Objects, Kanban and Agile/Scrum, allowing you to essentially run your meetings via the browser. Boring Repels Let's assume for the moment that your enterprise is using at least a basic process to run your sales targeting sessions. It might not be visually attractive, but it works. If you are presenting to your sales team audience the information within a tabular or spreadsheet-style, the message will be heard, but could be diluted within the numbers and letters. Worse still, if the source of the information presented in your spreadsheet is from an exported report from your CRM, you are creating more work with a mediocre experience.

So how do you get some rapid traction? Simple... use the data that you already have from your Opportunities IN Salesforce, not exported FROM Salesforce. You already know the power of reports and dashboards in your CRM... why not give 'em a prominent place at your next team's session? Productivity and Motivation Going further, some internal sales teams have used a 'display all' approach by using a sales Command Center dashboard and showcasing in on a monitor. This not only benefits the management, but also the individual sales hunters who may not always access their own performance metrics (which is as it should be as they are busy focusing on business). By broadcasting your team's goals and achievements, there is full transparency to how the group is performing, be it closed-won business or the month's pipeline. And it does't just need to include Sales, but also Service... basically any data element where you want to track performance, quotas / goals or segmentation of records is tailor-suited for this purpose. Should your team congregate in the same office, highlighting your dashboard on a monitor showcases the team's progress, and can also be a source of motivation. Utilizing this approach, you can also create contests, leaderboards and competitions tied to revenue goals which can be regularly updated on your large-screen monitor. When setting this up, be sure that your source account is always logged-in, which can be accomplished with a regular refresh cadence. This can be done by utilizing a browser extension such as Enhance Salesforce Dashboard which accomplishes this task, while auto-refreshing the dashboard ensuring that your data is regularly updated without the need to log back in each day (or hour). You have spent time and effort in educating your team on the use of Salesforce. Using this alternative in highlighting your analytics' live can give your team a sense of motivation and teamwork with less admin work.
__________________________________________________________________________________________ Title image by Newsweek | Analytics by BP Squadron
#sales#marketing#service#crm#salesforce#legacy#spreadsheet#analytics#dashboard#agile#kanban#scrum#sprint#motivation#command center#monitor#television#broadcast#pipeline
0 notes
Text
LLM-FE: Automated Feature Engineering for Tabular Data with
Excerpt from PDF: LLM-FE: Automated Feature Engineering for Tabular Data with LLMs as Evolutionary Optimizers Nikhil Abhyankar 1 Parshin Shojaee 1 Chandan K. Reddy 1 Abstract Automated feature engineering plays a critical role in improving predictive model performance for tabular learning tasks. Traditional automated feature engineering methods are limited by their reliance on pre-defined…
1 note
·
View note
Text
RYA Yachtmaster Ocean & Online Navigation and Passage Planning – Navathome

Navigate With Confidence
This comprehensive program covers vital topics such as celestial navigation, ocean passage planning, weather forecasting and meteorology. By mastering these essential skills, you'll gain the theoretical knowledge ready to navigate vast and unpredictable waters with confidence. Join our course and embark on a journey towards becoming a competent and capable Yachtmaster Ocean.
If you wish to take the RYA/MCA Yachtmaster Ocean oral exam, the RYA require the end of course theory assessment to be invigilated by an RYA Instructor at an RYA recognised Training Centre. Alternatively, the candidate can opt to take an extra paper during the oral exam. If you wish to take an invigilated assessment at the end of the theory course rather than take the extra paper during the oral exam, please let us know in advance so we can arrange for you to take the assessment at one of our participating centres. There will be a fee for the invigilation which is at the discretion of the chosen recognised Training Centre.
Upon successful completion, this course awards the RYA Yachtmaster Ocean Shorebased theory certificate.
RYA Coastal Skipper/Yachtmaster Offshore Course SYLLABUS
The earth and the celestial sphere:
Definition of observer’s zenith and position of a heavenly body in terms of latitude.
longitude, GHA and declination.
Right angle relationships, latitude and co-lat, declination and polar distance.
Relationship between GHA, longitude and LHA.
Tabulation of declination in nautical almanac.
Rate of increase of hour angle with time.
The PZX triangle:
The tabulated components of the triangle, LHA, co-lat and polar distance.
The calculable components, zenith distance and azimuth.
Relationship between zenith distance and altitude.
Introduction to the tabular method of solution in the Air Navigation Tables and the basic sight form.
The use of calculators for the solution of the PZX triangle.
The sextant:
Practical guide to the use and care of a sextant at sea.
Conversion of sextant altitude to true altitude.
Application of dip, index error and refraction.
Correction of side error, perpendicularity, index error and collimation error.
Measurement of time:
Forecasting time of meridian altitude.
Reduction of meridian altitude sights.
Sun, star and other sights:
Reduction and plotting of sun sights using.
Air Navigation Tables.
Awareness of the use of calculators for sight reduction.
The plotting of sun-run-sun meridian altitude.
Awareness of the reduction and plotting of sights obtained from stars, moon and planets.
Compass checking:
Use of amplitude and azimuth tables systems and/or calculator.
Satellite Navigation Systems:
Principles and limitations of use of all systems.
Great circle sailing:
Comparison of rhumb lines and great circles.
Verticies and composite tracks.
The computation of a series of rhumb lines approximating to a great circle by use of gnomonic and Mercator projections.
Meteorology:
General pressure distribution and prevailing winds over the oceans of the world.
Tropical revolving storms, seasonal occurrence and forecasting by observation.
Passage planning:
Publications available to assist with planning of long passages (routing charts, ocean passages of the world and other publications).
Preparation for ocean passage including survival equipment, victualling, water and fuel management, chafe protection, spares and maintenance.
Passage planning:
Publications available to assist with planning of long passages (routeing charts, ocean passages of the world and other publications).
Preparation for ocean passage including survival equipment, victualling, water and fuel management, chafe protection, spares and maintenance.
Passage making:
Navigational routine and Keeping watch.
Crew management.
Communications:
Satellite and terrestrial systems.
Weather information.
Address: 8a The Square Marina Bay Gibraltar GX111AA
Phone: +44 (0) 20 3286 1948
E-mail: [email protected]
0 notes
Text
Exporting data from R to different formats
Exporting data from R is a crucial step in sharing your analysis, reporting results, or saving processed data for future use. R provides a variety of functions and packages to export data into different formats, including CSV, Excel, JSON, and databases. This section will guide you through the process of exporting data from R into these various formats.
Exporting Data to CSV Files
CSV (Comma-Separated Values) files are one of the most common formats for sharing and storing tabular data. R makes it easy to export data frames to CSV using the write.csv() function.
Using write.csv():# Exporting a data frame to a CSV file write.csv(data, "path/to/save/your/file.csv", row.names = FALSE)
row.names = FALSE: This argument prevents row names from being written to the file, which is typically preferred when exporting data.
Customizing the Export:
You can further customize the CSV export by adjusting the delimiter, file encoding, and other options.# Exporting a data frame with custom settings write.csv(data, "path/to/save/your/file.csv", row.names = FALSE, sep = ";", fileEncoding = "UTF-8")
sep = ";": Changes the delimiter to a semicolon, which is common in some regions.
fileEncoding = "UTF-8": Ensures that the file is saved with UTF-8 encoding.
Exporting Data to Excel Files
Excel is widely used in business and academic environments. R provides several packages to export data to Excel, with openxlsx and writexl being popular options.
Using openxlsx:# Install and load the openxlsx package install.packages("openxlsx") library(openxlsx) # Exporting a data frame to an Excel file write.xlsx(data, "path/to/save/your/file.xlsx")
Using writexl:
The writexl package is another simple and efficient option for exporting data to Excel.# Install and load the writexl package install.packages("writexl") library(writexl) # Exporting a data frame to an Excel file write_xlsx(data, "path/to/save/your/file.xlsx")
Both of these methods allow for multiple sheets, formatting, and other advanced Excel features.
Exporting Data to JSON Files
JSON (JavaScript Object Notation) is a lightweight data-interchange format that is easy for both humans and machines to read and write. The jsonlite package in R makes exporting data to JSON straightforward.
Using jsonlite:# Install and load the jsonlite package install.packages("jsonlite") library(jsonlite) # Exporting a data frame to a JSON file write_json(data, "path/to/save/your/file.json")
Customizing the JSON Export:
You can customize the JSON structure by adjusting the pretty or auto_unbox arguments.# Exporting a data frame with custom settings write_json(data, "path/to/save/your/file.json", pretty = TRUE, auto_unbox = TRUE)
pretty = TRUE: Formats the JSON file with indentation for readability.
auto_unbox = TRUE: Converts single-element vectors to scalar JSON values.
Exporting Data to Databases
R can export data directly into databases, allowing for integration with larger data systems. The DBI package provides a standard interface for interacting with databases, and it works with specific database backend packages like RMySQL, RPostgreSQL, and RSQLite.
Using DBI with SQLite:# Install and load the DBI and RSQLite packages install.packages("DBI") install.packages("RSQLite") library(DBI) library(RSQLite) # Connecting to a SQLite database con <- dbConnect(RSQLite::SQLite(), dbname = "path/to/your/database.sqlite") # Exporting a data frame to a new table in the database dbWriteTable(con, "new_table_name", data) # Disconnecting from the database dbDisconnect(con)
This method can be adapted for other database systems by replacing RSQLite with the appropriate backend package (RMySQL, RPostgreSQL, etc.).
Exporting Data to Other Formats
In addition to CSV, Excel, JSON, and databases, R supports exporting data to various other formats such as:
Text Files: Using write.table() for general text-based formats.
SPSS, SAS, Stata: Using the haven package to export data to these formats.
HTML: Using the htmlTable package for exporting tables as HTML.
Example of Exporting to Text Files:# Exporting a data frame to a text file write.table(data, "path/to/save/your/file.txt", row.names = FALSE, sep = "\t")
sep = "\t": Specifies that the data should be tab-separated.
Best Practices for Data Export
File Naming: Use descriptive file names and include metadata such as dates or version numbers to keep track of different exports.
Check Data Integrity: Always verify that the exported data matches the original data, especially when working with non-CSV formats like JSON or Excel.
Automate Exports: For repeated tasks, consider writing functions or scripts to automate the export process, ensuring consistency and saving time.
Keep reading at strategic Leap
0 notes
Text
A Dataset for Monitoring Historical and Real-Time Air Quality to Support Pollution Prediction Models

Introduction
Datasets for Machine Learning Projects. The effectiveness of any machine learning initiative is significantly influenced by the quality and relevance of the dataset utilized for model training. Choosing an appropriate dataset is essential for attaining precise predictions and deriving valuable insights. This detailed guide will examine different categories of datasets, sources for obtaining them, methods for data preprocessing, and recommended practices for selecting datasets in machine learning endeavors.
Significance of Datasets in Machine Learning
A well-organized dataset is fundamental for the training of machine learning models. An appropriate dataset contributes to:
Enhancing model accuracy
Minimizing bias and overfitting
Improving generalization
Yielding valuable insights
Categories of Machine Learning Datasets
1. Structured vs. Unstructured Datasets
Structured Data: Data that is systematically arranged in a tabular format, consisting of rows and columns (e.g., spreadsheets, databases).
Unstructured Data: Data that lacks a predefined structure (e.g., images, videos, text, and audio).
2. Labeled vs. Unlabeled Datasets
Labeled Data: Data that includes distinct input-output pairs, utilized in supervised learning.
Unlabeled Data: Data that does not have labeled outcomes, employed in unsupervised learning.
3. Open vs. Proprietary Datasets
Open Datasets: Datasets that are publicly accessible for research and training purposes.
Proprietary Datasets: Exclusive datasets owned by businesses or organizations.
Notable Datasets for Machine Learning Initiatives

1. Image Datasets
MNIST: A dataset comprising handwritten digits intended for classification tasks.
CIFAR-10 & CIFAR-100: A collection of small images designed for classification purposes.
ImageNet: A comprehensive dataset utilized in deep learning applications.
COCO: A dataset focused on object detection and image segmentation.
2. Text Datasets
IMDb Reviews: A dataset used for sentiment analysis.
20 Newsgroups: A dataset for text classification.
SQuAD: A dataset designed for question-answering tasks.
3. Audio Datasets
LibriSpeech: An extensive collection of speech recordings.
Common Voice: An open-source dataset aimed at speech recognition.
4. Tabular Datasets
Titanic Dataset: A dataset used to predict survival outcomes on the Titanic.
Iris Dataset: A well-known dataset utilized for classification.
UCI Machine Learning Repository: A diverse collection of datasets addressing various machine learning challenges.
5. Healthcare Datasets
MIMIC-III: A dataset containing data from ICU patients.
COVID-19 Open Research Dataset: A dataset providing information for COVID-19 research.
Data Preprocessing and Cleaning
Raw datasets frequently contain issues such as missing values, duplicates, and extraneous noise. The preprocessing phase is essential for ensuring data integrity and preparing it for machine learning applications. Key steps involved include:
Addressing Missing Values: Implement imputation methods.
Eliminating Duplicates: Remove redundant entries.
Normalizing Data: Adjust the scale of numerical features.
Feature Engineering: Identify and extract pertinent features.
Guidelines for Selecting a Dataset
Relevance: Opt for datasets that align with the specific problem being addressed.
Size and Quality: Confirm that the dataset is sufficiently large and diverse.
Elimination of Bias: Steer clear of datasets that exhibit inherent biases.
Data Privacy: Utilize datasets that comply with legal standards.
Conclusion
The selection of an appropriate dataset is vital for the development of effective machine learning models. Whether the focus is on image recognition, natural language processing, or predictive analytics, the identification and preprocessing of the right dataset are fundamental Globose Technology Solutions achieving success. By utilizing open datasets and adhering to best practices, data scientists can enhance model performance and generate valuable insights.
0 notes
Text

This construction video provides detailed information on slab reinforcement that is created with bar bending schedule (BBS).
Slab reinforcement stands for the method that is undertaken to bend reinforcing steel and transform into shapes necessary for building up reinforced concrete structure.
Bar bending schedule (aka schedule of bars) belongs to a list of reinforcement bars, a specified RCC work item. It is demonstrated in a tabular form for smooth graphical reference.
Read more
1 note
·
View note
Text
Introduction to data manipulation using Pandas

Introduction to Data Manipulation Using Pandas Data manipulation is a crucial step in the data analysis process, enabling you to prepare, clean, and transform raw data into a structured format ready for analysis.
Pandas, a popular Python library, simplifies these tasks with its intuitive and powerful tools for handling data efficiently.
At its core, Pandas introduces two primary data structures:
Series and DataFrame.
A Series represents a one-dimensional labeled array, ideal for handling a single column of data.
A DataFrame, on the other hand, is a two-dimensional labeled data structure resembling a table, making it perfect for working with tabular datasets.
These structures allow seamless operations like filtering rows, adding columns, reshaping data, and more.
Pandas excels in data cleaning, aggregation, and transformation.
Whether you’re dealing with missing values, merging datasets, or performing group-based computations, Pandas offers a comprehensive suite of methods to streamline your workflow.
Additionally, its compatibility with other libraries like NumPy and Matplotlib makes it a cornerstone of the Python data science ecosystem. In this blog, we’ll explore the essential concepts of data manipulation using Pandas, providing practical examples and insights to help you handle data effectively.
Whether you’re a beginner or looking to refine your skills, this guide will set the foundation for your data manipulation journey.
WEBSITE: https://www.ficusoft.in/python-training-in-chennai/
0 notes
Text
How to Prepare for MAT Exam at Home: Expert Tips for Success
Preparing for the MAT at home may be an affordable and rewarding experience. You may study for the exam at your own speed and time, without anyone bugging you. While it may seem unnerving at first, it is quite achievable. With the correct tactics, tools, and perspective, you may successfully clear the exam without having to enter a coaching center. Here's a complete guide on how to prepare for MAT exam at home to aid you along the way.

Expert Tips to Prepare for MAT Exam at Home
Preparing for the MAT test entails preparing for each of its five sections:
Language Comprehension
Mathematical Skills
Data Analysis & Sufficiency
Intelligence & Critical Reasoning
Economic & Business Environment
To prepare thoroughly for the MAT exam, it is critical to develop a strategy that covers each of the five areas without cramming and to provide adequate time for practicing and reviewing. All of this is feasible to do at home. Here are a few tips on how to properly prepare for MAT at home.
Start Early
To get enough time to practice and review, start early. Have at least 5-6 months of practice before the exam. Starting early will help you to understand the syllabus in a better way before starting to prepare for the exam.
Understand the MAT Exam Pattern and Syllabus
Before diving deeper into the preparation, get a clear understanding of the MAt syllabus, which includes 5 sections:
Language Comprehension
Mathematical Skills
Data Analysis & Sufficiency
Intelligence & Critical Reasoning
Economic & Business Environment
Here is a tabular presentation of the five sections of the MAT syllabus and the key areas to focus on:

To prepare efficiently, create a schedule ensuring a complete covering of each section while giving enough time for practice and review without cramming. Fortunately, all of this can be done from home with the correct approach.
Focus Sectionally
The most efficient MAT test preparation tip is to go over all five sections and understand the pertinent topics in each. The table above illustrates the major topics to consider when preparing for the MAT.
Here is a more detailed list of tips to prepare for each section of the MAY syllabus:
Language Comprehension
The most straightforward way to tackle this section is to initially acquire a firm proficiency in the English language. This might be achieved by reading books, newspapers, blogs, magazines, and journals, and viewing English movies or web series.
The pertinent topics that you must focus on in this section include the following:
Grammar
Word Analogies
Vocabulary (Especially antonyms and synonyms)
Sentence correction
Rearranging sentences
Para Jumbles
Reading Comprehension
Sentence Completion, etc.
Mathematical Skills
This is a concept-driven segment in which problems must be solved using basic concepts and formulae. This section especially examines applicants' understanding of basics and their ability to apply them effectively. The best method for dealing with this section is to engage in frequent mathematical practice and problem-solving. Practicing mental math can also help to improve computation speed.
In this part, focus on the following topics:
Basic arithmetic
Algebra
Number system
Geometry &mensuration
Modern maths
Percentage, profit & loss, mixtures
Averages, ratios, interest
Time & work
Time, speed & distance, etc.
Data Analysis & Sufficiency
This section should be handled methodically. To excel in this subject, you must establish a solid foundation for fundamental concepts and their practical applications. Taking mock tests will help you not only be thorough but also solidify the concepts in your mind. Mock tests can also help improve time management skills.
Focus on the following topics in this section:
Intelligence & Critical Reasoning
Economic & Business Environment
Graphs
Data sufficiency
Data comparison, etc.
Intelligence & Critical Reasoning
As the name suggests, this section focuses on critical thinking. The questions are likewise practice-intensive. Solving previous years' test papers and taking mock tests might help you prepare for this part to a large extent.
The topics to be addressed in this part are outlined below:
Identifying patterns in numerical sets
Relationships and Direction Sense
Coding and Decoding
Verbal Reasoning, etc.
Economic & Business Environment
This section of the MAT test assesses a candidate's knowledge and grasp of current economic trends, corporate ideas, and global events. As a result, the best approach to practice it is to read books, news articles, newspapers, watch educational films, and so on.
Topics to be covered in this section include the following:
Current events and happenings
Economic terms and theories
Sports events
GK
World economics
Corporate news, etc.
Focus on the Weak Areas
Remember that every incorrect answer on the MAT exam will result in a negative grade. So you can't afford to answer questions incorrectly. Identify the areas where you stumble the most and devote additional effort to them. For instance, if mathematical skills appear onerous, devote extra time to learning formulae, theorems, and shortcuts, as well as their applications in problem-solving.
Maintain a Timetable
Creating and sticking to a timetable is critical. The simplest technique to design a timetable is to divide your month into reasonable time intervals (weekly and daily) and allot time to each segment. Make sure the schedule is flexible enough to accept modifications as needed. Also, do not forget to include mock tests in the timetable.
Ace Time Management and Accuracy
The MAT exam is timed, therefore efficient time management is crucial to complete all of the questions within the allotted time. One of the most effective techniques to improve time management is to practice timed mock tests at home. Use a stopwatch to set a fixed duration for the test and begin. Divide your allowed time into three segments:
Writing the exam.
Reviewing answers
Correcting errors and answering any unanswered queries.
In addition to controlling time, it is critical to prioritize accuracy. Taking practice tests regularly could assist you in enhancing your ability to answer questions accurately within the time limit.
Practice Mocks
To efficiently practice MAT mock tests at home, take an organized and systematic approach.
Schedule a time to take the exam.
Create a test-like setting devoid of disturbances.
Use a timer to rigorously follow the exam's time limitation.
Divide the allocated time into three parts: test writing, examining answers, evaluating errors, and addressing any unanswered questions.
This methodical practice helps boost time management skills, increase accuracy, and identify weak areas for future growth. Consistent, timed mock test preparation ensures exam preparedness.
Practice and Review
Continue to practice the MAT lessons consistently, and do a personal SWOT analysis to assess your progress at each step. Pay extra attention to strengthening your weakest portions with dedicated practice.
Maintain a Healthy Body and Mind
Taking care of your health is critical when studying for the MAT exam, since the preparation phase may be both physically and psychologically taxing. During this period, you may feel stressed, anxious, or overwhelmed. To stay balanced and perform well on exam day, consider the following suggestions:
Incorporate meditation and awareness into your daily practice.
Practice yoga or mild physical activities.
Maintain a healthful diet.
Take regular pauses to rejuvenate.
Go for jogs or natural hikes.
Ensure that you receive at least 7 hours of sleep every night.
Maintain hydration by consuming plenty of water.
Prioritizing your well-being allows you to efficiently handle stress while maintaining attention.
Key Takeaways
This was our take on expert tips for successfully studying for the MAT exam at home. While the process may appear onerous, using the appropriate strategy can make it more manageable and practical. We hope that the guidance provided above will help you successfully prepare for the exam. Stay optimistic and steady, and success will undoubtedly come. Best of luck!
#mat exam#mat exam preparation#mat exam preparation at home#exam preparation#exam preparation tips#exam preparation at home#tumblr#blog#article#exam tips#exam
1 note
·
View note
Text

Water resistance testing is a critical method for evaluating the durability and performance of materials and products in corrosive environments. The salt spray test, specifically, is one of the most widely used tests to assess the corrosion resistance of materials exposed to saline atmospheres. This article focuses on the applications of salt spray corrosion testing with the LISUN JL-X IP Waterproof Test Equipments, detailing the testing procedure, evaluation criteria, and providing relevant data in a tabular format. The purpose of this paper is to understand how water resistance tests in such environments can predict the longevity and reliability of industrial products. 1. Introduction Water resistance test methods are crucial for products that face exposure to water and moisture over extended periods. Among these methods, the salt spray test plays a vital role in simulating real-world conditions where water and salt interact to accelerate the corrosion process. The LISUN JL-X IP Waterproof Test Equipments offers an advanced platform for conducting water resistance and salt spray tests, adhering to international standards for environmental testing. This paper explores the importance of water resistance tests, the specifics of the salt spray corrosion test, and the operation of the LISUN JL-X IP Waterproof Test Equipments. By focusing on its capabilities and features, this article aims to provide a comprehensive understanding of how water resistance tests are conducted and evaluated. 2. Water Resistance Test Overview A water resistance test simulates conditions where products, particularly electrical and electronic equipment, may be exposed to moisture, rain, or high-humidity environments. The test is designed to assess the protective features of these products against water ingress, preventing malfunction or degradation. Several standards, including IP (Ingress Protection) ratings, are used to classify the water resistance capabilities of products. A key aspect of IP testing involves exposure to different intensities of water spray, immersion, and salt-laden moisture, making the LISUN JL-X IP Waterproof Test Equipments ideal for conducting these assessments. Table 1: Common IP Ratings and Water Resistance Test Descriptions IP Rating Water Resistance Test Description IPX1 Vertically dripping water, 1mm/min for 10 minutes IPX2 Dripping water at a 15° angle, 3mm/min for 10 minutes IPX3 Spraying water at up to 60° from the vertical for 10 minutes IPX4 Splashing water from any direction for 5 minutes IPX5 Water jets from a 6.3mm nozzle for at least 3 minutes IPX6 Powerful water jets from a 12.5mm nozzle for at least 3 minutes IPX7 Immersion in water up to 1m for 30 minutes IPX8 Continuous immersion beyond 1m, tested per manufacturer specs 3. Salt Spray Test for Corrosion Resistance The salt spray test (also known as the salt fog test) is used to assess the corrosion resistance of products by exposing them to a controlled saline mist. The combination of salt and moisture accelerates the corrosion process, providing a quick evaluation of how well the product will stand up to harsh environments. In the context of water resistance tests, the salt spray test is used to evaluate the protective coatings and materials that prevent water and moisture from causing deterioration. It also tests for potential failures in water-sealed compartments of electronic devices, electrical enclosures, and metal surfaces. Waterproof test Equipment JL-X 4. The LISUN JL-X IP Waterproof Test Equipments The LISUN JL-X IP Waterproof Test Equipments is designed to meet a range of IP testing requirements, providing flexibility for performing water resistance tests, including salt spray corrosion testing. This equipment complies with multiple international standards, ensuring accurate and reliable results. Key Features: • Supports IPX1 to IPX8 testing • Fully programmable control system for precise test configurations • Capable of simulating high-pressure water jets and submersion • Temperature and humidity controls for enhanced testing environments • Integrated salt spray functionality for corrosion tests Table 2: Technical Specifications of LISUN JL-X IP Waterproof Test Equipments Parameter Specification Test Ratings IPX1 – IPX8 Spray Nozzle 6.3mm and 12.5mm Water Pressure Adjustable from 80 kPa to 120 kPa Temperature Range 40°C to +80°C Humidity Range 10% to 98% RH Salt Spray Concentration 5% NaCl solution Control System Programmable touch screen interface Compliance Standards IEC60529, IEC60598, IEC60335, IEC 60034 5. Test Procedure and Methodology 5.1 Sample Preparation For water resistance and salt spray tests, the samples (typically electrical enclosures, coated materials, or assembled products) are prepared by cleaning and inspecting them for any existing defects. The samples are placed in the LISUN JL-X IP Waterproof Test Equipment and exposed to predefined testing conditions. 5.2 Test Setup Water Resistance Test The water resistance test simulates water ingress through spraying or submersion. For example, an IPX6 test involves spraying water jets at high pressure for a set period to ensure no leakage or functional failure occurs. Salt Spray Test The salt spray test involves spraying the samples with a 5% NaCl solution, creating a corrosive atmosphere. The samples are subjected to this condition for durations ranging from a few hours to several days, depending on the material and expected lifetime. 5.3 Evaluation Criteria After testing, the samples are inspected for any signs of corrosion, water ingress, and mechanical failure. The degree of corrosion is graded based on international standards such as ASTM B117. Table 3: Sample Test Results for Water Resistance and Salt Spray Tests Sample ID IP Rating Water Resistance Test Result Salt Spray Exposure Time Corrosion Observed Sample A IPX6 Passed 48 hours Mild surface rust Sample B IPX7 Passed 72 hours No corrosion observed Sample C IPX8 Passed 96 hours Severe rusting Sample D IPX5 Failed 24 hours Extensive corrosion 6. Importance of Water Resistance and Salt Spray Tests Conducting water resistance tests, especially in combination with salt spray corrosion tests, is essential for ensuring the durability and reliability of products in real-world conditions. Such tests are critical for industries like automotive, electronics, and lighting, where products must withstand harsh environments while maintaining performance. The LISUN JL-X IP Waterproof Test Equipments provides comprehensive testing solutions that help manufacturers improve product design and meet stringent industry standards. 7. Conclusion Water resistance tests, including salt spray corrosion testing, are vital for evaluating the longevity and performance of materials and products exposed to water and saline conditions. Using the advanced capabilities of the LISUN JL-X IP Waterproof Test Equipments, manufacturers can assess and improve the water resistance of their products while ensuring compliance with international IP rating standards. Through detailed testing procedures and proper evaluation criteria, the LISUN JL-X platform provides accurate, reliable, and repeatable test results, helping industries produce high-quality products with enhanced resistance to environmental factors. References IEC60529: Degrees of protection provided by enclosures (IP Code) ASTM B117: Standard Practice for Operating Salt Spray (Fog) Apparatus LISUN JL-X IP Waterproof Test Equipments Product Manual Read the full article
0 notes