#yes I block add on desktop but this doesn’t cover mobile
Text
No offense tumblr, but even without ad-free users should be able to hide potentially triggering material from advertisements pushed to their dashboards.
#tumblr#not dogs#yes I block add on desktop but this doesn’t cover mobile#users should NOT need work around to avoid stuff#literally just have an option that says ‘this isn’t for me’#that sends less of those ads to the dashboard#and I’m not even talking about my own personal triggers#but I have seen a TROUBLING amount of weight loss style ads on mobile lately#and I know the multitude of folks in my life this sort of stuff is difficult for#it’s un. hidable. without paying money#garbage straight garbage#how can users possible curate a dashboard that’s fun and safe for themselves when the ads are like this
32 notes
·
View notes
Text
How Much Data Is Missing from Analytics? And Other Analytics Black Holes
Posted by Tom.Capper
If you’ve ever compared two analytics implementations on the same site, or compared your analytics with what your business is reporting in sales, you’ve probably noticed that things don’t always match up. In this post, I’ll explain why data is missing from your web analytics platforms and how large the impact could be. Some of the issues I cover are actually quite easily addressed, and have a decent impact on traffic — there’s never been an easier way to hit your quarterly targets. ;)
I’m going to focus on GA (Google Analytics), as it's the most commonly used provider, but most on-page analytics platforms have the same issues. Platforms that rely on server logs do avoid some issues but are fairly rare, so I won’t cover them in any depth.
Side note: Our test setup (multiple trackers & customized GA)
On Distilled.net, we have a standard Google Analytics property running from an HTML tag in GTM (Google Tag Manager). In addition, for the last two years, I’ve been running three extra concurrent Google Analytics implementations, designed to measure discrepancies between different configurations.
(If you’re just interested in my findings, you can skip this section, but if you want to hear more about the methodology, continue reading. Similarly, don’t worry if you don’t understand some of the detail here — the results are easier to follow.)
Two of these extra implementations — one in Google Tag Manager and one on page — run locally hosted, renamed copies of the Google Analytics JavaScript file (e.g. www.distilled.net/static/js/au3.js, instead of www.google-analytics.com/analytics.js) to make them harder to spot for ad blockers. I also used renamed JavaScript functions (“tcap” and “Buffoon,” rather than the standard “ga”) and renamed trackers (“FredTheUnblockable” and “AlbertTheImmutable”) to avoid having duplicate trackers (which can often cause issues).
This was originally inspired by 2016-era best practice on how to get your Google Analytics setup past ad blockers. I can’t find the original article now, but you can see a very similar one from 2017 here.
Lastly, we have (“DianaTheIndefatigable”), which just has a renamed tracker, but uses the standard code otherwise and is implemented on-page. This is to complete the set of all combinations of modified and unmodified GTM and on-page trackers.
Two of Distilled’s modified on-page trackers, as seen on https://www.distilled.net/
Overall, this table summarizes our setups:
Tracker
Renamed function?
GTM or on-page?
Locally hosted JavaScript file?
Default
No
GTM HTML tag
No
FredTheUnblockable
Yes - “tcap”
GTM HTML tag
Yes
AlbertTheImmutable
Yes - “buffoon”
On page
Yes
DianaTheIndefatigable
No
On page
No
I tested their functionality in various browser/ad-block environments by watching for the pageviews appearing in browser developer tools:
Reason 1: Ad Blockers
Ad blockers, primarily as browser extensions, have been growing in popularity for some time now. Primarily this has been to do with users looking for better performance and UX on ad-laden sites, but in recent years an increased emphasis on privacy has also crept in, hence the possibility of analytics blocking.
Effect of ad blockers
Some ad blockers block web analytics platforms by default, others can be configured to do so. I tested Distilled’s site with Adblock Plus and uBlock Origin, two of the most popular ad-blocking desktop browser addons, but it’s worth noting that ad blockers are increasingly prevalent on smartphones, too.
Here’s how Distilled’s setups fared:
(All numbers shown are from April 2018)
Setup
Vs. Adblock
Vs. Adblock with “EasyPrivacy” enabled
Vs. uBlock Origin
GTM
Pass
Fail
Fail
On page
Pass
Fail
Fail
GTM + renamed script & function
Pass
Fail
Fail
On page + renamed script & function
Pass
Fail
Fail
Seems like those tweaked setups didn’t do much!
Lost data due to ad blockers: ~10%
Ad blocker usage can be in the 15–25% range depending on region, but many of these installs will be default setups of AdBlock Plus, which as we’ve seen above, does not block tracking. Estimates of AdBlock Plus’s market share among ad blockers vary from 50–70%, with more recent reports tending more towards the former. So, if we assume that at most 50% of installed ad blockers block analytics, that leaves your exposure at around 10%.
Reason 2: Browser “do not track”
This is another privacy motivated feature, this time of browsers themselves. You can enable it in the settings of most current browsers. It’s not compulsory for sites or platforms to obey the “do not track” request, but Firefox offers a stronger feature under the same set of options, which I decided to test as well.
Effect of “do not track”
Most browsers now offer the option to send a “Do not track” message. I tested the latest releases of Firefox & Chrome for Windows 10.
Setup
Chrome “do not track”
Firefox “do not track”
Firefox “tracking protection”
GTM
Pass
Pass
Fail
On page
Pass
Pass
Fail
GTM + renamed script & function
Pass
Pass
Fail
On page + renamed script & function
Pass
Pass
Fail
Again, it doesn’t seem that the tweaked setups are doing much work for us here.
Lost data due to “do not track”: <1%
Only Firefox Quantum’s “Tracking Protection,” introduced in February, had any effect on our trackers. Firefox has a 5% market share, but Tracking Protection is not enabled by default. The launch of this feature had no effect on the trend for Firefox traffic on Distilled.net.
Reason 3: Filters
It’s a bit of an obvious one, but filters you’ve set up in your analytics might intentionally or unintentionally reduce your reported traffic levels.
For example, a filter excluding certain niche screen resolutions that you believe to be mostly bots, or internal traffic, will obviously cause your setup to underreport slightly.
Lost data due to filters: ???
Impact is hard to estimate, as setup will obviously vary on a site-by site-basis. I do recommend having a duplicate, unfiltered “master” view in case you realize too late you’ve lost something you didn’t intend to.
Reason 4: GTM vs. on-page vs. misplaced on-page
Google Tag Manager has become an increasingly popular way of implementing analytics in recent years, due to its increased flexibility and the ease of making changes. However, I’ve long noticed that it can tend to underreport vs. on-page setups.
I was also curious about what would happen if you didn’t follow Google’s guidelines in setting up on-page code.
By combining my numbers with numbers from my colleague Dom Woodman’s site (you’re welcome for the link, Dom), which happens to use a Drupal analytics add-on as well as GTM, I was able to see the difference between Google Tag Manager and misplaced on-page code (right at the bottom of the <body> tag) I then weighted this against my own Google Tag Manager data to get an overall picture of all 5 setups.
Effect of GTM and misplaced on-page code
Traffic as a percentage of baseline (standard Google Tag Manager implementation):
Google Tag Manager
Modified & Google Tag Manager
On-Page Code In <head>
Modified & On-Page Code In <head>
On-Page Code Misplaced In <Body>
Chrome
100.00%
98.75%
100.77%
99.80%
94.75%
Safari
100.00%
99.42%
100.55%
102.08%
82.69%
Firefox
100.00%
99.71%
101.16%
101.45%
90.68%
Internet Explorer
100.00%
80.06%
112.31%
113.37%
77.18%
There are a few main takeaways here:
On-page code generally reports more traffic than GTM
Modified code is generally within a margin of error, apart from modified GTM code on Internet Explorer (see note below)
Misplaced analytics code will cost you up to a third of your traffic vs. properly implemented on-page code, depending on browser (!)
The customized setups, which are designed to get more traffic by evading ad blockers, are doing nothing of the sort.
It’s worth noting also that the customized implementations actually got less traffic than the standard ones. For the on-page code, this is within the margin of error, but for Google Tag Manager, there’s another reason — because I used unfiltered profiles for the comparison, there’s a lot of bot spam in the main profile, which primarily masquerades as Internet Explorer. Our main profile is by far the most spammed, and also acting as the baseline here, so the difference between on-page code and Google Tag Manager is probably somewhat larger than what I’m reporting.
I also split the data by mobile, out of curiosity:
Traffic as a percentage of baseline (standard Google Tag Manager implementation):
Google Tag Manager
Modified & Google Tag Manager
On-Page Code In <head>
Modified & On-Page Code In <head>
On-Page Code Misplaced In <Body>
Desktop
100.00%
98.31%
100.97%
100.89%
93.47%
Mobile
100.00%
97.00%
103.78%
100.42%
89.87%
Tablet
100.00%
97.68%
104.20%
102.43%
88.13%
The further takeaway here seems to be that mobile browsers, like Internet Explorer, can struggle with Google Tag Manager.
Lost data due to GTM: 1–5%
Google Tag Manager seems to cost you a varying amount depending on what make-up of browsers and devices use your site. On Distilled.net, the difference is around 1.7%; however, we have an unusually desktop-heavy and tech-savvy audience (not much Internet Explorer!). Depending on vertical, this could easily swell to the 5% range.
Lost data due to misplaced on-page code: ~10%
On Teflsearch.com, the impact of misplaced on-page code was around 7.5%, vs Google Tag Manager. Keeping in mind that Google Tag Manager itself underreports, the total loss could easily be in the 10% range.
Bonus round: Missing data from channels
I’ve focused above on areas where you might be missing data altogether. However, there are also lots of ways in which data can be misrepresented, or detail can be missing. I’ll cover these more briefly, but the main issues are dark traffic and attribution.
Dark traffic
Dark traffic is direct traffic that didn’t really come via direct — which is generally becoming more and more common. Typical causes are:
Untagged campaigns in email
Untagged campaigns in apps (especially Facebook, Twitter, etc.)
Misrepresented organic
Data sent from botched tracking implementations (which can also appear as self-referrals)
It’s also worth noting the trend towards genuinely direct traffic that would historically have been organic. For example, due to increasingly sophisticated browser autocompletes, cross-device history, and so on, people end up “typing” a URL that they’d have searched for historically.
Attribution
I’ve written about this in more detail here, but in general, a session in Google Analytics (and any other platform) is a fairly arbitrary construct — you might think it’s obvious how a group of hits should be grouped into one or more sessions, but in fact, the process relies on a number of fairly questionable assumptions. In particular, it’s worth noting that Google Analytics generally attributes direct traffic (including dark traffic) to the previous non-direct source, if one exists.
Discussion
I was quite surprised by some of my own findings when researching this post, but I’m sure I didn’t get everything. Can you think of any other ways in which data can end up missing from analytics?
Sign up for The Moz Top 10, a semimonthly mailer updating you on the top ten hottest pieces of SEO news, tips, and rad links uncovered by the Moz team. Think of it as your exclusive digest of stuff you don't have time to hunt down but want to read!
from The Moz Blog https://ift.tt/2skU6gW
via IFTTT
1 note
·
View note
Text
Taskade is The Only App You Need for Work-Life Productivity
Forget email drafts, notes apps and to-do list managers: Taskade does all that and more
Everything I need to keep my life running is stored online. Somewhere. I just can’t find it.
I’m talking about all the account numbers, meeting notes, to-do lists, contact information and column drafts I need to see every day. Plus the recipes I want to cook, wines I need to try, and YouTube videos I ought to watch. Some of that stuff lives in my email inbox, and some in Google Docs. Then there are my Pinterest boards, miscellaneous bookmarks and the Evernote account I can never organize coherently.
In theory, the internet makes it easier than ever to keep everything I need a few taps away. In reality, the internet has a way of fragmenting our lives. It’s like I wrote everything in a notebook and then got drunk, ripped out each page and hid them in different places around my house.
Taskade makes a great tool for simple to-do lists, and you can use photos, emojis and stock art to spruce them up.
Photo: David Pierce/The Wall Street Journal
Over the past few weeks, an app called Taskade has helped me turn chaos into order. Taskade combines many of the best features of Google Docs, Excel and Dropbox, along with lots of task-management and organizational tools. Taskade Labs Chief Executive Ivan Zhao describes the product as “the next generation of Microsoft Office,” which is a little hyperbolic and a lot ambitious. But it is the best life-organization tool I’ve tried.
Taskade combines the features of a note-taking app, a task-management app and a spreadsheet tool the way that Steve Jobs combined an iPod, a cellphone and a web browser into the iPhone: All these tools work together to create something more than its parts.
I should mention that Taskade is fairly expensive: It has a limited free tier and costs $8 a month for heavy use. Still, it might pay for itself in the apps it replaces, and I’ve found it easily worth the cost.
I now have a page with all my airline and hotel loyalty numbers in a bulleted list, above a photo of my dental insurance card and an embedded map with directions to my dentist’s office. I made databases with all the movies, books, TV shows, and YouTube videos I need to get to—each cell opens to a rich document with my notes and thoughts. Taskade has all the interviews, research material and outlines for my columns. I’m getting married soon and am staring down my nuptial to-do list every day.
One of Taskade’s newest features is a database tool, which you can view as a table, a calendar and more.
Photo: David Pierce/The Wall Street Journal
I used to need five separate apps to keep all this stuff straight. Now it’s all in Taskade, a few clicks or a simple search away.
Block by Block
It might be easier to think of Taskade is a super-simple website builder than a productivity app.
When you open a new page in the app, you’re really creating a blank grid onto which you can place and arrange just about anything. The app’s basic element is the block, which could be a paragraph of text, a bulleted list, a table, an image, a code snippet, a YouTube video, a PDF and more. You insert blocks with a tap or keyboard shortcut and then reorder and organize these to your heart’s content. You can easily change the nature of a block, too. For instance, you can select a bunch of text and turn it into a to-do list.
Taskade’s basic element is the block, which takes many forms: text, links, images, bookmarks and more.
Photo: David Pierce/The Wall Street Journal
Taskade is like chess: easy to learn, hard to master. The app itself looks fairly familiar, with a sidebar on the left and your open page on the right. It has a few aesthetic niceties, like the option to add a cover photo to the top of any page.
When you first open the app, though, it doesn’t do enough to help you understand everything it can do. Even after weeks of using Taskade daily, I’m only now figuring out the most efficient ways to do things while trying to avoid making terrible layout decisions. Do I really need a full-page photo inside my to-do list? My advice: Make heavy use of Taskade’s templates, because they help you layout pages and show what the app’s capable of.
There are native Taskade apps for Windows, Mac and iOS. Mr Zhao says an Android app should be available within weeks. The web app works beautifully on desktop and mobile, too, and it’s the exact same experience no matter which platform you’re using.
Taskade is very dependent on internet connectivity. It works offline only with pages you’ve opened recently while connected—which means all you can do is cross your fingers every time you open Taskade on a plane. On the upside, you can embed tweets and YouTube videos, even entire webpages, within a Taskade document.
Photo: David Pierce/The Wall Street Journal
Though I use Taskade to stay on top of my own work and life (and you should too), Taskade is designed for business teams. It offers collaborative editing, inline comments and useful tools for managing permissions and assigning tasks. If you use Slack, you can get alerts every time someone comments on or changes a Taskade document. It isn’t a substitute for Slack or Salesforce, but it can replace many of the tools so many companies use to store and share information.
One-stop Shop
Matt Galligan, the founder of the Picks and Shovels Co., a cryptocurrency services startup, offered a useful metaphor for Taskade. He says using the app is akin to shopping on Amazon. Before, “stores specialized,” he said, “and they did a good job.” Then Amazon came along and aggregated everything. It maybe wasn’t the best store for any single thing, but the one-stop convenience made it unbeatable.
That’s just it: Taskade isn’t as powerful a spreadsheet tool as Excel, and it doesn’t have some of the task-management features I want—when a task is due, I would like an alert, for instance. (Taskade says that’s coming.) Yet the app has helped me whittle the places I keep stuff down to just two. I can’t stop email from coming in; I can put everything else in Taskade.
Photo: David Pierce/The Wall Street Journal
There are lots left for the Taskade team to do, of course. In addition to task reminders, it’s also working on calendar sync, PowerPoint-style presentation features, a web clipper, better offline support and that Android app. It’s also planning to support services such as Zapier and If This Then That (IFTTT), which help move data between apps. But it already does more than any of its competitors.
For years, I’ve bounced around various note-taking apps and productivity tools, never quite happy. Evernote makes it easy to capture information, but I never liked the interface. Google Docs and Keep don’t offer enough features. Trello, Asana and other project-management software don’t work for note-taking.
Taskade fuses the best of each—and others—into a rare renaissance app, proficient in countless methods of creation and organization. I can’t put a price on the peace of mind that comes from an unfragmented life. Wait, yes I can: It’s eight bucks a month.
0 notes
Text
5+3+3 excellent concerns regarding your social media walls
Just where could I find Facebook wall photographes?
A cover image is the wider photo on top of your account, above your account picture. Like your account pic, wall pictures are publicised, which implies anybody seeing your profile will be able to view them. To add or change your background pic: From your News Feed, click on your name in the top left edge.
What should I put as my background photo on Facebook?
Below are some outstanding techniques you can use on your cover graphic to impress your followers & visitors.
1. Market yourself.
2. Demonstrate key features of your goods.
3. Develop an e-mail list.
4. Support your supporters' work.
5. Introduce a competition.
6. Detail your product.
7. Enhance your fans.
8. Feature your individuals.
9. Search something nice on TimeLineCovers.pro
Can I eliminate a background photo on Facebook?
1. Navigate to your Privacy Setups, here: https://www.facebook.com/settings?tab=privacy and Limit Past Posts.

2. Your existing wall graphic will still show up Public in your Cover Photos gallery, yet old Cover photos must get readied to Pals by the default.
Can you craft a video clip your wall graphic on Facebook?
Publishing a video clip as your Facebook wall picture is as easy as uploading a new photo.
Float your computer mouse over the cover photo on your Facebook page and also you'll find a cam icon appear.
Hit the Modification Cover symbol. You may pick a video as your wall image similarly you would certainly add a fresh cover image.
How do you upgrade your background photo on Facebook?
To add or transform your Web page's background image:
1. Go to your Page.
2. Float over your cover pic as well as click Include a Cover or Adjustment Cover in the top left.
3. Hit Upload Photo/Video to upload a graphic from your computer.
4. After choosing a image, hit the pic as well as drag it up or down to reposition it.
5. Click on Save.
Just how do you make a background pic?
It's simple to produce remarkable Facebook covers in TimeLineCovers.pro
1. Visit TimeLineCovers.pro site as well as select Produce food selection.
2. Pick from dozens of backgrounds.
3. Click on your favorite.
4. Select "Customize" below the cover. (Only on desktop computer.).
5. Repair your pictures, include sensational filters and also edit message.
6. Save and share.
Can you utilize a GIF as a Facebook cover photo?
Not only can you make use of pics, videos, and also GIFs in your Facebook background image, you can likewise post multiple images to produce an photo slideshow.
Do I need to stress over the "20% text" rule?
In short, no but still try to remain visual.
Back in 2013, Facebook got rid of any type of referral to the 20% policy on message in background images yet that doesn't indicate you ought to go wild with making use of text in your wall pic.
The previous guideline stated that only 20% of your wall picture could be message. Personally, I assumed that was way too restrictive for marketers, but the view behind the guideline was a good one.
If you're going to use message in your cover photo, maintain that text concise. Your photo will be far more interesting and also interesting.
Just how to use a prime focus and also colors that match your brand?
youtube
Think about your wall image as the part of your Web page that's "above the layer." If it's sidetracking or puzzling, individuals will certainly be more probable to click on off the Web page.
A number of the best Facebook background pics consist of a centerpiece to focus visitors' attention, together with a color design that aligns with the rest of their brand name. Remember, your social networks accounts are extensions of your company, and also need to give that perception to site visitors as soon as possible.
They also make use of negative white (i.e., vacant) area as an advantage to produce the subject, any copy on there, as well as other components unique to Facebook (like the CTA button on Facebook business Pages) attract attention even more.
Does it really worth to draw attention to the activity buttons on the bottom right?
Hell yes!
Depending upon your organisation, you can introduce a Page on Facebook with a distinct CTA key down right of your background photo. Take this switch right into factor to consider when making your cover picture, and also craft it clear in the pic that this is a Browse around this site visitor's following step.
How many customers accessibility Facebook from mobile?
Since 2019, publishes Statista, 96% of Facebook's user base accesses the social network from smart phones such as smart devices and also tablet computers. That's massive-- and it's precisely why it's so important to keep mobile phone customers top-of-mind when making your Facebook cover pic.
On mobile, a much bigger portion of your cover pic is blocked out due to the fact that the profile photo and also the Web page name are on top of the wall picture.
0 notes
Text
10+ exceptional suggestions regarding your Fb backgrounds
Where could I discover Facebook background photos?
A cover photo is the larger pic on top of your profile, above your account photo. Like your account pic, wall photographes are public, which indicates any person seeing your account will have the ability to see them. To include or transform your background photo: From your News Feed, click your name in the top left side.
What should I set as my wall photo on Facebook?
Here are some great methods you can use on your wall photograph to wow your fans & visitors.
1. Market your own self.
2. Demonstrate key benefits of your product.
3. Construct an e-mail directory.
4. Stimulate your followers' job.

5. Reveal a contest.
6. Summarize your service.
7. Encourage your fans.
8. Spotlight your clients.
9. Hunt something spectacular on TimeLineCovers.pro
Can I remove a cover picture on Facebook?
1. Visit your Personal Privacy Settings, right here: https://www.facebook.com/settings?tab=privacy as well as Limit Past Posts.
2. Your present wall image will certainly still appear Public in your Cover Photos gallery, however old Cover images should get readied to Buddies by the default.
Can you craft a video your background graphic on Facebook?
Publishing a video clip as your Facebook background picture is as basic as publishing a new image.
youtube
Float your mouse over the background picture on your Facebook web page as well as you'll see a video camera icon pop up.
Hit the Change Cover symbol. You can absolutely pick a video as your background picture the same way you 'd include a fresh background graphic.
Just how do you update your cover picture on Facebook?
To add or change your Web page's cover picture:
1. Visit your Page.
2. Float over your wall graphic as well as click Include a Cover or Modification Cover in the top left.
3. Click Upload Photo/Video to publish a image from your computer.
4. After choosing a pic, click the graphic and also drag it up or down to reposition it.
5. Click Save.
Exactly how do you make a wall pic?
It's very easy to create fantastic Facebook covers in TimeLineCovers.pro
1. Open TimeLineCovers.pro site and select Produce food selection.
2. Choose from thousands of covers.
3. Click your favorite.
4. Click "Customize" below the cover. (Just on desktop.).
5. Repair your images, include stunning filters and edit text.
6. Save and share.
Can you make use of a GIF as a Facebook cover photo?
Not just can you utilize graphics, videos, and also GIFs in your Facebook wall image, you can likewise post multiple pictures to create an picture slideshow.
Do I need to bother with the "20% text" guideline?
Basically, no but still attempt to stay aesthetic.
Back in 2013, Facebook eliminated any kind of recommendation to the 20% rule on text in cover pics but that doesn't indicate you ought to go wild with making use of text in your background photo.
The previous guideline said that only 20% of your background picture could be message. Personally, I believed that was way too restrictive for marketers, yet Hop over to this website the sentiment behind the policy was a good one.
If you're going to make use of text in your background graphic, keep that text concise. Your pic will certainly be far more insightful as well as interesting.
How to make use of a prime focus as well as shades that match your brand name?
Consider your cover pic as the section of your Page that's "above the fold." If it's distracting or confusing, people will certainly be more probable to click on off the Web page.
A lot of the most effective Facebook wall photos include a focal point to concentrate visitors' interest, together with a color scheme that lines up with the remainder of their brand name. Keep in mind, your social media sites accounts are extensions of your organisation, as well as need to give that perception to site visitors today.
They also utilize adverse white (i.e., vacant) room as an advantage to craft the topic, any type of copy on there, as well as other components special to Facebook (like the CTA button on Facebook business Pages) stand apart much more.
Does it really worth to accentuate the activity switches under right?
Hell yes!
Relying on your service, you can release a Page on Facebook with a one-of-a-kind CTA key down right of your cover pic. Take this button right into factor to consider when making your wall image, as well as make it clear in the graphic that this is a visitor's next action.
How many users accessibility Facebook from mobile phone?
Since 2019, states Statista, 96% of Facebook's user base accesses the social media from mobile devices just like mobile phones and tablet computers. That's big-- and it's exactly why it's so essential to maintain mobile phone individuals top-of-mind when making your Facebook wall graphic.
On mobile, a much bigger portion of your cover graphic is blocked out since the profile picture and also the Web page name are on top of the background pic.
0 notes
Photo
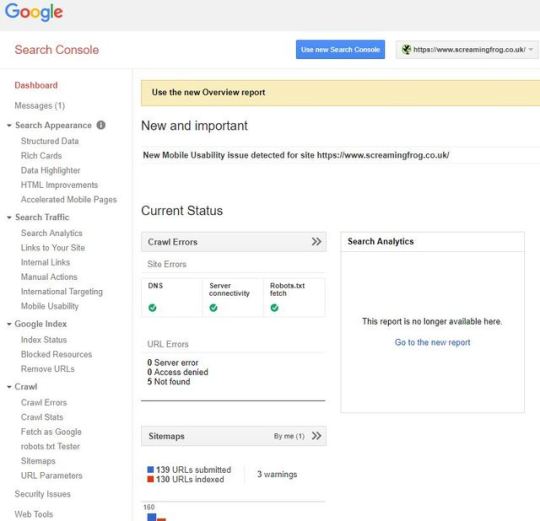
Since I started my journey in the world of SEO, the old Google Search Console (GSC) has been a mainstay of every campaign I’ve worked on. Together, we’ve dealt with some horrific JavaScript issues, tackled woeful hreflang implementation, and watched site performance reach its highest highs and lowest lows. Sadly, all good things must come to an end, and in Jan ’19 Google announced most of the old Search Console features would be shut down for good at the end of March. But it’s not all doom and gloom. As a successor, we now have an updated Google Search Console v2.0 to guide us into the modern web. This new console has a fresh coat of paint, is packed with new reports, gives us 16 months of data, and provides a live link straight into Google’s index — it’s all rather lovely stuff! Despite all this… I still can’t help looking longingly for a few of the old reports sitting neatly tiered on the left-hand side of the browser. While we can’t quite turn back time, using the trusty SEO Spider we can replicate a few of these reports to fill the void for tabs now deleted or yet to be transferred over. Before jumping in, I should note this post mostly covers reports deleted or not fully transferred or across. If you can’t find something here, chances are it’s already available on GSC 2.0. Structured Data The new GSC does indeed have some structured data auditing in the new ‘Enhancements’ tab. However, it only monitors a few select forms of structured data (like Products and Events markup etc…). While I’m sure Google intends to expand this to cover all supported features, it doesn’t quite meet the comprehensiveness of the old report. Well, hot on the heels of the v11.0 release for the SEO Spider, we now have bulk structured data auditing and validation built in. To activate, just head over to Configuration > Spider > Advanced > Enable the various structured data settings shown here: Once your crawl is complete, there are two areas to view structured data. The first of which is in the main Structured Data tab and various sub filters, here: Or, if you just want to examine one lone URL, click on it and open the Structured Data Details tab at the bottom of the tool: There are also two exportable reports found in the main report’s menu: the Validation Errors & Warnings Summary, and the Validation Errors and Warnings. For the full details, have a look at: https://www.screamingfrog.co.uk/seo-spider/user-guide/tabs/ HTML Improvements The HTML Improvements was a neat little tab Google used to show off errors with page titles, meta descriptions, and non-indexable content. Mainly it highlighted when they were missing, duplicated, short, long, or non-informative. Unlike many other reports, rather than transferring over to the new GSC it’s been completely removed. Despite this, it’s still an incredibly important aspect of page alignment, and in Google’s own words: “there are some really good tools that help you to crawl your website to extract titles & descriptions too.” Well — taking their hint, we can use the Spider and various tabs or filters for exactly that. Want page title improvements? Look no further than the filters on the Page Title tab: Or if you’re curious about your Meta Descriptions: Want to see if any pages reference non-indexable content? Just sort by the Indexability column on any tab/filter combo: International Targeting Ahh, hreflang… the stuff of nightmares for even the most skilled of SEO veterans. Despite this, correctly configuring a multi-region/language domain is crucial. It not only ensures each user is served the relevant version, but also helps avoid any larger site or content issues. Thankfully, we’ve had this handy Search Console tab to help report any issues or errors with implementation: Google hasn’t announced the removal of this report, and no doubt it will soon be viewable within the new GSC. However, if for any reason they don’t include it, or if it takes a while longer to migrate across, then look no further than the hreflang tab of the SEO Spider (once enabled in Configuration > Spider > hreflang). With detailed filters to explore every nook and cranny of hreflang implementation — no matter what issues your site faces, you’ll be able to make actionable recommendations to bridge the language gap. There’s also a handful of exportable hreflang reports from the top ‘Reports’ dropdown. While I won’t go through each tab here, I’d recommend you check out the following link which explains everything involving hreflang and the spider in much more detail: https://www.screamingfrog.co.uk/how-to-audit-hreflang/ Blocked Resources Another report that’s been axed — it was introduced as a way to keep track of any CSS or JavaScript files being blocked to search bots. Helping flag anything which might break the rendering, make the domain uncrawlable, or just straight up slow it down. While these issues have drastically decreased over the years, they’re still important to keep track of. Fortunately, after running a crawl as Googlebot (Configuration > User-Agent > Googlebot) we can find all blocked resources within the Response Codes tab of the Spider — or if you’re just looking for issues relating to rendering, have a look at the bottom Rendered Page details tab: Fetch as Google “But wait — you can just use the new URL inspect tool…”. Well, yes — you can indeed use the new URL inspect to get a live render straight from Googlebot. But I still have a few quarrels with this. For a start, you can only view your render from Googlebot mobile, while poor desktop is completely neglected. Secondly, the render is just a static above-the-fold screenshot, rather than the full-page scrollable view we used to get in Fetch As. While it’s not quite the same as a direct request from Google, we can still emulate this within the Spider’s JavaScript rendering feature. To enable JavaScript rendering head over to Configuration > Spider > Rendering and switch the drop down to JavaScript. Once your crawl is complete, highlight a URL and head over to the Rendered Page tab towards the bottom. Here you can view (or export) a screenshot of your rendered page, alongside a list showing all the resources needed: If you want to mimic Google as much as possible, try switching the User-Agent to Googlebot or Googlebot mobile (Configuration > User-Agent). This will make the Spider spoof a request as if it were Google making it. It’s also worth mentioning that Googlebot renders JavaScript based on v41 of Chrome, whereas the Spider uses the updated v64 of Chromium. While there aren’t many massive differences between the two, there may be some discrepancies. As a bonus, if you still want a desktop render direct from Google (or don’t have access to Search Console of a domain), the PageSpeed Insights tool still produces a static desktop image as a representation of how Googlebot is rendering a page. It’s not the most high-res or detailed image but will get the job done! Robots.txt tester Another tab I’m hopeful Google will eventually migrate over — testing your robots before submitting is crucial to avoid disallowing or blocking half your site to search engines. If for any reason they don’t happen to transfer this across to the new GSC, you can easily test any robot’s configuration directly within the SEO Spider (Configuration > Robots.txt > Custom). This window will allow you to either import a live robots.txt file or make your own custom one. You can test if an individual URL is blocked by entering it into the search at the bottom. Alternatively, run a crawl of your site and the spider will obey the custom crawl behaviour. For a much more in-depth guide on all the robots.txt capabilities of the SEO Spider, look here: https://www.screamingfrog.co.uk/robots-txt-tester/ URL Parameters An extremely useful tab — the URL Parameters helps to highlight all of the various parameter queries Google found on its journey through your site. This is particularly useful when examining the crawl efficiency or dealing with faceted navigations. Currently, there’s no way of replicating this report within the Spider, but we are able to get a similar sample from a crawl and some Excel tinkering. Just follow these steps or download the macro (linked below) – 1. Run a crawl of the domain, export the internal HTML tab 2. Cut & Paste the URL list into Column A of a fresh Excel sheet 3. Highlight Column A > Data > Text-to-Columns > Delimited > Other: ? > Finish 4. Highlight Column B > Data > Text-to-Columns > Delimited > Other: & > Finish 5. Highlight Column A > Right-click > Delete 6. Home > Editing > Find & Select > Go to Special > Blanks > OK 7. With these highlighted > Home > Cells > Delete 8. CTRL+A to highlight everything > Find & Replace > Replace: =* with nothing 9. Stack all columns into one & add a heading of ‘Parameter’ 10. Highlight this master column > Insert > Pivot Table > Recommended > Count of Parameter To save some time, I’ve made an Excel macro to do this all for you, which you can download here. Just download the spreadsheet > click Enable Content & Enable Editing then follow the instructions. If everything’s done correctly, you should end up with a new table similar to this: It’s worth noting there will be some discrepancies between this and Google’s own URL report. This boils down to the fundamental differences between the Spider & Googlebot, most of which is explained in much greater detail here: https://www.screamingfrog.co.uk/seo-spider/faq/ The King Is Dead, Long Live the King! Well, that’s all for now — hopefully you find some of these reports useful. If you want a full list of our other how-to guides, take a look through our user guide & FAQ pages. Alternatively, if you have any other suggestions and alternatives to the retired Google system, I’d love to hear about them in the comments below. As a side note: for many of these reports, you can also combine them with the Scheduling feature to keep them running on a regular basis. Or, if you’d like some automatic reporting, take a quick look at setting this up in the Crawl Reporting in Google Data Studio of my previous post. The post Reviving Retired Search Console Reports appeared first on Screaming Frog.
#structured-data#why-does-the-number-of-urls-crawled-not-match-the-number-of-results-indexed-in-google-or-errors-reported-within-google-webmaster-tools
0 notes
Link
via Screaming Frog
Since I started my journey in the world of SEO, the old Google Search Console (GSC) has been a mainstay of every campaign I’ve worked on. Together, we’ve dealt with some horrific JavaScript issues, tackled woeful hreflang implementation, and watched site performance reach its highest highs and lowest lows.
Sadly, all good things must come to an end, and in Jan ’19 Google announced most of the old Search Console features would be shut down for good at the end of March.
But it’s not all doom and gloom. As a successor, we now have an updated Google Search Console v2.0 to guide us into the modern web. This new console has a fresh coat of paint, is packed with new reports, gives us 16 months of data, and provides a live link straight into Google’s index — it’s all rather lovely stuff!
Despite all this… I still can’t help looking longingly for a few of the old reports sitting neatly tiered on the left-hand side of the browser.
While we can’t quite turn back time, using the trusty SEO Spider we can replicate a few of these reports to fill the void for tabs now deleted or yet to be transferred over. Before jumping in, I should note this post mostly covers reports deleted or not fully transferred or across. If you can’t find something here, chances are it’s already available on GSC 2.0.
Structured Data
The new GSC does indeed have some structured data auditing in the new ‘Enhancements’ tab. However, it only monitors a few select forms of structured data (like Products and Events markup etc…). While I’m sure Google intends to expand this to cover all supported features, it doesn’t quite meet the comprehensiveness of the old report.
Well, hot on the heels of the v11.0 release for the SEO Spider, we now have bulk structured data auditing and validation built in. To activate, just head over to Configuration > Spider > Advanced > Enable the various structured data settings shown here:
Once your crawl is complete, there are two areas to view structured data. The first of which is in the main Structured Data tab and various sub filters, here:
Or, if you just want to examine one lone URL, click on it and open the Structured Data Details tab at the bottom of the tool:
There are also two exportable reports found in the main report’s menu: the Validation Errors & Warnings Summary, and the Validation Errors and Warnings.
For the full details, have a look at:
https://www.screamingfrog.co.uk/seo-spider/user-guide/tabs/#structured-data
HTML Improvements
The HTML Improvements was a neat little tab Google used to show off errors with page titles, meta descriptions, and non-indexable content. Mainly it highlighted when they were missing, duplicated, short, long, or non-informative.
Unlike many other reports, rather than transferring over to the new GSC it’s been completely removed. Despite this, it’s still an incredibly important aspect of page alignment, and in Google’s own words: “there are some really good tools that help you to crawl your website to extract titles & descriptions too.” Well — taking their hint, we can use the Spider and various tabs or filters for exactly that.
Want page title improvements? Look no further than the filters on the Page Title tab:
Or if you’re curious about your Meta Descriptions:
Want to see if any pages reference non-indexable content? Just sort by the Indexability column on any tab/filter combo:
International Targeting
Ahh, hreflang… the stuff of nightmares for even the most skilled of SEO veterans. Despite this, correctly configuring a multi-region/language domain is crucial. It not only ensures each user is served the relevant version, but also helps avoid any larger site or content issues. Thankfully, we’ve had this handy Search Console tab to help report any issues or errors with implementation:
Google hasn’t announced the removal of this report, and no doubt it will soon be viewable within the new GSC. However, if for any reason they don’t include it, or if it takes a while longer to migrate across, then look no further than the hreflang tab of the SEO Spider (once enabled in Configuration > Spider > hreflang).
With detailed filters to explore every nook and cranny of hreflang implementation — no matter what issues your site faces, you’ll be able to make actionable recommendations to bridge the language gap.
There’s also a handful of exportable hreflang reports from the top ‘Reports’ dropdown. While I won’t go through each tab here, I’d recommend you check out the following link which explains everything involving hreflang and the spider in much more detail:
https://www.screamingfrog.co.uk/how-to-audit-hreflang/
Blocked Resources
Another report that’s been axed — it was introduced as a way to keep track of any CSS or JavaScript files being blocked to search bots. Helping flag anything which might break the rendering, make the domain uncrawlable, or just straight up slow it down.
While these issues have drastically decreased over the years, they’re still important to keep track of. Fortunately, after running a crawl as Googlebot (Configuration > User-Agent > Googlebot) we can find all blocked resources within the Response Codes tab of the Spider — or if you’re just looking for issues relating to rendering, have a look at the bottom Rendered Page details tab:
Fetch as Google
“But wait — you can just use the new URL inspect tool…”. Well, yes — you can indeed use the new URL inspect to get a live render straight from Googlebot. But I still have a few quarrels with this.
For a start, you can only view your render from Googlebot mobile, while poor desktop is completely neglected. Secondly, the render is just a static above-the-fold screenshot, rather than the full-page scrollable view we used to get in Fetch As.
While it’s not quite the same as a direct request from Google, we can still emulate this within the Spider’s JavaScript rendering feature. To enable JavaScript rendering head over to Configuration > Spider > Rendering and switch the drop down to JavaScript.
Once your crawl is complete, highlight a URL and head over to the Rendered Page tab towards the bottom. Here you can view (or export) a screenshot of your rendered page, alongside a list showing all the resources needed:
If you want to mimic Google as much as possible, try switching the User-Agent to Googlebot or Googlebot mobile (Configuration > User-Agent). This will make the Spider spoof a request as if it were Google making it.
It’s also worth mentioning that Googlebot renders JavaScript based on v41 of Chrome, whereas the Spider uses the updated v64 of Chromium. While there aren’t many massive differences between the two, there may be some discrepancies.
As a bonus, if you still want a desktop render direct from Google (or don’t have access to Search Console of a domain), the PageSpeed Insights tool still produces a static desktop image as a representation of how Googlebot is rendering a page. It’s not the most high-res or detailed image but will get the job done!
Robots.txt tester
Another tab I’m hopeful Google will eventually migrate over — testing your robots before submitting is crucial to avoid disallowing or blocking half your site to search engines.
If for any reason they don’t happen to transfer this across to the new GSC, you can easily test any robot’s configuration directly within the SEO Spider (Configuration > Robots.txt > Custom).
This window will allow you to either import a live robots.txt file or make your own custom one. You can test if an individual URL is blocked by entering it into the search at the bottom. Alternatively, run a crawl of your site and the spider will obey the custom crawl behaviour.
For a much more in-depth guide on all the robots.txt capabilities of the SEO Spider, look here:
https://www.screamingfrog.co.uk/robots-txt-tester/
URL Parameters
An extremely useful tab — the URL Parameters helps to highlight all of the various parameter queries Google found on its journey through your site. This is particularly useful when examining the crawl efficiency or dealing with faceted navigations.
Currently, there’s no way of replicating this report within the Spider, but we are able to get a similar sample from a crawl and some Excel tinkering.
Just follow these steps or download the macro (linked below) –
1. Run a crawl of the domain, export the internal HTML tab
2. Cut & Paste the URL list into Column A of a fresh Excel sheet
3. Highlight Column A > Data > Text-to-Columns > Delimited > Other: ? > Finish
4. Highlight Column B > Data > Text-to-Columns > Delimited > Other: & > Finish
5. Highlight Column A > Right-click > Delete
6. Home > Editing > Find & Select > Go to Special > Blanks > OK
7. With these highlighted > Home > Cells > Delete
8. CTRL+A to highlight everything > Find & Replace > Replace: =* with nothing
9. Stack all columns into one & add a heading of ‘Parameter’
10. Highlight this master column > Insert > Pivot Table > Recommended > Count of Parameter
To save some time, I’ve made an Excel macro to do this all for you, which you can download here. Just download the spreadsheet > click Enable Content & Enable Editing then follow the instructions.
If everything’s done correctly, you should end up with a new table similar to this:
It’s worth noting there will be some discrepancies between this and Google’s own URL report. This boils down to the fundamental differences between the Spider & Googlebot, most of which is explained in much greater detail here:
https://www.screamingfrog.co.uk/seo-spider/faq/#why-does-the-number-of-urls-crawled-not-match-the-number-of-results-indexed-in-google-or-errors-reported-within-google-webmaster-tools
The King Is Dead, Long Live the King!
Well, that’s all for now — hopefully you find some of these reports useful. If you want a full list of our other how-to guides, take a look through our user guide & FAQ pages. Alternatively, if you have any other suggestions and alternatives to the retired Google system, I’d love to hear about them in the comments below.
As a side note: for many of these reports, you can also combine them with the Scheduling feature to keep them running on a regular basis. Or, if you’d like some automatic reporting, take a quick look at setting this up in the Crawl Reporting in Google Data Studio of my previous post.
The post Reviving Retired Search Console Reports appeared first on Screaming Frog.
0 notes
Text
Website Pop-Ups: The Good, the Bad, and 18 Rules You Should Never Break
Sourced From: https://www.webdesignerdepot.com/2018/06/website-pop-ups-the-good-the-bad-and-18-rules-you-should-never-break/
A website is a place where a business can educate its audience about its brand. What it does. Why it does it. What they’ll get out of being there. That, in and of itself, is a lot of information.
When designing a website for your clients, the last thing you want is to overdo it. The web is not a place for excess and its users typically don’t have the patience to sift through pages and pages stuffed full of information just to get to the relevant bits.
That’s why minimalism will endure as a design trend. It allows web designers to convey a lot about a brand and its message, without having to spell it all out on the page. It gives brands a cleaner, more buttoned-up look while also clearing a path to conversion for visitors.
But just because you design with simplicity and minimalism in mind, doesn’t mean you can’t share additional messages with visitors. You just have to find less cumbersome and intrusive ways to do so.
Years ago, the pop-up was introduced as a means to do this. It kept related and relevant information within the website without having to intrude on the well-designed page. However, Google has since cracked down on the usage of pop-ups that it deems disruptive to the user experience, which has some designers and developers confused about what they’re supposed to do now.
So, what does it mean? Is the pop-up no longer a viable way to promote special offers, share value-add content, subscribe new followers, or recover nearly-lost sales? In this article, I’m going to cover the current state of website pop-ups and give you some best practices to adhere to when using them.
The Current State of Website Pop-ups
First, let’s talk about what pop-ups look like today, how they’re used, and why you would even want to include them in your web design plan.
Types of Pop-ups
A modal is the most common type users encounter on the web.
It can literally pop open on a web page, slide into the page, or just be there right from the point of entry. While these usually can be found in the dead-center of the page, some websites now place them closer to the bottom of the page or even stick them in the corner.
An interstitial or overlay pop-up is one that covers the entire screen, usually upon entering a website.
A notification bar is one that can permanently stick to the top or bottom of a website.
5 Very Good Reasons to Use Pop-ups
You might think that with the backlash from Google on mobile pop-ups (I’m getting to that soon…) that it would be best to stay away from pop-ups altogether. However, I’ll give you 5 very good reasons why most of the websites you design should include them:
1. They’re Attention-Grabbing
No one has patience to read anymore, which is why delivering attention-grabbing micro-messages in pop-ups are so great.
2. They Draw the Eyes to What’s Most Important
Pop-ups deliver extra value to online visitors—and they know it. So, when a pop-up appears, they’re going to immediately be drawn to that offer or value-added opportunity.
3. They’re Versatile
Pop-ups no longer move visitors out of the browser window or clog up their desktop with ads they weren’t aware of. You now have so many different types to work with and they can be triggered at different points of the website experience:
Upon entry
After a certain point of scrolling
Triggered by an action
Right before exiting
4. They Keep the Site Clean
As I mentioned before, minimalism is important for making a website aesthetically pleasing. But if you have a special message you really want to get in front of visitors and don’t want to take up precious and limited real estate to do it, you can use pop-ups to deliver it.
5. They Increase Conversions
Sumo studied its users’ pop-ups and the conversion rates associated with them. What they found was that pop-ups have the potential to convert at a rate of about 3%, on average. Pop-ups that are designed really well, however, have the potential to convert 9% of visitors that encounter them.
You can also use them to increase engagement on the site. Ask them to fill out a survey, share something on social media, or to watch a video on a landing page.
But What’s the Deal with Mobile Pop-ups?
Okay, so Google doesn’t hate mobile pop-ups. It just wants web developers to be smarter about how they use them since pop-ups can be disruptive for users, in general, though definitely more so on smaller mobile screens.
As a result, Google has begun issuing penalties to mobile websites that use these three kinds of pop-ups:
In summary, stay away from:
Pop-ups on the first page of a mobile user’s visit
Pop-ups that hide the majority of the web page behind it
Interstitials
Got it? Now, let’s talk about what you should do when using website pop-ups.
18 Best Practices for Using Website Pop-ups
Never use pop-ups for the sole purpose of having a trendy design element in place. If you waste visitors’ time with a meaningless disruption, you’ll lose their trust.
Design the pop-up to look just as good as the rest of your website.
Make sure they’re responsive.
Keep copy short and to the point.
Don’t use the passive aggressive Yes/No calls-to-action unless it’s your brand’s personality to be that way. If you’re including two CTAs, do it in a way that positively encourages them to take action on the primary one.
If you’re going to collect contact information, ask only for one thing: their email address.
Make sure the content of the pop-up is relevant to the page it appears on.
If you can, avoid showing pop-ups on the first page. Give visitors a chance to acclimate first. For the record, though, this is one of the entry pop-up types Google does allow for (since privacy is so important):
Follow Google’s rules for mobile: no interstitials, no oversized modals, and no pop-ups on the first page.
Don’t feel like desktop and mobile pop-ups need to be identical. Design pop-ups for each device type.
Always include an easy way to get out of the pop-up: either click outside of it or place an “X” button in the top-right.
Time your pop-ups to appear at just the right moment of the on-site experience (like right before visitors are about to exit).
Set frequency rules, so visitors don’t keep seeing pop-ups on every page or on every visit.
Place pop-ups in the right location.
If you want to intrude (and think visitors will be okay with it), put them in the center of the screen.
If you want to share a special offer, use a sticky bar.
If you want to give them something to think about as they move around the site, put the pop-up off to the side.
Use audience segmentation and targeting to create customized pop-up messages.
Wrapping Up
If you have something really valuable to share with visitors or know you have a way to positively lure them back to your site, give website pop-ups a shot. And don’t be afraid to A/B test them the way you do other elements on your site. There’s so much here to play with, including design, copy, placement, CTA, triggers, and more.
Add Realistic Chalk and Sketch Lettering Effects with Sketch’it – only $5!
Source
p img {display:inline-block; margin-right:10px;}
.alignleft {float:left;}
p.showcase {clear:both;}
body#browserfriendly p, body#podcast p, div#emailbody p{margin:0;}
The post Website Pop-Ups: The Good, the Bad, and 18 Rules You Should Never Break appeared first on .
from https://ihelpsell.net/website-pop-ups-the-good-the-bad-and-18-rules-you-should-never-break/
0 notes
Text
How Much Data Is Missing from Analytics? And Other Analytics Black Holes
How Much Data Is Missing from Analytics? And Other Analytics Black Holes
Posted by Tom.Capper
If you’ve ever compared two analytics implementations on the same site, or compared your analytics with what your business is reporting in sales, you’ve probably noticed that things don’t always match up. In this post, I’ll explain why data is missing from your web analytics platforms and how large the impact could be. Some of the issues I cover are actually quite easily addressed, and have a decent impact on traffic — there’s never been an easier way to hit your quarterly targets. ;)
I’m going to focus on GA (Google Analytics), as it's the most commonly used provider, but most on-page analytics platforms have the same issues. Platforms that rely on server logs do avoid some issues but are fairly rare, so I won’t cover them in any depth.
Side note: Our test setup (multiple trackers & customized GA)
On Distilled.net, we have a standard Google Analytics property running from an HTML tag in GTM (Google Tag Manager). In addition, for the last two years, I’ve been running three extra concurrent Google Analytics implementations, designed to measure discrepancies between different configurations.
(If you’re just interested in my findings, you can skip this section, but if you want to hear more about the methodology, continue reading. Similarly, don’t worry if you don’t understand some of the detail here — the results are easier to follow.)
Two of these extra implementations — one in Google Tag Manager and one on page — run locally hosted, renamed copies of the Google Analytics JavaScript file (e.g. www.distilled.net/static/js/au3.js, instead of www.google-analytics.com/analytics.js) to make them harder to spot for ad blockers. I also used renamed JavaScript functions (“tcap” and “Buffoon,” rather than the standard “ga”) and renamed trackers (“FredTheUnblockable” and “AlbertTheImmutable”) to avoid having duplicate trackers (which can often cause issues).
This was originally inspired by 2016-era best practice on how to get your Google Analytics setup past ad blockers. I can’t find the original article now, but you can see a very similar one from 2017 here.
Lastly, we have (“DianaTheIndefatigable”), which just has a renamed tracker, but uses the standard code otherwise and is implemented on-page. This is to complete the set of all combinations of modified and unmodified GTM and on-page trackers.
Two of Distilled’s modified on-page trackers, as seen on https://www.distilled.net/
Overall, this table summarizes our setups:
Tracker
Renamed function?
GTM or on-page?
Locally hosted JavaScript file?
Default
No
GTM HTML tag
No
FredTheUnblockable
Yes - “tcap”
GTM HTML tag
Yes
AlbertTheImmutable
Yes - “buffoon”
On page
Yes
DianaTheIndefatigable
No
On page
No
I tested their functionality in various browser/ad-block environments by watching for the pageviews appearing in browser developer tools:
Reason 1: Ad Blockers
Ad blockers, primarily as browser extensions, have been growing in popularity for some time now. Primarily this has been to do with users looking for better performance and UX on ad-laden sites, but in recent years an increased emphasis on privacy has also crept in, hence the possibility of analytics blocking.
Effect of ad blockers
Some ad blockers block web analytics platforms by default, others can be configured to do so. I tested Distilled’s site with Adblock Plus and uBlock Origin, two of the most popular ad-blocking desktop browser addons, but it’s worth noting that ad blockers are increasingly prevalent on smartphones, too.
Here’s how Distilled’s setups fared:
(All numbers shown are from April 2018)
Setup
Vs. Adblock
Vs. Adblock with “EasyPrivacy” enabled
Vs. uBlock Origin
GTM
Pass
Fail
Fail
On page
Pass
Fail
Fail
GTM + renamed script & function
Pass
Fail
Fail
On page + renamed script & function
Pass
Fail
Fail
Seems like those tweaked setups didn’t do much!
Lost data due to ad blockers: ~10%
Ad blocker usage can be in the 15–25% range depending on region, but many of these installs will be default setups of AdBlock Plus, which as we’ve seen above, does not block tracking. Estimates of AdBlock Plus’s market share among ad blockers vary from 50–70%, with more recent reports tending more towards the former. So, if we assume that at most 50% of installed ad blockers block analytics, that leaves your exposure at around 10%.
Reason 2: Browser “do not track”
This is another privacy motivated feature, this time of browsers themselves. You can enable it in the settings of most current browsers. It’s not compulsory for sites or platforms to obey the “do not track” request, but Firefox offers a stronger feature under the same set of options, which I decided to test as well.
Effect of “do not track”
Most browsers now offer the option to send a “Do not track” message. I tested the latest releases of Firefox & Chrome for Windows 10.
Setup
Chrome “do not track”
Firefox “do not track”
Firefox “tracking protection”
GTM
Pass
Pass
Fail
On page
Pass
Pass
Fail
GTM + renamed script & function
Pass
Pass
Fail
On page + renamed script & function
Pass
Pass
Fail
Again, it doesn’t seem that the tweaked setups are doing much work for us here.
Lost data due to “do not track”: <1%
Only Firefox Quantum’s “Tracking Protection,” introduced in February, had any effect on our trackers. Firefox has a 5% market share, but Tracking Protection is not enabled by default. The launch of this feature had no effect on the trend for Firefox traffic on Distilled.net.
Reason 3: Filters
It’s a bit of an obvious one, but filters you’ve set up in your analytics might intentionally or unintentionally reduce your reported traffic levels.
For example, a filter excluding certain niche screen resolutions that you believe to be mostly bots, or internal traffic, will obviously cause your setup to underreport slightly.
Lost data due to filters: ???
Impact is hard to estimate, as setup will obviously vary on a site-by site-basis. I do recommend having a duplicate, unfiltered “master” view in case you realize too late you’ve lost something you didn’t intend to.
Reason 4: GTM vs. on-page vs. misplaced on-page
Google Tag Manager has become an increasingly popular way of implementing analytics in recent years, due to its increased flexibility and the ease of making changes. However, I’ve long noticed that it can tend to underreport vs. on-page setups.
I was also curious about what would happen if you didn’t follow Google’s guidelines in setting up on-page code.
By combining my numbers with numbers from my colleague Dom Woodman’s site (you’re welcome for the link, Dom), which happens to use a Drupal analytics add-on as well as GTM, I was able to see the difference between Google Tag Manager and misplaced on-page code (right at the bottom of the <body> tag) I then weighted this against my own Google Tag Manager data to get an overall picture of all 5 setups.
Effect of GTM and misplaced on-page code
Traffic as a percentage of baseline (standard Google Tag Manager implementation):
Google Tag Manager
Modified & Google Tag Manager
On-Page Code In <head>
Modified & On-Page Code In <head>
On-Page Code Misplaced In <Body>
Chrome
100.00%
98.75%
100.77%
99.80%
94.75%
Safari
100.00%
99.42%
100.55%
102.08%
82.69%
Firefox
100.00%
99.71%
101.16%
101.45%
90.68%
Internet Explorer
100.00%
80.06%
112.31%
113.37%
77.18%
There are a few main takeaways here:
On-page code generally reports more traffic than GTM
Modified code is generally within a margin of error, apart from modified GTM code on Internet Explorer (see note below)
Misplaced analytics code will cost you up to a third of your traffic vs. properly implemented on-page code, depending on browser (!)
The customized setups, which are designed to get more traffic by evading ad blockers, are doing nothing of the sort.
It’s worth noting also that the customized implementations actually got less traffic than the standard ones. For the on-page code, this is within the margin of error, but for Google Tag Manager, there’s another reason — because I used unfiltered profiles for the comparison, there’s a lot of bot spam in the main profile, which primarily masquerades as Internet Explorer. Our main profile is by far the most spammed, and also acting as the baseline here, so the difference between on-page code and Google Tag Manager is probably somewhat larger than what I’m reporting.
I also split the data by mobile, out of curiosity:
Traffic as a percentage of baseline (standard Google Tag Manager implementation):
Google Tag Manager
Modified & Google Tag Manager
On-Page Code In <head>
Modified & On-Page Code In <head>
On-Page Code Misplaced In <Body>
Desktop
100.00%
98.31%
100.97%
100.89%
93.47%
Mobile
100.00%
97.00%
103.78%
100.42%
89.87%
Tablet
100.00%
97.68%
104.20%
102.43%
88.13%
The further takeaway here seems to be that mobile browsers, like Internet Explorer, can struggle with Google Tag Manager.
Lost data due to GTM: 1–5%
Google Tag Manager seems to cost you a varying amount depending on what make-up of browsers and devices use your site. On Distilled.net, the difference is around 1.7%; however, we have an unusually desktop-heavy and tech-savvy audience (not much Internet Explorer!). Depending on vertical, this could easily swell to the 5% range.
Lost data due to misplaced on-page code: ~10%
On Teflsearch.com, the impact of misplaced on-page code was around 7.5%, vs Google Tag Manager. Keeping in mind that Google Tag Manager itself underreports, the total loss could easily be in the 10% range.
Bonus round: Missing data from channels
I’ve focused above on areas where you might be missing data altogether. However, there are also lots of ways in which data can be misrepresented, or detail can be missing. I’ll cover these more briefly, but the main issues are dark traffic and attribution.
Dark traffic
Dark traffic is direct traffic that didn’t really come via direct — which is generally becoming more and more common. Typical causes are:
Untagged campaigns in email
Untagged campaigns in apps (especially Facebook, Twitter, etc.)
Misrepresented organic
Data sent from botched tracking implementations (which can also appear as self-referrals)
It’s also worth noting the trend towards genuinely direct traffic that would historically have been organic. For example, due to increasingly sophisticated browser autocompletes, cross-device history, and so on, people end up “typing” a URL that they’d have searched for historically.
Attribution
I’ve written about this in more detail here, but in general, a session in Google Analytics (and any other platform) is a fairly arbitrary construct — you might think it’s obvious how a group of hits should be grouped into one or more sessions, but in fact, the process relies on a number of fairly questionable assumptions. In particular, it’s worth noting that Google Analytics generally attributes direct traffic (including dark traffic) to the previous non-direct source, if one exists.
Discussion
I was quite surprised by some of my own findings when researching this post, but I’m sure I didn’t get everything. Can you think of any other ways in which data can end up missing from analytics?
Sign up for The Moz Top 10, a semimonthly mailer updating you on the top ten hottest pieces of SEO news, tips, and rad links uncovered by the Moz team. Think of it as your exclusive digest of stuff you don't have time to hunt down but want to read!
https://ift.tt/2q13Myy xem thêm tại: https://ift.tt/2mb4VST để biết thêm về địa chỉ bán tai nghe không dây giá rẻ How Much Data Is Missing from Analytics? And Other Analytics Black Holes https://ift.tt/2GWKq1B xem thêm tại: https://ift.tt/2mb4VST để biết thêm về địa chỉ bán tai nghe không dây giá rẻ How Much Data Is Missing from Analytics? And Other Analytics Black Holes https://ift.tt/2GWKq1B xem thêm tại: https://ift.tt/2mb4VST để biết thêm về địa chỉ bán tai nghe không dây giá rẻ How Much Data Is Missing from Analytics? And Other Analytics Black Holes https://ift.tt/2GWKq1B xem thêm tại: https://ift.tt/2mb4VST để biết thêm về địa chỉ bán tai nghe không dây giá rẻ How Much Data Is Missing from Analytics? And Other Analytics Black Holes https://ift.tt/2GWKq1B xem thêm tại: https://ift.tt/2mb4VST để biết thêm về địa chỉ bán tai nghe không dây giá rẻ How Much Data Is Missing from Analytics? And Other Analytics Black Holes https://ift.tt/2GWKq1B xem thêm tại: https://ift.tt/2mb4VST để biết thêm về địa chỉ bán tai nghe không dây giá rẻ How Much Data Is Missing from Analytics? And Other Analytics Black Holes https://ift.tt/2GWKq1B xem thêm tại: https://ift.tt/2mb4VST để biết thêm về địa chỉ bán tai nghe không dây giá rẻ How Much Data Is Missing from Analytics? And Other Analytics Black Holes https://ift.tt/2GWKq1B xem thêm tại: https://ift.tt/2mb4VST để biết thêm về địa chỉ bán tai nghe không dây giá rẻ How Much Data Is Missing from Analytics? And Other Analytics Black Holes https://ift.tt/2GWKq1B xem thêm tại: https://ift.tt/2mb4VST để biết thêm về địa chỉ bán tai nghe không dây giá rẻ How Much Data Is Missing from Analytics? And Other Analytics Black Holes https://ift.tt/2GWKq1B xem thêm tại: https://ift.tt/2mb4VST để biết thêm về địa chỉ bán tai nghe không dây giá rẻ How Much Data Is Missing from Analytics? And Other Analytics Black Holes https://ift.tt/2GWKq1B xem thêm tại: https://ift.tt/2mb4VST để biết thêm về địa chỉ bán tai nghe không dây giá rẻ How Much Data Is Missing from Analytics? And Other Analytics Black Holes https://ift.tt/2GWKq1B xem thêm tại: https://ift.tt/2mb4VST để biết thêm về địa chỉ bán tai nghe không dây giá rẻ How Much Data Is Missing from Analytics? And Other Analytics Black Holes https://ift.tt/2GWKq1B xem thêm tại: https://ift.tt/2mb4VST để biết thêm về địa chỉ bán tai nghe không dây giá rẻ How Much Data Is Missing from Analytics? And Other Analytics Black Holes https://ift.tt/2GWKq1B xem thêm tại: https://ift.tt/2mb4VST để biết thêm về địa chỉ bán tai nghe không dây giá rẻ How Much Data Is Missing from Analytics? And Other Analytics Black Holes https://ift.tt/2GWKq1B xem thêm tại: https://ift.tt/2mb4VST để biết thêm về địa chỉ bán tai nghe không dây giá rẻ How Much Data Is Missing from Analytics? And Other Analytics Black Holes https://ift.tt/2GWKq1B xem thêm tại: https://ift.tt/2mb4VST để biết thêm về địa chỉ bán tai nghe không dây giá rẻ How Much Data Is Missing from Analytics? And Other Analytics Black Holes https://ift.tt/2GWKq1B Bạn có thể xem thêm địa chỉ mua tai nghe không dây tại đây https://ift.tt/2mb4VST
0 notes
Text
How Much Data Is Missing from Analytics? And Other Analytics Black Holes
Posted by Tom.Capper
If you’ve ever compared two analytics implementations on the same site, or compared your analytics with what your business is reporting in sales, you’ve probably noticed that things don’t always match up. In this post, I’ll explain why data is missing from your web analytics platforms and how large the impact could be. Some of the issues I cover are actually quite easily addressed, and have a decent impact on traffic — there’s never been an easier way to hit your quarterly targets. ;)
I’m going to focus on GA (Google Analytics), as it's the most commonly used provider, but most on-page analytics platforms have the same issues. Platforms that rely on server logs do avoid some issues but are fairly rare, so I won’t cover them in any depth.
Side note: Our test setup (multiple trackers & customized GA)
On Distilled.net, we have a standard Google Analytics property running from an HTML tag in GTM (Google Tag Manager). In addition, for the last two years, I’ve been running three extra concurrent Google Analytics implementations, designed to measure discrepancies between different configurations.
(If you’re just interested in my findings, you can skip this section, but if you want to hear more about the methodology, continue reading. Similarly, don’t worry if you don’t understand some of the detail here — the results are easier to follow.)
Two of these extra implementations — one in Google Tag Manager and one on page — run locally hosted, renamed copies of the Google Analytics JavaScript file (e.g. www.distilled.net/static/js/au3.js, instead of www.google-analytics.com/analytics.js) to make them harder to spot for ad blockers. I also used renamed JavaScript functions (“tcap” and “Buffoon,” rather than the standard “ga”) and renamed trackers (“FredTheUnblockable” and “AlbertTheImmutable”) to avoid having duplicate trackers (which can often cause issues).
This was originally inspired by 2016-era best practice on how to get your Google Analytics setup past ad blockers. I can’t find the original article now, but you can see a very similar one from 2017 here.
Lastly, we have (“DianaTheIndefatigable”), which just has a renamed tracker, but uses the standard code otherwise and is implemented on-page. This is to complete the set of all combinations of modified and unmodified GTM and on-page trackers.
Two of Distilled’s modified on-page trackers, as seen on https://www.distilled.net/
Overall, this table summarizes our setups:
Tracker
Renamed function?
GTM or on-page?
Locally hosted JavaScript file?
Default
No
GTM HTML tag
No
FredTheUnblockable
Yes - “tcap”
GTM HTML tag
Yes
AlbertTheImmutable
Yes - “buffoon”
On page
Yes
DianaTheIndefatigable
No
On page
No
I tested their functionality in various browser/ad-block environments by watching for the pageviews appearing in browser developer tools:
Reason 1: Ad Blockers
Ad blockers, primarily as browser extensions, have been growing in popularity for some time now. Primarily this has been to do with users looking for better performance and UX on ad-laden sites, but in recent years an increased emphasis on privacy has also crept in, hence the possibility of analytics blocking.
Effect of ad blockers
Some ad blockers block web analytics platforms by default, others can be configured to do so. I tested Distilled’s site with Adblock Plus and uBlock Origin, two of the most popular ad-blocking desktop browser addons, but it’s worth noting that ad blockers are increasingly prevalent on smartphones, too.
Here’s how Distilled’s setups fared:
(All numbers shown are from April 2018)
Setup
Vs. Adblock
Vs. Adblock with “EasyPrivacy” enabled
Vs. uBlock Origin
GTM
Pass
Fail
Fail
On page
Pass
Fail
Fail
GTM + renamed script & function
Pass
Fail
Fail
On page + renamed script & function
Pass
Fail
Fail
Seems like those tweaked setups didn’t do much!
Lost data due to ad blockers: ~10%
Ad blocker usage can be in the 15–25% range depending on region, but many of these installs will be default setups of AdBlock Plus, which as we’ve seen above, does not block tracking. Estimates of AdBlock Plus’s market share among ad blockers vary from 50–70%, with more recent reports tending more towards the former. So, if we assume that at most 50% of installed ad blockers block analytics, that leaves your exposure at around 10%.
Reason 2: Browser “do not track”
This is another privacy motivated feature, this time of browsers themselves. You can enable it in the settings of most current browsers. It’s not compulsory for sites or platforms to obey the “do not track” request, but Firefox offers a stronger feature under the same set of options, which I decided to test as well.
Effect of “do not track”
Most browsers now offer the option to send a “Do not track” message. I tested the latest releases of Firefox & Chrome for Windows 10.
Setup
Chrome “do not track”
Firefox “do not track”
Firefox “tracking protection”
GTM
Pass
Pass
Fail
On page
Pass
Pass
Fail
GTM + renamed script & function
Pass
Pass
Fail
On page + renamed script & function
Pass
Pass
Fail
Again, it doesn’t seem that the tweaked setups are doing much work for us here.
Lost data due to “do not track”: <1%
Only Firefox Quantum’s “Tracking Protection,” introduced in February, had any effect on our trackers. Firefox has a 5% market share, but Tracking Protection is not enabled by default. The launch of this feature had no effect on the trend for Firefox traffic on Distilled.net.
Reason 3: Filters
It’s a bit of an obvious one, but filters you’ve set up in your analytics might intentionally or unintentionally reduce your reported traffic levels.
For example, a filter excluding certain niche screen resolutions that you believe to be mostly bots, or internal traffic, will obviously cause your setup to underreport slightly.
Lost data due to filters: ???
Impact is hard to estimate, as setup will obviously vary on a site-by site-basis. I do recommend having a duplicate, unfiltered “master” view in case you realize too late you’ve lost something you didn’t intend to.
Reason 4: GTM vs. on-page vs. misplaced on-page
Google Tag Manager has become an increasingly popular way of implementing analytics in recent years, due to its increased flexibility and the ease of making changes. However, I’ve long noticed that it can tend to underreport vs. on-page setups.
I was also curious about what would happen if you didn’t follow Google’s guidelines in setting up on-page code.
By combining my numbers with numbers from my colleague Dom Woodman’s site (you’re welcome for the link, Dom), which happens to use a Drupal analytics add-on as well as GTM, I was able to see the difference between Google Tag Manager and misplaced on-page code (right at the bottom of the <body> tag) I then weighted this against my own Google Tag Manager data to get an overall picture of all 5 setups.
Effect of GTM and misplaced on-page code
Traffic as a percentage of baseline (standard Google Tag Manager implementation):
Google Tag Manager
Modified & Google Tag Manager
On-Page Code In <head>
Modified & On-Page Code In <head>
On-Page Code Misplaced In <Body>
Chrome
100.00%
98.75%
100.77%
99.80%
94.75%
Safari
100.00%
99.42%
100.55%
102.08%
82.69%
Firefox
100.00%
99.71%
101.16%
101.45%
90.68%
Internet Explorer
100.00%
80.06%
112.31%
113.37%
77.18%
There are a few main takeaways here:
On-page code generally reports more traffic than GTM
Modified code is generally within a margin of error, apart from modified GTM code on Internet Explorer (see note below)
Misplaced analytics code will cost you up to a third of your traffic vs. properly implemented on-page code, depending on browser (!)
The customized setups, which are designed to get more traffic by evading ad blockers, are doing nothing of the sort.
It’s worth noting also that the customized implementations actually got less traffic than the standard ones. For the on-page code, this is within the margin of error, but for Google Tag Manager, there’s another reason — because I used unfiltered profiles for the comparison, there’s a lot of bot spam in the main profile, which primarily masquerades as Internet Explorer. Our main profile is by far the most spammed, and also acting as the baseline here, so the difference between on-page code and Google Tag Manager is probably somewhat larger than what I’m reporting.
I also split the data by mobile, out of curiosity:
Traffic as a percentage of baseline (standard Google Tag Manager implementation):
Google Tag Manager
Modified & Google Tag Manager
On-Page Code In <head>
Modified & On-Page Code In <head>
On-Page Code Misplaced In <Body>
Desktop
100.00%
98.31%
100.97%
100.89%
93.47%
Mobile
100.00%
97.00%
103.78%
100.42%
89.87%
Tablet
100.00%
97.68%
104.20%
102.43%
88.13%
The further takeaway here seems to be that mobile browsers, like Internet Explorer, can struggle with Google Tag Manager.
Lost data due to GTM: 1–5%
Google Tag Manager seems to cost you a varying amount depending on what make-up of browsers and devices use your site. On Distilled.net, the difference is around 1.7%; however, we have an unusually desktop-heavy and tech-savvy audience (not much Internet Explorer!). Depending on vertical, this could easily swell to the 5% range.
Lost data due to misplaced on-page code: ~10%
On Teflsearch.com, the impact of misplaced on-page code was around 7.5%, vs Google Tag Manager. Keeping in mind that Google Tag Manager itself underreports, the total loss could easily be in the 10% range.
Bonus round: Missing data from channels
I’ve focused above on areas where you might be missing data altogether. However, there are also lots of ways in which data can be misrepresented, or detail can be missing. I’ll cover these more briefly, but the main issues are dark traffic and attribution.
Dark traffic
Dark traffic is direct traffic that didn’t really come via direct — which is generally becoming more and more common. Typical causes are:
Untagged campaigns in email
Untagged campaigns in apps (especially Facebook, Twitter, etc.)
Misrepresented organic
Data sent from botched tracking implementations (which can also appear as self-referrals)
It’s also worth noting the trend towards genuinely direct traffic that would historically have been organic. For example, due to increasingly sophisticated browser autocompletes, cross-device history, and so on, people end up “typing” a URL that they’d have searched for historically.
Attribution
I’ve written about this in more detail here, but in general, a session in Google Analytics (and any other platform) is a fairly arbitrary construct — you might think it’s obvious how a group of hits should be grouped into one or more sessions, but in fact, the process relies on a number of fairly questionable assumptions. In particular, it’s worth noting that Google Analytics generally attributes direct traffic (including dark traffic) to the previous non-direct source, if one exists.
Discussion
I was quite surprised by some of my own findings when researching this post, but I’m sure I didn’t get everything. Can you think of any other ways in which data can end up missing from analytics?
Sign up for The Moz Top 10, a semimonthly mailer updating you on the top ten hottest pieces of SEO news, tips, and rad links uncovered by the Moz team. Think of it as your exclusive digest of stuff you don't have time to hunt down but want to read!
via Blogger https://ift.tt/2kwAy68
#blogger #bloggingtips #bloggerlife #bloggersgetsocial #ontheblog #writersofinstagram #writingprompt #instapoetry #writerscommunity #writersofig #writersblock #writerlife #writtenword #instawriters #spilledink #wordgasm #creativewriting #poetsofinstagram #blackoutpoetry #poetsofig
0 notes
Text
How Much Data Is Missing from Analytics? And Other Analytics Black Holes
Posted by Tom.Capper
If you’ve ever compared two analytics implementations on the same site, or compared your analytics with what your business is reporting in sales, you’ve probably noticed that things don’t always match up. In this post, I’ll explain why data is missing from your web analytics platforms and how large the impact could be. Some of the issues I cover are actually quite easily addressed, and have a decent impact on traffic — there’s never been an easier way to hit your quarterly targets. ;)
I’m going to focus on GA (Google Analytics), as it's the most commonly used provider, but most on-page analytics platforms have the same issues. Platforms that rely on server logs do avoid some issues but are fairly rare, so I won’t cover them in any depth.
Side note: Our test setup (multiple trackers & customized GA)
On Distilled.net, we have a standard Google Analytics property running from an HTML tag in GTM (Google Tag Manager). In addition, for the last two years, I’ve been running three extra concurrent Google Analytics implementations, designed to measure discrepancies between different configurations.
(If you’re just interested in my findings, you can skip this section, but if you want to hear more about the methodology, continue reading. Similarly, don’t worry if you don’t understand some of the detail here — the results are easier to follow.)
Two of these extra implementations — one in Google Tag Manager and one on page — run locally hosted, renamed copies of the Google Analytics JavaScript file (e.g. www.distilled.net/static/js/au3.js, instead of www.google-analytics.com/analytics.js) to make them harder to spot for ad blockers. I also used renamed JavaScript functions (“tcap” and “Buffoon,” rather than the standard “ga”) and renamed trackers (“FredTheUnblockable” and “AlbertTheImmutable”) to avoid having duplicate trackers (which can often cause issues).
This was originally inspired by 2016-era best practice on how to get your Google Analytics setup past ad blockers. I can’t find the original article now, but you can see a very similar one from 2017 here.
Lastly, we have (“DianaTheIndefatigable”), which just has a renamed tracker, but uses the standard code otherwise and is implemented on-page. This is to complete the set of all combinations of modified and unmodified GTM and on-page trackers.
Two of Distilled’s modified on-page trackers, as seen on https://www.distilled.net/
Overall, this table summarizes our setups:
Tracker
Renamed function?
GTM or on-page?
Locally hosted JavaScript file?
Default
No
GTM HTML tag
No
FredTheUnblockable
Yes - “tcap”
GTM HTML tag
Yes
AlbertTheImmutable
Yes - “buffoon”
On page
Yes
DianaTheIndefatigable
No
On page
No
I tested their functionality in various browser/ad-block environments by watching for the pageviews appearing in browser developer tools:
Reason 1: Ad Blockers
Ad blockers, primarily as browser extensions, have been growing in popularity for some time now. Primarily this has been to do with users looking for better performance and UX on ad-laden sites, but in recent years an increased emphasis on privacy has also crept in, hence the possibility of analytics blocking.
Effect of ad blockers
Some ad blockers block web analytics platforms by default, others can be configured to do so. I tested Distilled’s site with Adblock Plus and uBlock Origin, two of the most popular ad-blocking desktop browser addons, but it’s worth noting that ad blockers are increasingly prevalent on smartphones, too.
Here’s how Distilled’s setups fared:
(All numbers shown are from April 2018)
Setup
Vs. Adblock
Vs. Adblock with “EasyPrivacy” enabled
Vs. uBlock Origin
GTM
Pass
Fail
Fail
On page
Pass
Fail
Fail
GTM + renamed script & function
Pass
Fail
Fail
On page + renamed script & function
Pass
Fail
Fail
Seems like those tweaked setups didn’t do much!
Lost data due to ad blockers: ~10%
Ad blocker usage can be in the 15–25% range depending on region, but many of these installs will be default setups of AdBlock Plus, which as we’ve seen above, does not block tracking. Estimates of AdBlock Plus’s market share among ad blockers vary from 50–70%, with more recent reports tending more towards the former. So, if we assume that at most 50% of installed ad blockers block analytics, that leaves your exposure at around 10%.
Reason 2: Browser “do not track”
This is another privacy motivated feature, this time of browsers themselves. You can enable it in the settings of most current browsers. It’s not compulsory for sites or platforms to obey the “do not track” request, but Firefox offers a stronger feature under the same set of options, which I decided to test as well.
Effect of “do not track”
Most browsers now offer the option to send a “Do not track” message. I tested the latest releases of Firefox & Chrome for Windows 10.
Setup
Chrome “do not track”
Firefox “do not track”
Firefox “tracking protection”
GTM
Pass
Pass
Fail
On page
Pass
Pass
Fail
GTM + renamed script & function
Pass
Pass
Fail
On page + renamed script & function
Pass
Pass
Fail
Again, it doesn’t seem that the tweaked setups are doing much work for us here.
Lost data due to “do not track”: <1%
Only Firefox Quantum’s “Tracking Protection,” introduced in February, had any effect on our trackers. Firefox has a 5% market share, but Tracking Protection is not enabled by default. The launch of this feature had no effect on the trend for Firefox traffic on Distilled.net.
Reason 3: Filters
It’s a bit of an obvious one, but filters you’ve set up in your analytics might intentionally or unintentionally reduce your reported traffic levels.
For example, a filter excluding certain niche screen resolutions that you believe to be mostly bots, or internal traffic, will obviously cause your setup to underreport slightly.
Lost data due to filters: ???
Impact is hard to estimate, as setup will obviously vary on a site-by site-basis. I do recommend having a duplicate, unfiltered “master” view in case you realize too late you’ve lost something you didn’t intend to.
Reason 4: GTM vs. on-page vs. misplaced on-page
Google Tag Manager has become an increasingly popular way of implementing analytics in recent years, due to its increased flexibility and the ease of making changes. However, I’ve long noticed that it can tend to underreport vs. on-page setups.
I was also curious about what would happen if you didn’t follow Google’s guidelines in setting up on-page code.
By combining my numbers with numbers from my colleague Dom Woodman’s site (you’re welcome for the link, Dom), which happens to use a Drupal analytics add-on as well as GTM, I was able to see the difference between Google Tag Manager and misplaced on-page code (right at the bottom of the <body> tag) I then weighted this against my own Google Tag Manager data to get an overall picture of all 5 setups.
Effect of GTM and misplaced on-page code
Traffic as a percentage of baseline (standard Google Tag Manager implementation):
Google Tag Manager
Modified & Google Tag Manager
On-Page Code In <head>
Modified & On-Page Code In <head>
On-Page Code Misplaced In <Body>
Chrome
100.00%
98.75%
100.77%
99.80%
94.75%
Safari
100.00%
99.42%
100.55%
102.08%
82.69%
Firefox
100.00%
99.71%
101.16%
101.45%
90.68%
Internet Explorer
100.00%
80.06%
112.31%
113.37%
77.18%
There are a few main takeaways here:
On-page code generally reports more traffic than GTM
Modified code is generally within a margin of error, apart from modified GTM code on Internet Explorer (see note below)
Misplaced analytics code will cost you up to a third of your traffic vs. properly implemented on-page code, depending on browser (!)
The customized setups, which are designed to get more traffic by evading ad blockers, are doing nothing of the sort.
It’s worth noting also that the customized implementations actually got less traffic than the standard ones. For the on-page code, this is within the margin of error, but for Google Tag Manager, there’s another reason — because I used unfiltered profiles for the comparison, there’s a lot of bot spam in the main profile, which primarily masquerades as Internet Explorer. Our main profile is by far the most spammed, and also acting as the baseline here, so the difference between on-page code and Google Tag Manager is probably somewhat larger than what I’m reporting.
I also split the data by mobile, out of curiosity:
Traffic as a percentage of baseline (standard Google Tag Manager implementation):
Google Tag Manager
Modified & Google Tag Manager
On-Page Code In <head>
Modified & On-Page Code In <head>
On-Page Code Misplaced In <Body>
Desktop
100.00%
98.31%
100.97%
100.89%
93.47%
Mobile
100.00%
97.00%
103.78%
100.42%
89.87%
Tablet
100.00%
97.68%
104.20%
102.43%
88.13%
The further takeaway here seems to be that mobile browsers, like Internet Explorer, can struggle with Google Tag Manager.
Lost data due to GTM: 1–5%
Google Tag Manager seems to cost you a varying amount depending on what make-up of browsers and devices use your site. On Distilled.net, the difference is around 1.7%; however, we have an unusually desktop-heavy and tech-savvy audience (not much Internet Explorer!). Depending on vertical, this could easily swell to the 5% range.
Lost data due to misplaced on-page code: ~10%
On Teflsearch.com, the impact of misplaced on-page code was around 7.5%, vs Google Tag Manager. Keeping in mind that Google Tag Manager itself underreports, the total loss could easily be in the 10% range.
Bonus round: Missing data from channels
I’ve focused above on areas where you might be missing data altogether. However, there are also lots of ways in which data can be misrepresented, or detail can be missing. I’ll cover these more briefly, but the main issues are dark traffic and attribution.
Dark traffic
Dark traffic is direct traffic that didn’t really come via direct — which is generally becoming more and more common. Typical causes are:
Untagged campaigns in email
Untagged campaigns in apps (especially Facebook, Twitter, etc.)
Misrepresented organic
Data sent from botched tracking implementations (which can also appear as self-referrals)
It’s also worth noting the trend towards genuinely direct traffic that would historically have been organic. For example, due to increasingly sophisticated browser autocompletes, cross-device history, and so on, people end up “typing” a URL that they’d have searched for historically.
Attribution
I’ve written about this in more detail here, but in general, a session in Google Analytics (and any other platform) is a fairly arbitrary construct — you might think it’s obvious how a group of hits should be grouped into one or more sessions, but in fact, the process relies on a number of fairly questionable assumptions. In particular, it’s worth noting that Google Analytics generally attributes direct traffic (including dark traffic) to the previous non-direct source, if one exists.
Discussion
I was quite surprised by some of my own findings when researching this post, but I’m sure I didn’t get everything. Can you think of any other ways in which data can end up missing from analytics?
Sign up for The Moz Top 10, a semimonthly mailer updating you on the top ten hottest pieces of SEO news, tips, and rad links uncovered by the Moz team. Think of it as your exclusive digest of stuff you don't have time to hunt down but want to read!
from Blogger https://ift.tt/2KZaOKK
via IFTTT
0 notes
Text
How Much Data Is Missing from Analytics? And Other Analytics Black Holes
Posted by Tom.Capper
If you’ve ever compared two analytics implementations on the same site, or compared your analytics with what your business is reporting in sales, you’ve probably noticed that things don’t always match up. In this post, I’ll explain why data is missing from your web analytics platforms and how large the impact could be. Some of the issues I cover are actually quite easily addressed, and have a decent impact on traffic — there’s never been an easier way to hit your quarterly targets. ;)
I’m going to focus on GA (Google Analytics), as it's the most commonly used provider, but most on-page analytics platforms have the same issues. Platforms that rely on server logs do avoid some issues but are fairly rare, so I won’t cover them in any depth.
Side note: Our test setup (multiple trackers & customized GA)
On Distilled.net, we have a standard Google Analytics property running from an HTML tag in GTM (Google Tag Manager). In addition, for the last two years, I’ve been running three extra concurrent Google Analytics implementations, designed to measure discrepancies between different configurations.
(If you’re just interested in my findings, you can skip this section, but if you want to hear more about the methodology, continue reading. Similarly, don’t worry if you don’t understand some of the detail here — the results are easier to follow.)
Two of these extra implementations — one in Google Tag Manager and one on page — run locally hosted, renamed copies of the Google Analytics JavaScript file (e.g. www.distilled.net/static/js/au3.js, instead of www.google-analytics.com/analytics.js) to make them harder to spot for ad blockers. I also used renamed JavaScript functions (“tcap” and “Buffoon,” rather than the standard “ga”) and renamed trackers (“FredTheUnblockable” and “AlbertTheImmutable”) to avoid having duplicate trackers (which can often cause issues).
This was originally inspired by 2016-era best practice on how to get your Google Analytics setup past ad blockers. I can’t find the original article now, but you can see a very similar one from 2017 here.
Lastly, we have (“DianaTheIndefatigable”), which just has a renamed tracker, but uses the standard code otherwise and is implemented on-page. This is to complete the set of all combinations of modified and unmodified GTM and on-page trackers.
Two of Distilled’s modified on-page trackers, as seen on https://www.distilled.net/
Overall, this table summarizes our setups:
Tracker
Renamed function?
GTM or on-page?
Locally hosted JavaScript file?
Default
No
GTM HTML tag
No
FredTheUnblockable
Yes - “tcap”
GTM HTML tag
Yes
AlbertTheImmutable
Yes - “buffoon”
On page
Yes
DianaTheIndefatigable
No
On page
No
I tested their functionality in various browser/ad-block environments by watching for the pageviews appearing in browser developer tools:
Reason 1: Ad Blockers
Ad blockers, primarily as browser extensions, have been growing in popularity for some time now. Primarily this has been to do with users looking for better performance and UX on ad-laden sites, but in recent years an increased emphasis on privacy has also crept in, hence the possibility of analytics blocking.
Effect of ad blockers
Some ad blockers block web analytics platforms by default, others can be configured to do so. I tested Distilled’s site with Adblock Plus and uBlock Origin, two of the most popular ad-blocking desktop browser addons, but it’s worth noting that ad blockers are increasingly prevalent on smartphones, too.
Here’s how Distilled’s setups fared:
(All numbers shown are from April 2018)
Setup
Vs. Adblock
Vs. Adblock with “EasyPrivacy” enabled
Vs. uBlock Origin
GTM
Pass
Fail
Fail
On page
Pass
Fail
Fail
GTM + renamed script & function
Pass
Fail
Fail
On page + renamed script & function
Pass
Fail
Fail
Seems like those tweaked setups didn’t do much!
Lost data due to ad blockers: ~10%
Ad blocker usage can be in the 15–25% range depending on region, but many of these installs will be default setups of AdBlock Plus, which as we’ve seen above, does not block tracking. Estimates of AdBlock Plus’s market share among ad blockers vary from 50–70%, with more recent reports tending more towards the former. So, if we assume that at most 50% of installed ad blockers block analytics, that leaves your exposure at around 10%.
Reason 2: Browser “do not track”
This is another privacy motivated feature, this time of browsers themselves. You can enable it in the settings of most current browsers. It’s not compulsory for sites or platforms to obey the “do not track” request, but Firefox offers a stronger feature under the same set of options, which I decided to test as well.
Effect of “do not track”
Most browsers now offer the option to send a “Do not track” message. I tested the latest releases of Firefox & Chrome for Windows 10.
Setup
Chrome “do not track”
Firefox “do not track”
Firefox “tracking protection”
GTM
Pass
Pass
Fail
On page
Pass
Pass
Fail
GTM + renamed script & function
Pass
Pass
Fail
On page + renamed script & function
Pass
Pass
Fail
Again, it doesn’t seem that the tweaked setups are doing much work for us here.
Lost data due to “do not track”: <1%
Only Firefox Quantum’s “Tracking Protection,” introduced in February, had any effect on our trackers. Firefox has a 5% market share, but Tracking Protection is not enabled by default. The launch of this feature had no effect on the trend for Firefox traffic on Distilled.net.
Reason 3: Filters
It’s a bit of an obvious one, but filters you’ve set up in your analytics might intentionally or unintentionally reduce your reported traffic levels.
For example, a filter excluding certain niche screen resolutions that you believe to be mostly bots, or internal traffic, will obviously cause your setup to underreport slightly.
Lost data due to filters: ???
Impact is hard to estimate, as setup will obviously vary on a site-by site-basis. I do recommend having a duplicate, unfiltered “master” view in case you realize too late you’ve lost something you didn’t intend to.
Reason 4: GTM vs. on-page vs. misplaced on-page
Google Tag Manager has become an increasingly popular way of implementing analytics in recent years, due to its increased flexibility and the ease of making changes. However, I’ve long noticed that it can tend to underreport vs. on-page setups.
I was also curious about what would happen if you didn’t follow Google’s guidelines in setting up on-page code.
By combining my numbers with numbers from my colleague Dom Woodman’s site (you’re welcome for the link, Dom), which happens to use a Drupal analytics add-on as well as GTM, I was able to see the difference between Google Tag Manager and misplaced on-page code (right at the bottom of the <body> tag) I then weighted this against my own Google Tag Manager data to get an overall picture of all 5 setups.
Effect of GTM and misplaced on-page code
Traffic as a percentage of baseline (standard Google Tag Manager implementation):
Google Tag Manager
Modified & Google Tag Manager
On-Page Code In <head>
Modified & On-Page Code In <head>
On-Page Code Misplaced In <Body>
Chrome
100.00%
98.75%
100.77%
99.80%
94.75%
Safari
100.00%
99.42%
100.55%
102.08%
82.69%
Firefox
100.00%
99.71%
101.16%
101.45%
90.68%
Internet Explorer
100.00%
80.06%
112.31%
113.37%
77.18%
There are a few main takeaways here:
On-page code generally reports more traffic than GTM
Modified code is generally within a margin of error, apart from modified GTM code on Internet Explorer (see note below)
Misplaced analytics code will cost you up to a third of your traffic vs. properly implemented on-page code, depending on browser (!)
The customized setups, which are designed to get more traffic by evading ad blockers, are doing nothing of the sort.
It’s worth noting also that the customized implementations actually got less traffic than the standard ones. For the on-page code, this is within the margin of error, but for Google Tag Manager, there’s another reason — because I used unfiltered profiles for the comparison, there’s a lot of bot spam in the main profile, which primarily masquerades as Internet Explorer. Our main profile is by far the most spammed, and also acting as the baseline here, so the difference between on-page code and Google Tag Manager is probably somewhat larger than what I’m reporting.
I also split the data by mobile, out of curiosity:
Traffic as a percentage of baseline (standard Google Tag Manager implementation):
Google Tag Manager
Modified & Google Tag Manager
On-Page Code In <head>
Modified & On-Page Code In <head>
On-Page Code Misplaced In <Body>
Desktop
100.00%
98.31%
100.97%
100.89%
93.47%
Mobile
100.00%
97.00%
103.78%
100.42%
89.87%
Tablet
100.00%
97.68%
104.20%
102.43%
88.13%
The further takeaway here seems to be that mobile browsers, like Internet Explorer, can struggle with Google Tag Manager.
Lost data due to GTM: 1–5%
Google Tag Manager seems to cost you a varying amount depending on what make-up of browsers and devices use your site. On Distilled.net, the difference is around 1.7%; however, we have an unusually desktop-heavy and tech-savvy audience (not much Internet Explorer!). Depending on vertical, this could easily swell to the 5% range.
Lost data due to misplaced on-page code: ~10%
On Teflsearch.com, the impact of misplaced on-page code was around 7.5%, vs Google Tag Manager. Keeping in mind that Google Tag Manager itself underreports, the total loss could easily be in the 10% range.
Bonus round: Missing data from channels
I’ve focused above on areas where you might be missing data altogether. However, there are also lots of ways in which data can be misrepresented, or detail can be missing. I’ll cover these more briefly, but the main issues are dark traffic and attribution.
Dark traffic
Dark traffic is direct traffic that didn’t really come via direct — which is generally becoming more and more common. Typical causes are:
Untagged campaigns in email
Untagged campaigns in apps (especially Facebook, Twitter, etc.)
Misrepresented organic
Data sent from botched tracking implementations (which can also appear as self-referrals)
It’s also worth noting the trend towards genuinely direct traffic that would historically have been organic. For example, due to increasingly sophisticated browser autocompletes, cross-device history, and so on, people end up “typing” a URL that they’d have searched for historically.
Attribution
I’ve written about this in more detail here, but in general, a session in Google Analytics (and any other platform) is a fairly arbitrary construct — you might think it’s obvious how a group of hits should be grouped into one or more sessions, but in fact, the process relies on a number of fairly questionable assumptions. In particular, it’s worth noting that Google Analytics generally attributes direct traffic (including dark traffic) to the previous non-direct source, if one exists.
Discussion
I was quite surprised by some of my own findings when researching this post, but I’m sure I didn’t get everything. Can you think of any other ways in which data can end up missing from analytics?
Sign up for The Moz Top 10, a semimonthly mailer updating you on the top ten hottest pieces of SEO news, tips, and rad links uncovered by the Moz team. Think of it as your exclusive digest of stuff you don't have time to hunt down but want to read!
from Moz Blog https://moz.com/blog/analytics-black-holes
via IFTTT
from IM Local SEO Blog http://imlocalseo.blogspot.com/2018/05/how-much-data-is-missing-from-analytics.html
via IFTTT
from Blogger http://nereomata.blogspot.com/2018/05/how-much-data-is-missing-from-analytics.html
via IFTTT
0 notes
Text
How Much Data Is Missing from Analytics? And Other Analytics Black Holes
Posted by Tom.Capper
If you’ve ever compared two analytics implementations on the same site, or compared your analytics with what your business is reporting in sales, you’ve probably noticed that things don’t always match up. In this post, I’ll explain why data is missing from your web analytics platforms and how large the impact could be. Some of the issues I cover are actually quite easily addressed, and have a decent impact on traffic — there’s never been an easier way to hit your quarterly targets. ;)
I’m going to focus on GA (Google Analytics), as it's the most commonly used provider, but most on-page analytics platforms have the same issues. Platforms that rely on server logs do avoid some issues but are fairly rare, so I won’t cover them in any depth.
Side note: Our test setup (multiple trackers & customized GA)
On Distilled.net, we have a standard Google Analytics property running from an HTML tag in GTM (Google Tag Manager). In addition, for the last two years, I’ve been running three extra concurrent Google Analytics implementations, designed to measure discrepancies between different configurations.
(If you’re just interested in my findings, you can skip this section, but if you want to hear more about the methodology, continue reading. Similarly, don’t worry if you don’t understand some of the detail here — the results are easier to follow.)
Two of these extra implementations — one in Google Tag Manager and one on page — run locally hosted, renamed copies of the Google Analytics JavaScript file (e.g. www.distilled.net/static/js/au3.js, instead of www.google-analytics.com/analytics.js) to make them harder to spot for ad blockers. I also used renamed JavaScript functions (“tcap” and “Buffoon,” rather than the standard “ga”) and renamed trackers (“FredTheUnblockable” and “AlbertTheImmutable”) to avoid having duplicate trackers (which can often cause issues).
This was originally inspired by 2016-era best practice on how to get your Google Analytics setup past ad blockers. I can’t find the original article now, but you can see a very similar one from 2017 here.
Lastly, we have (“DianaTheIndefatigable”), which just has a renamed tracker, but uses the standard code otherwise and is implemented on-page. This is to complete the set of all combinations of modified and unmodified GTM and on-page trackers.
Two of Distilled’s modified on-page trackers, as seen on https://www.distilled.net/
Overall, this table summarizes our setups:
Tracker
Renamed function?
GTM or on-page?
Locally hosted JavaScript file?
Default
No
GTM HTML tag
No
FredTheUnblockable
Yes - “tcap”
GTM HTML tag
Yes
AlbertTheImmutable
Yes - “buffoon”
On page
Yes
DianaTheIndefatigable
No
On page
No
I tested their functionality in various browser/ad-block environments by watching for the pageviews appearing in browser developer tools:
Reason 1: Ad Blockers
Ad blockers, primarily as browser extensions, have been growing in popularity for some time now. Primarily this has been to do with users looking for better performance and UX on ad-laden sites, but in recent years an increased emphasis on privacy has also crept in, hence the possibility of analytics blocking.
Effect of ad blockers
Some ad blockers block web analytics platforms by default, others can be configured to do so. I tested Distilled’s site with Adblock Plus and uBlock Origin, two of the most popular ad-blocking desktop browser addons, but it’s worth noting that ad blockers are increasingly prevalent on smartphones, too.
Here’s how Distilled’s setups fared:
(All numbers shown are from April 2018)
Setup
Vs. Adblock
Vs. Adblock with “EasyPrivacy” enabled
Vs. uBlock Origin
GTM
Pass
Fail
Fail
On page
Pass
Fail
Fail
GTM + renamed script & function
Pass
Fail
Fail
On page + renamed script & function
Pass
Fail
Fail
Seems like those tweaked setups didn’t do much!
Lost data due to ad blockers: ~10%
Ad blocker usage can be in the 15–25% range depending on region, but many of these installs will be default setups of AdBlock Plus, which as we’ve seen above, does not block tracking. Estimates of AdBlock Plus’s market share among ad blockers vary from 50–70%, with more recent reports tending more towards the former. So, if we assume that at most 50% of installed ad blockers block analytics, that leaves your exposure at around 10%.
Reason 2: Browser “do not track”
This is another privacy motivated feature, this time of browsers themselves. You can enable it in the settings of most current browsers. It’s not compulsory for sites or platforms to obey the “do not track” request, but Firefox offers a stronger feature under the same set of options, which I decided to test as well.
Effect of “do not track”
Most browsers now offer the option to send a “Do not track” message. I tested the latest releases of Firefox & Chrome for Windows 10.
Setup
Chrome “do not track”
Firefox “do not track”
Firefox “tracking protection”
GTM
Pass
Pass
Fail
On page
Pass
Pass
Fail
GTM + renamed script & function
Pass
Pass
Fail
On page + renamed script & function
Pass
Pass
Fail
Again, it doesn’t seem that the tweaked setups are doing much work for us here.
Lost data due to “do not track”: <1%
Only Firefox Quantum’s “Tracking Protection,” introduced in February, had any effect on our trackers. Firefox has a 5% market share, but Tracking Protection is not enabled by default. The launch of this feature had no effect on the trend for Firefox traffic on Distilled.net.
Reason 3: Filters
It’s a bit of an obvious one, but filters you’ve set up in your analytics might intentionally or unintentionally reduce your reported traffic levels.
For example, a filter excluding certain niche screen resolutions that you believe to be mostly bots, or internal traffic, will obviously cause your setup to underreport slightly.
Lost data due to filters: ???
Impact is hard to estimate, as setup will obviously vary on a site-by site-basis. I do recommend having a duplicate, unfiltered “master” view in case you realize too late you’ve lost something you didn’t intend to.
Reason 4: GTM vs. on-page vs. misplaced on-page
Google Tag Manager has become an increasingly popular way of implementing analytics in recent years, due to its increased flexibility and the ease of making changes. However, I’ve long noticed that it can tend to underreport vs. on-page setups.
I was also curious about what would happen if you didn’t follow Google’s guidelines in setting up on-page code.
By combining my numbers with numbers from my colleague Dom Woodman’s site (you’re welcome for the link, Dom), which happens to use a Drupal analytics add-on as well as GTM, I was able to see the difference between Google Tag Manager and misplaced on-page code (right at the bottom of the <body> tag) I then weighted this against my own Google Tag Manager data to get an overall picture of all 5 setups.
Effect of GTM and misplaced on-page code
Traffic as a percentage of baseline (standard Google Tag Manager implementation):
Google Tag Manager
Modified & Google Tag Manager
On-Page Code In <head>
Modified & On-Page Code In <head>
On-Page Code Misplaced In <Body>
Chrome
100.00%
98.75%
100.77%
99.80%
94.75%
Safari
100.00%
99.42%
100.55%
102.08%
82.69%
Firefox
100.00%
99.71%
101.16%
101.45%
90.68%
Internet Explorer
100.00%
80.06%
112.31%
113.37%
77.18%
There are a few main takeaways here:
On-page code generally reports more traffic than GTM
Modified code is generally within a margin of error, apart from modified GTM code on Internet Explorer (see note below)
Misplaced analytics code will cost you up to a third of your traffic vs. properly implemented on-page code, depending on browser (!)
The customized setups, which are designed to get more traffic by evading ad blockers, are doing nothing of the sort.
It’s worth noting also that the customized implementations actually got less traffic than the standard ones. For the on-page code, this is within the margin of error, but for Google Tag Manager, there’s another reason — because I used unfiltered profiles for the comparison, there’s a lot of bot spam in the main profile, which primarily masquerades as Internet Explorer. Our main profile is by far the most spammed, and also acting as the baseline here, so the difference between on-page code and Google Tag Manager is probably somewhat larger than what I’m reporting.
I also split the data by mobile, out of curiosity:
Traffic as a percentage of baseline (standard Google Tag Manager implementation):
Google Tag Manager
Modified & Google Tag Manager
On-Page Code In <head>
Modified & On-Page Code In <head>
On-Page Code Misplaced In <Body>
Desktop
100.00%
98.31%
100.97%
100.89%
93.47%
Mobile
100.00%
97.00%
103.78%
100.42%
89.87%
Tablet
100.00%
97.68%
104.20%
102.43%
88.13%
The further takeaway here seems to be that mobile browsers, like Internet Explorer, can struggle with Google Tag Manager.
Lost data due to GTM: 1–5%
Google Tag Manager seems to cost you a varying amount depending on what make-up of browsers and devices use your site. On Distilled.net, the difference is around 1.7%; however, we have an unusually desktop-heavy and tech-savvy audience (not much Internet Explorer!). Depending on vertical, this could easily swell to the 5% range.
Lost data due to misplaced on-page code: ~10%
On Teflsearch.com, the impact of misplaced on-page code was around 7.5%, vs Google Tag Manager. Keeping in mind that Google Tag Manager itself underreports, the total loss could easily be in the 10% range.
Bonus round: Missing data from channels
I’ve focused above on areas where you might be missing data altogether. However, there are also lots of ways in which data can be misrepresented, or detail can be missing. I’ll cover these more briefly, but the main issues are dark traffic and attribution.
Dark traffic
Dark traffic is direct traffic that didn’t really come via direct — which is generally becoming more and more common. Typical causes are:
Untagged campaigns in email
Untagged campaigns in apps (especially Facebook, Twitter, etc.)
Misrepresented organic
Data sent from botched tracking implementations (which can also appear as self-referrals)
It’s also worth noting the trend towards genuinely direct traffic that would historically have been organic. For example, due to increasingly sophisticated browser autocompletes, cross-device history, and so on, people end up “typing” a URL that they’d have searched for historically.
Attribution
I’ve written about this in more detail here, but in general, a session in Google Analytics (and any other platform) is a fairly arbitrary construct — you might think it’s obvious how a group of hits should be grouped into one or more sessions, but in fact, the process relies on a number of fairly questionable assumptions. In particular, it’s worth noting that Google Analytics generally attributes direct traffic (including dark traffic) to the previous non-direct source, if one exists.
Discussion
I was quite surprised by some of my own findings when researching this post, but I’m sure I didn’t get everything. Can you think of any other ways in which data can end up missing from analytics?
Sign up for The Moz Top 10, a semimonthly mailer updating you on the top ten hottest pieces of SEO news, tips, and rad links uncovered by the Moz team. Think of it as your exclusive digest of stuff you don't have time to hunt down but want to read!
from Blogger https://ift.tt/2J9fNey
via SW Unlimited
0 notes
Text
How Much Data Is Missing from Analytics? And Other Analytics Black Holes
Posted by Tom.Capper
If you’ve ever compared two analytics implementations on the same site, or compared your analytics with what your business is reporting in sales, you’ve probably noticed that things don’t always match up. In this post, I’ll explain why data is missing from your web analytics platforms and how large the impact could be. Some of the issues I cover are actually quite easily addressed, and have a decent impact on traffic — there’s never been an easier way to hit your quarterly targets. ;)
I’m going to focus on GA (Google Analytics), as it's the most commonly used provider, but most on-page analytics platforms have the same issues. Platforms that rely on server logs do avoid some issues but are fairly rare, so I won’t cover them in any depth.
Side note: Our test setup (multiple trackers & customized GA)
On Distilled.net, we have a standard Google Analytics property running from an HTML tag in GTM (Google Tag Manager). In addition, for the last two years, I’ve been running three extra concurrent Google Analytics implementations, designed to measure discrepancies between different configurations.
(If you’re just interested in my findings, you can skip this section, but if you want to hear more about the methodology, continue reading. Similarly, don’t worry if you don’t understand some of the detail here — the results are easier to follow.)
Two of these extra implementations — one in Google Tag Manager and one on page — run locally hosted, renamed copies of the Google Analytics JavaScript file (e.g. www.distilled.net/static/js/au3.js, instead of www.google-analytics.com/analytics.js) to make them harder to spot for ad blockers. I also used renamed JavaScript functions (“tcap” and “Buffoon,” rather than the standard “ga”) and renamed trackers (“FredTheUnblockable” and “AlbertTheImmutable”) to avoid having duplicate trackers (which can often cause issues).
This was originally inspired by 2016-era best practice on how to get your Google Analytics setup past ad blockers. I can’t find the original article now, but you can see a very similar one from 2017 here.
Lastly, we have (“DianaTheIndefatigable”), which just has a renamed tracker, but uses the standard code otherwise and is implemented on-page. This is to complete the set of all combinations of modified and unmodified GTM and on-page trackers.
Two of Distilled’s modified on-page trackers, as seen on https://www.distilled.net/
Overall, this table summarizes our setups:
Tracker
Renamed function?
GTM or on-page?
Locally hosted JavaScript file?
Default
No
GTM HTML tag
No
FredTheUnblockable
Yes - “tcap”
GTM HTML tag
Yes
AlbertTheImmutable
Yes - “buffoon”
On page
Yes
DianaTheIndefatigable
No
On page
No
I tested their functionality in various browser/ad-block environments by watching for the pageviews appearing in browser developer tools:
Reason 1: Ad Blockers
Ad blockers, primarily as browser extensions, have been growing in popularity for some time now. Primarily this has been to do with users looking for better performance and UX on ad-laden sites, but in recent years an increased emphasis on privacy has also crept in, hence the possibility of analytics blocking.
Effect of ad blockers
Some ad blockers block web analytics platforms by default, others can be configured to do so. I tested Distilled’s site with Adblock Plus and uBlock Origin, two of the most popular ad-blocking desktop browser addons, but it’s worth noting that ad blockers are increasingly prevalent on smartphones, too.
Here’s how Distilled’s setups fared:
(All numbers shown are from April 2018)
Setup
Vs. Adblock
Vs. Adblock with “EasyPrivacy” enabled
Vs. uBlock Origin
GTM
Pass
Fail
Fail
On page
Pass
Fail
Fail
GTM + renamed script & function
Pass
Fail
Fail
On page + renamed script & function
Pass
Fail
Fail
Seems like those tweaked setups didn’t do much!
Lost data due to ad blockers: ~10%
Ad blocker usage can be in the 15–25% range depending on region, but many of these installs will be default setups of AdBlock Plus, which as we’ve seen above, does not block tracking. Estimates of AdBlock Plus’s market share among ad blockers vary from 50–70%, with more recent reports tending more towards the former. So, if we assume that at most 50% of installed ad blockers block analytics, that leaves your exposure at around 10%.
Reason 2: Browser “do not track”
This is another privacy motivated feature, this time of browsers themselves. You can enable it in the settings of most current browsers. It’s not compulsory for sites or platforms to obey the “do not track” request, but Firefox offers a stronger feature under the same set of options, which I decided to test as well.
Effect of “do not track”
Most browsers now offer the option to send a “Do not track” message. I tested the latest releases of Firefox & Chrome for Windows 10.
Setup
Chrome “do not track”
Firefox “do not track”
Firefox “tracking protection”
GTM
Pass
Pass
Fail
On page
Pass
Pass
Fail
GTM + renamed script & function
Pass
Pass
Fail
On page + renamed script & function
Pass
Pass
Fail
Again, it doesn’t seem that the tweaked setups are doing much work for us here.
Lost data due to “do not track”: <1%
Only Firefox Quantum’s “Tracking Protection,” introduced in February, had any effect on our trackers. Firefox has a 5% market share, but Tracking Protection is not enabled by default. The launch of this feature had no effect on the trend for Firefox traffic on Distilled.net.
Reason 3: Filters
It’s a bit of an obvious one, but filters you’ve set up in your analytics might intentionally or unintentionally reduce your reported traffic levels.
For example, a filter excluding certain niche screen resolutions that you believe to be mostly bots, or internal traffic, will obviously cause your setup to underreport slightly.
Lost data due to filters: ???
Impact is hard to estimate, as setup will obviously vary on a site-by site-basis. I do recommend having a duplicate, unfiltered “master” view in case you realize too late you’ve lost something you didn’t intend to.
Reason 4: GTM vs. on-page vs. misplaced on-page
Google Tag Manager has become an increasingly popular way of implementing analytics in recent years, due to its increased flexibility and the ease of making changes. However, I’ve long noticed that it can tend to underreport vs. on-page setups.
I was also curious about what would happen if you didn’t follow Google’s guidelines in setting up on-page code.
By combining my numbers with numbers from my colleague Dom Woodman’s site (you’re welcome for the link, Dom), which happens to use a Drupal analytics add-on as well as GTM, I was able to see the difference between Google Tag Manager and misplaced on-page code (right at the bottom of the <body> tag) I then weighted this against my own Google Tag Manager data to get an overall picture of all 5 setups.
Effect of GTM and misplaced on-page code
Traffic as a percentage of baseline (standard Google Tag Manager implementation):
Google Tag Manager
Modified & Google Tag Manager
On-Page Code In <head>
Modified & On-Page Code In <head>
On-Page Code Misplaced In <Body>
Chrome
100.00%
98.75%
100.77%
99.80%
94.75%
Safari
100.00%
99.42%
100.55%
102.08%
82.69%
Firefox
100.00%
99.71%
101.16%
101.45%
90.68%
Internet Explorer
100.00%
80.06%
112.31%
113.37%
77.18%
There are a few main takeaways here:
On-page code generally reports more traffic than GTM
Modified code is generally within a margin of error, apart from modified GTM code on Internet Explorer (see note below)
Misplaced analytics code will cost you up to a third of your traffic vs. properly implemented on-page code, depending on browser (!)
The customized setups, which are designed to get more traffic by evading ad blockers, are doing nothing of the sort.
It’s worth noting also that the customized implementations actually got less traffic than the standard ones. For the on-page code, this is within the margin of error, but for Google Tag Manager, there’s another reason — because I used unfiltered profiles for the comparison, there’s a lot of bot spam in the main profile, which primarily masquerades as Internet Explorer. Our main profile is by far the most spammed, and also acting as the baseline here, so the difference between on-page code and Google Tag Manager is probably somewhat larger than what I’m reporting.
I also split the data by mobile, out of curiosity:
Traffic as a percentage of baseline (standard Google Tag Manager implementation):
Google Tag Manager
Modified & Google Tag Manager
On-Page Code In <head>
Modified & On-Page Code In <head>
On-Page Code Misplaced In <Body>
Desktop
100.00%
98.31%
100.97%
100.89%
93.47%
Mobile
100.00%
97.00%
103.78%
100.42%
89.87%
Tablet
100.00%
97.68%
104.20%
102.43%
88.13%
The further takeaway here seems to be that mobile browsers, like Internet Explorer, can struggle with Google Tag Manager.
Lost data due to GTM: 1–5%
Google Tag Manager seems to cost you a varying amount depending on what make-up of browsers and devices use your site. On Distilled.net, the difference is around 1.7%; however, we have an unusually desktop-heavy and tech-savvy audience (not much Internet Explorer!). Depending on vertical, this could easily swell to the 5% range.
Lost data due to misplaced on-page code: ~10%
On Teflsearch.com, the impact of misplaced on-page code was around 7.5%, vs Google Tag Manager. Keeping in mind that Google Tag Manager itself underreports, the total loss could easily be in the 10% range.
Bonus round: Missing data from channels
I’ve focused above on areas where you might be missing data altogether. However, there are also lots of ways in which data can be misrepresented, or detail can be missing. I’ll cover these more briefly, but the main issues are dark traffic and attribution.
Dark traffic
Dark traffic is direct traffic that didn’t really come via direct — which is generally becoming more and more common. Typical causes are:
Untagged campaigns in email
Untagged campaigns in apps (especially Facebook, Twitter, etc.)
Misrepresented organic
Data sent from botched tracking implementations (which can also appear as self-referrals)
It’s also worth noting the trend towards genuinely direct traffic that would historically have been organic. For example, due to increasingly sophisticated browser autocompletes, cross-device history, and so on, people end up “typing” a URL that they’d have searched for historically.
Attribution
I’ve written about this in more detail here, but in general, a session in Google Analytics (and any other platform) is a fairly arbitrary construct — you might think it’s obvious how a group of hits should be grouped into one or more sessions, but in fact, the process relies on a number of fairly questionable assumptions. In particular, it’s worth noting that Google Analytics generally attributes direct traffic (including dark traffic) to the previous non-direct source, if one exists.
Discussion
I was quite surprised by some of my own findings when researching this post, but I’m sure I didn’t get everything. Can you think of any other ways in which data can end up missing from analytics?
Sign up for The Moz Top 10, a semimonthly mailer updating you on the top ten hottest pieces of SEO news, tips, and rad links uncovered by the Moz team. Think of it as your exclusive digest of stuff you don't have time to hunt down but want to read!
https://ift.tt/2LCPWKo
0 notes
Last Seen Blogs

theladylabyrinth
Crown & Ponytail

buttercreamficsx-blog
Buttercream Fics

cray-2-the-z
I SHALL REMAIN UNTITLED

samuel-liasam
Untitled