
Statistics
We looked inside some of the posts by thisisjcuso and here's what we found interesting.
Average Info
Notes Per Post
2K
Likes Per Post
1K
Reblog Per Post
605
Reply Per Post
0
Time Between Posts
21 days
Number of Posts By Type
Photo
14
Video
2
Text
1
Last Seen Tumblr Blogs


Fun Fact
Hackers stole 65M passwords from Tumblr in 2013.
Photo

Week 12
What’s happening??
To be quite honest, this week has been a bit confusing and a bit overwhelming. I’m not quite sure how I can move forward with my project by myself. It was also harder because I had two other assignments to present this week, but now that it is over I can focus more on this project.
What I was able to do last week was download all the midi files I would need for my code. I then had to edit them all down to 12 bars long. I’ve decided to look at the music from four different musicians - Beethoven, Chopin, Debussy and Mozart. The image above is a screenshot of the program I used to edit all of my midi files (Aria Maestosa). I actually love how dodgy it looks but it was really useful and provides me with a lot of information about the song. It also has helped me visualise what data I will need to collect and how to interpret that data. I’m hoping I can make more progress this week and next. I’m looking forward to putting together my ‘final presentation’, I think it will be really fun.
6 notes
·
View notes
Photo

Week 11
Data and Power
We spoke about different works from data artists that explore the idea of power in relation to data. There are people who are in power in many different countries who exploit that or use it in a way that exacerbates already difficult situations (i.e. always Donald Trump). A great example of this type of work, which I really appreciate, is Jonathan Moore’s ‘Artificial Killing Machine’. It is an instillation in which cap guns are hanging from the roof. Data is tracked on drone attacks around the world, collecting the number of casualties and location of the strike. It collects this data in real time and when there are casualties being reported, the cap guns go off, creating a very loud and jarring sound (his data collected from the Bureau of Investigative Journalism).
I also had an opportunity to speak to other people in my class who are also looking into sound analysis and song generation for their final projects. It is nice to know that there are other students in my class that are as worried about this project as I am. Not having a lot of coding behind me, this part of the project is quite difficult. For this week, I am going to focus on gathering the midi files required for the code and edit them to the length I want (12 bars). From there, I’ll be able to create the code that analyses them. In terms of my final output, I originally thought of having the music that is generated correlate to a certain graphic. Since that thought, I have decided that given the time period and my skill level, it would be best for me to focus on getting the code correct and working, generating my songs and their sheet music, and comparing the songs created for the different artists.
I chose this concept because I thought it would be interesting to condense a musicians music into one song, which encapsulates that person’s personality and musical style. The image above is of a small music box that I own from Paris, which plays La Vie En Rose. I was given the idea that my generated pieces of music could be displayed as a music box. My only concern with this is that it would be hard to control the tempo, as it is played with a lever, and music boxes usually have a note limit, usually up to 36 notes. Another thought I had was having vinyl records created of the songs. It would be a really nice way of cementing my work and having a physical element. Ideally, the vinyl would play all three songs after each other (the three songs being the generated music of three different musicians).
I’m looking forward to getting this to work. I think this could be something really special and giving it a tangible aspect might complete the project nicely.
0 notes
Photo

Week 10
Data of the Absurd
We looked at some examples of absurd data to remember humour is an important part of the data vis process.
Firstly, the image I’ve added here was made by myself and one of my classmates. A small activity we did in class was creating a flow chart or diagram of any kind of data collected from pretty much anything - remembering that humour and absurdity is important here. We chose to look at the ‘This is America’ music video by Childish Gambino. We mapped out the different facial expressions made by Childish Gambino, looking at frames of the video in 20 second increments. We created a spectrum of happy to sad, and normal to weird. The smaller images show the frames from 40 seconds in, 1 minute in and 4 minutes in. It was actually really fun to put this together and also let me get to know my classmates a bit better.
We also looked at some examples of absurd data. ‘Exhausting a Crowd’, by Kyle Mcdonald, allows people to make comments and tag areas on the website (https://www.exhaustingacrowd.com/gwangju). The footage is delayed by an hour to prevent anyone knowing the location of the people in the video, so no one can be stalked. Some other cool examples include ‘Geogoo’ by JODI, ‘Sexed Robots’ by Paul Granjon and ‘Photography in Abundance’ by Eric Kessels.
0 notes
Photo

This is a veeeerrrrrryyyy long chart about the different frequencies (Hz) and wavelengths (cms) of music notes. This could inform my process and how the code can interpret the music
apologies for the image quality
1 note
·
View note
Photo


Week 9
Milestone Review
This week everyone presented their ideas for their individual assignments. It was really interesting to see such an array of concepts from the class.
When I started making this wiip I was a little bit anxious and stressed out about the thought of this assignment. I know very little to nothing about coding and have a small amount of experience with data visualisation, especially as art. My ideas in the beginning weren’t grabbing me and I was worried about how my idea will measure up against other people in my class. This one idea I had got me excited but I was unsure on how to proceed.
After talking it over with my teacher, I became a lot more confident about my concept and how to move forward. The presentation went really well and the feedback I got was very helpful. I think I need to be more confident in my work because I think this can become something really great.
The images above are a few screenshots of my wiip board - the landing page and the proof of concept. There are some things I need to consider in terms of the code, but I am positive I can create a well-rounded outcome.
0 notes
Video
tumblr
Processing
This is a small video showing some of my code in action. The code basically involved creating a circle that changes colour and has a slight opacity which follows the direction of the mouse. The background also changes colour and wipes the canvas clear when a key is pressed. I found this really pleasing to look at but it was also very simple to create.
2 notes
·
View notes
Photo

Week 8
Processing
This week we spoke about biofeedback, algorithms and the program Processing.
Biofeedback is the process of gaining greater awareness of many physiological functions of one's own body.
We looked at a number of examples of artists utilising biofeedback. A great example of this is the Eyewriter, by the Ebeling Group. This machine allowed a person to draw digitally by moving their eyes. It was originally made for a person who had lost their physical capabilities but still had full brain function. He used to be really into street art and graffiti. He was able to create more works of art with this machine, with these artworks then being projected onto the side of buildings. The machine worked by tracking the eye’s movements.
Other great examples we observed included ‘Cloud’ by Richard Clarkson, ‘The Political Lamp’ by Parse/Error in 2017, ‘Memorandum for Walking’ by Jacob Rivkin in 2018 and ‘Tempescope’ by Ken Kawamoto.
We then looked into the program Processing which is a simple tool for coding. We learnt about simple code that effects the background colour, size of the canvas, how to include shapes and change their colour, change the result based on actions such as pressing the mouse or a key. It was really interesting and surprisingly simple, but then again we have only scratched the surface. The image above is a bunch of different iterations of code - trying out different colours, shapes and directions.
The thing about looking into other examples of data visualisation is that it reminds me that so many different types of data vis has already been done. I’ve been finding it difficult to think of a topic or information that I would like to collect. It is also hard because I am limited by my skill set but also not being able to leave the house as much. I think this class has given me some food for thought and hopefully I can land on an idea soon.
0 notes
Text
Data Ideas
I’ve been thinking about what I could do for my individual data vis project and it’s a little harder to come up with than I thought. I would love to create a program that collects data in real time, but I wouldn’t know the first thing about creating something like that. These are the ideas I have so far:
One the would be terrible
- development of slang over the years presented as a web
- my dog’s bowel movements
One that would be awesome but too difficult
- a site that tracks movie reviews, aggregating the posters from those movies (also the amount of the review, maybe mapped on a cross axis)
- a program that plays the most frequent note played in famous classical pieces and it played in chronological order
Feasible ideas
- the films as colour palettes
- collecting data from my bedroom - at itemised list of everything I own, how old they are in order of day acquired, size of item, colour
Hopefully I can find a topic or idea that I connect with to use for my project. When I really think about it, there are so many things in the world that can be tracked and used as data from the growth of a single plant to the global flight patterns.
0 notes
Photo
I really like this design - it’s very simple and minimal, and the use of blank spaces emphasises the feeling of a vast space/universe. This makes me think I might be able to create a data art project with data from space relating to stars, planets, space debris or amount of space voyages. The only question is how I would obtain and categorise this data.

No. 564
A new geometric design every day
2K notes
·
View notes
Photo

Week 6
Craft Project
This week we presented our work for our first data project. We are using a wiip board to document our data, processes and final outcome. Group projects can be difficult, especially when people have clashing ideas. Having to do a group project over the internet is even harder, but my group and I have done an awesome job working together. We have all been very helpful and supportive of one another. Over our online class, we heard everyone else speak about their project and had the opportunity to give feedback. We were given some good points from everyone. This included things like emphasising the quilt aesthetic of our final project and including more about the purpose of Instagram, which has since been added to our wiip.
The first image is the landing page of our wiip with our final craft project. The second image is our colour chart that we used to detail the emotions portrayed in the Instagram posts we observed. This was a really interesting and fun process. We discussed how this could be turned into an automated thing, with data being collected from Instagram posts all the time, digitally putting together a quilt. Would love to explore that in the future.
5 notes
·
View notes
Photo


Week 5
Visualising Time
Our first proper online seminar went very well, besides some minor bugs. Time is a human made construct that we all follow without question. However, in the wake of a global pandemic, routines are broken and people are forced to change the way they do things. We spoke about different variations of time and how they are utilised by artists to created beautiful data.
Clock time - the time we all use and follow, broken down into seconds, minutes, hours, days, etc.
Celestial time - tracking the movement of planets, stars, the sun, etc.
Historical time - looking at the events that happened in the past and trusting that those events happened. We as individuals won’t ever know what happened in the past but trust history.
Biological time - looking specifically at the processes of the human body and how it changes over time. An example is shown in the above photos called the ‘Every Day Project’, by Dan Hanna which started in 1991. This projects tracks the ageing process and compresses those results in a short video.
Bullet time - originally created and patented by Warner Bros. for The Matrix movie.
Psychological time - the way time is perceived in the mind of an individual. For example, a personal may feel like a moment lasted 5 minutes when it was only 1 minute; ‘time flies when you’re having fun’.
Internet time - time according to the internet; something we are having to become more used to in this current situation.
0 notes
Photo

Week 4
A New Frontier: Online Learning
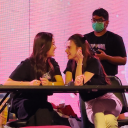
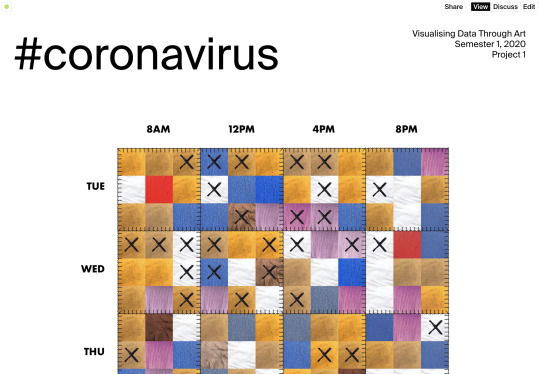
So yesterday was our first attempt at online learning in the wake of the coronavirus pandemic. Even though it is everywhere we look, me and my group decided to delve into it more. We are looking at the social media side of the virus. For the next week, we will be recording data from posts that include #coronavirus at four different times of the day. I am personally looking at posts around 12pm. We are collecting things like, time, emotion, relevance and number of comments.
The most difficult thing about this project will be how we can create a craft item in this situation we are all in. With all non-essential stores closing, there will be no trips to Officeworks or Eckersley’s for supplies. We have been brainstorming ways we can work around this issue and how we can use the items in our own home to create something.We were also introduced to wiip, an online program that works like a website combined with the abilities of google docs, being able to edit with multiple people in real time. This will be a really useful piece of technology for us to share our data exploration with each other and our classmates. So far, I really enjoy the usability of the website and think it is going to be really helpful over the next week.
0 notes
Photo


Week 3
Maps
We looked into the intricacies of maps throughout history. For the activity, we were given a piece of paper and were asked to go outside. We had to draw the inside of our classroom from memory - which was a little harder than I thought. We then had to get in groups and compare our drawings. We were prompted to look at these drawings as if we were archaeologists years and years into the future, trying to figure out what these drawings represent and what they were used for.
The first image shows the groups drawing of the layout of the classroom. The second image is an overall view and combination of the discovered drawings, with expanded views of some of the items. We needed to determine what was included in the drawing and what wasn’t based on the original drawings. For example, along the wall of the majority of drawings was a round object with a ling. We determined that it would’ve been a lamp of some sort. It was an interesting process and a new way to think of the spaces we are in.
The third image is an example of an ancient Chinese map.
[origin] This map of the world was designed for the Second Qing Emperor of Chine, Kangxi (1662-1722) by the Jesuit Father Ferdinand Verbiest (1623 - 1688), in 1674. The map was printed with woodblocks and consists of two hemispheres. It contains information on the size, climate, land forms, customs and history of various parts of the world.
0 notes
Video
tumblr
Week 1
Activity 1: What’s in my bag?
For our first class in Visualising Data Through Art, we were given an activity to get our brains started for the semester. We were asked to empty the contents of our bags and get in groups to then sort our things in a way that told a story.
My team and I chose to sort our things by category (laptop, bottles, wallets, headphones, clothing, etc.) and by age (newest to oldest). We would’ve liked to add another layer to the data by using post-it notes to label what belongs to each person, but unfortunately no one had post-its.
We went through the different groups and they explained their thinking and organisation of objects. Some sorted by colour, value, how essential the item is and fear of loss. It was interesting to see how everyone tackled this little activity but it was also a nice way to break the ice and get to know our fellow classmates. I’m excited to see where this class goes and how it can help inform the way I do things.
I chose this class because I think it will help me when I have to decide what I’d like to do for my final grad show piece this year. Being in third year is already a bit stressful but really exciting.
1 note
·
View note

Photo

Julia Mancuso, Digital Amber, 2019
Resin, Book, Website (HTML, JS)
“Digital Amber” is a comment on the longevity of the physical and transience of the digital. This project is centred on the idea of a book that can withstand time. I explored the relationship between the two through my materials and processes. I’m influenced by one of my favourite artists when completing this task - René Magritte. Magritte was known for his surreal paintings. I love his work in particular because of how he incorporates the surrealistic aspect. It is the subtle nature of the surreal which is what draws me to his paintings. Putting a twist on the ordinary is what I’ve taken from his work.
The process of encasing the book in resin involved layering the resin over time, representing the lasting nature of the physical and comparing it to an ancient artefact that has fossilised. I created a digitised version of the resin book using basic html code paired with javascript, which includes a countdown timer on the site, counting down from 5 minutes, and a timeout code that will redirect the user to another website after the 5 minutes are up. I wanted to challenge this idea that the internet is eternal, and that the physical book is dying out. By making the website timeout, I’m demonstrating that the digital is an evolving medium that is fleeting. By having the book in resin, it freezes it in time and stops the ageing process. Now, the book won’t be able to degrade or deteriorate.
Instagram: jmancuso_design
1 note
·
View note
Photo

Reflection after the Reflection
It’s been a week since the presentation and I’ve had a bit of time to think about what I’ve created. I get really lost in either having to make this amazing physical product or thinking of something really profound and philosophical. Even though it was difficult for me to figure it out, I think I’ve achieved both of these things.
I am so proud of the final outcome. All of the time, money and effort spent was worth it.
I really enjoyed this studio and I’m excited to see what is to come next semester.
(Above is a photo of the resin book, with it’s pages highlighted by the daylight)
0 notes