
Statistics
We looked inside some of the posts by valuewalkposts and here's what we found interesting.
Average Info
Notes Per Post
14
Likes Per Post
13
Reblog Per Post
1
Reply Per Post
0
Time Between Posts
1 month
Number of Posts By Type
Text
17
Last Seen Tumblr Blogs


Fun Fact
Tumblr Inc. is using 66 technologies for its website.
Text
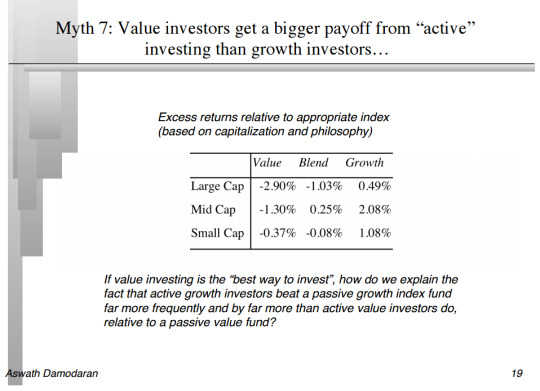
Aswath Damodaran's Seven Myths Of Value
Aswath Damodaran is the Professor of Finance at the Stern School of Business at New York University and is one of the top professors in the school of value investing.
Investors of all experiences can learn a lot from Damodaran’s teachings on value, valuation, and corporate finance. And if you’re interested in learning more, head over ValueWalk’s Aswath Damodaran resource page, which has a selection of his work and authored books.

In this article, I’m covering Aswath Damodaran’s seven myths of value investing, as presented in his presentation, “Where is the “value” in value investing?”, which can be found in full here.
Three faces
Damodaran starts his presentation by covering the three faces of value investing:
1) The Passive Screeners: Investors that take a passive approach to investing, screening the market according to a set of value criteria, buying and holding.
2) Contrarian Investors: Investors that take an active approach, investing in those companies that have fallen out of favor with the market, either because they have/are doing badly, there’s some kind of legal/financial overhang, or their future prospects look bleak.
3) Activist Value Investors: Those investors that take a stake in undervalued companies and push for change. Carl Icahn and Warren Buffett in his early days are key examples.
Then, Damodaran moves on to the three biggest R’s of value investing. These are Rigidity, Righteousness, and Ritualistic. Simply put, these three R’s describe value investors’ emphasis on the same rigid strategies, belief that they are better than everyone else and ritual of reading Ben Graham’s Security Analysis and every Berkshire Hathaway annual report.
Value myth 1
Damodaran’s first myth of value investing is: DCF valuation is an academic exercise.
DCF has become an essential part of calculating intrinsic value for value investors today. (Unlike the value investors of yesteryear, such as Walter Schloss, Ben Graham, Peter Cundill and the Superinvestors of Graham-and-Doddsville who relied upon asset values). But while intrinsic value and DCF calculations have become an essential part of value investing, they have several key flaws.
Damodaran notes three key specific defects. Firstly, if “it”, which, in this case, refers to any factor that may impact the company, does not affect cash flows or alter risk, “it” cannot affect value.
Secondly, for an asset to have value, the expected cash flows have to be positive at some time point the life of the asset.
And lastly: “Assets that generate cash flows early in their life will be worth more than assets that generate cash flows later; the latter may, however, have greater growth and higher cash flows to compensate.”
These are all key issues that could affect the value of the business, but not alter DCF calculations.
Value myth 2
Damodaran’s second myth of value investing is as follows: Beta is greek from geeks…and essential to DCF valuation.
Damodaran picks up to other key points here. Firstly: “The need for diversification does not decrease just because you are a value investor who picks stocks with much research and care.” And secondly: “You can be a good value investor, and your picks can still lose money.”
Value myth number three: The “Margin of Safety” is an alternative to beta and works better.
The margin of safety principle, pioneered by Benjamin Graham has become an essential part of value investing. However, as Damodaran notes, the margin of safety should not be a substitute for risk assessment and intrinsic valuation. Finding a margin of safety could come into play at the end of an investment process, it should be flexible (not a fixed number) to reflect the uncertainties of intrinsic value calculation, and the margin of safety should not be overly conservative.
Value myth number four: Good management = Low Risk.
Sound management teams don’t always guarantee outperformance. In the words of Warren Buffett:
“I try to buy stock in businesses that are so wonderful that an idiot can run them. Because sooner or later, one will.”
Value myth five: Wide moats = Good investments
Moat investing is another key principle of value investing. Companies with wide moats can achieve higher returns on capital, generate more cash for shareholders and will generally outperform non-moat businesses. However, there are two points that investors need to consider with growth investing, and both muddy the water.
Moats matter more for growth companies than mature companies. Wide moats increase company value, although the value increase is proportional to growth at these companies.
Stock returns don’t depend on moats alone but the width of the moat and the rate at which the size of the moat is shrinking/growing. Companies with wide moats can be bad investments if the moat shrinks. While companies with small moats can be good investments if the moat widens. Moreover, companies with no moats can be great investments if a moat stars to appear.
Value myth six: Intrinsic value is stable and unchangeable.
Damodaran notes that there is a belief amongst investors that intrinsic value is a stable, unchanging value. Investors buy and hold, never visiting the intrinsic valuation. Investors view the market as the volatile component in the equation. Multiple factors change almost every day that need to be reflected in an intrinsic value calculation. These include management changes (which can have an effect on reinvestment rates and the return on capital), fluctuating cost of capital and restructuring to improve margins or returns on capital.
And finally myth #7 is
Source
1 note
·
View note
Text
Continued Economic Expansion Ahead
Summary: Remain long equities, be prepared to buy dips, minimise the use of leverage and seek portfolio protection via derivatives where possible.
Q1 hedge fund letters, conference, scoops etc, Also read Lear Capital: Financial Products You Should Avoid?

Equity markets are likely to remain volatile, but the overarching risk of a recession is not high. Volatility will arise as expensive equity markets and deteriorating liquidity conditions (rising central bank rate & decelerating M2 growth) compete with the positive effects of fiscal stimulus (tax cuts) and the fact that real interest remains negative and thus a source of stimulation. The economy remains in its “expansion” phase per our Economic Cycle model, and the probability of recession remains modest. We recommend investors remain long equities, be prepared to buy dips, minimise the use of leverage and seek portfolio protection via derivatives where possible.
In order to begin to become negative on risk assets such as equities, we are looking for the “late cycle” conditions to become prevalent on our Economic Cycle chart, alongside a rising in the Recession Probability to the 70% mark. These factors, along with the evidently tightening liquidity conditions evident in our Leading Economic Indicators, would begin to concern us. At such a time, we will begin to recommend selling risk assets and moving to cash.
The economic cycle is showing continued Economic Expansion phase conditions. Our thesis of a “second wind” for the US economic remains in play.


Recession probability has increased to 44.5% up from 37% in the prior quarter. In the past, recessions have occurred with at least 70% probability of recession on our model. Our view is risks remain low-to-moderate at present.
Market valuation, as measured by the Wilshire 5000 All Cap index divided by GDP is near all time highs making the risk-reward of investment in the market index a weak proposition. Portfolio leverage is NOT advised, use derivatives to hedge the portfolio where possible and be prepared to buy the dips.

As we progress through 2018, Liquidity based Economic Leading Indicators – which are currently negative biased – will increasingly put increasing downward pressure on economic momentum and risk assets. Fed hiking has been consistent whilst slowing M2 growth is a concern. That said, real rates remain negative and fiscal stimulus will begin to flow through national expenditure plans over the remainder of the year. It will take time for the risks of tightening liquidity to materialise in the economy, in our view.
Our stop-loss tool (global market breadth index) has not yet triggered a sell signal.


www.RecessionProtect.com is an organization formed to bring simple, back-tested & rules-based economic analysis to the mass market. No extra fluff.
4 notes
·
View notes
Text
A Closer Look At Ken Griffin's Stocks

A detailed review of Ken Griffin's investing approach and Citadel Advisors' largest holdings which includes SPDR S&P 500 ETF Trust (NYSEARCA: SPY), Amazon.com, Inc. (NasdaqGS: AMZN), and Facebook, Inc. (NasdaqGS: FB).
Ken Griffin’s Knack For Investing
Ken Griffin is the founder and CEO of Chicago-based hedge fund manager, Citadel Investment Group. He is widely recognized as one of the most successful hedge fund managers of the last two decades. Griffin also owns Citadel Securities, a market making firm.
Griffin began trading actively while still an undergraduate at Harvard. He reportedly made big profits in the crash of 1987, at the age of 19. In 1989, after graduating, he joined Frank Meyer’s Glenwood Capital Investments in Chicago. He is believed to have returned 70% on his positions in his first year of trading at Glenwood. The following year, Meyer helped Griffin raise $4.6 million to found Citadel.
Today, Citadel is the second largest multi-strategy hedge fund firm in the world, and manages over $27 billion. Citadel, which employs a staff of over 1,400 individuals, is highly regarded by those wishing to work in the investment industry. In 2015, Griffin said the company would interview 10,000 candidates to fill 300 positions. He also said it was easier to get into Harvard than to get a job at Citadel.
Griffin’s successful career has helped him accumulate a personal fortune of $9.1 billion. He is a prominent and often outspoken political donor and supports candidates and groups that support his belief in a limited government. Griffin is also a prominent art investor – in 2006 he paid $80 million for a Jasper Johns painting, which at the time was the highest price ever paid for a work by a living artist.
A Master of the Business of Money Management
Citadel engages in multiple strategies, including market-making and investing in distressed assets. While Ken Griffin has an enviable personal track record as a trader, Citadel’s success may have more to do with his leadership. The firm emphasizes employing the best talent, investing in the best technology and a focus on risk management and rigorous quantitative analysis. Citadel doesn’t have a particular investing or trading style, but aims to be the best at everything it does.
In a letter to investors, Griffin stressed the role partners and staff have played in Citadel’s success. He stressed the importance of recruiting the best talent, saying, “The early days of Citadel had a constant rhythm: research, problem-solve, program, trade, interview.”
The firm has always invested heavily in technology to give it an edge. In 2009 Citadel turned its IT department into a profit center by spinning it off as a separate company, Citadel Technology.
Citadel manages strategies across multiple asset classes including equities, bonds, credit and commodities. It uses exhaustive quantitative analysis to underpin its strategies in each market. It also runs 500 ‘doomsday scenarios’ each day to stress test its portfolios. The company’s risk management center is reported to have 36 monitors displaying all the firm’s positions.
Citadel is also very opportunistic. Griffin will often buy distressed assets when he believes investors are capitulating. If one looks at some of his notable investments, they often occur when a particular market is in the middle of a large sell-off. Griffin believes that these are the times when sentiment is at its lowest point, creating rare opportunities. In 2006, Citadel bought Amaranth Advisor’s natural gas positions when the fund was in the midst of a high-profile collapse.
Citadel itself ran into trouble in 2008 when liquidity in the convertible bond market dried up. Griffin only managed to save the fund by barring investors from withdrawing their funds. Citadel’s two largest funds finished 2008 down 55 percent, though they did manage to return 62 percent in 2009.
The firm also enters new markets when established players are in trouble. For instance, Citadel entered the energy trading business in the wake of Enron’s collapse. More recently, Griffin hired 17 equity traders and analysts from Visium Asset Management when the company closed down after former traders were charged with fraud.
Citadel consists of autonomous teams that focus on specific strategies and markets. As an aggressive business manager, Griffin will often shut down underperforming units, redeploying the best staff to other teams and retrenching the rest. Earlier this year he dismissed 21 staff members at one of its equity trading desks, Aptigon Capital.
Below I take a look at the hedge fund's largest holdings as revealed in its most recent 13F filing.
Citadel Advisors' Largest Holdings
The Ideas section of finbox.io tracks top investors and trending investment themes. You can get the latest data on the holdings discussed below at the Citadel Advisors page. The following table summarizes the firm's largest holdings reported in the last filing:
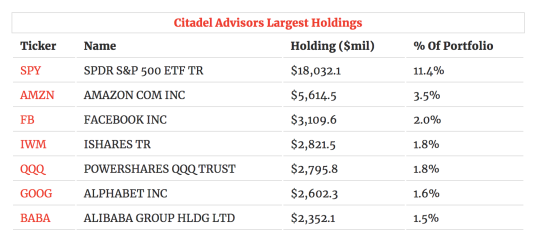
The seven positions above represent 23.5% of the fund's total portfolio. SPDR S&P 500 ETF Trust (NYSEARCA: SPY) is its largest holding with a long position in the ETF worth $18,032.1 million.
Amazon.com, Inc. (Nasdaq: AMZN) is Ken Griffin's second largest position and represents 3.5% of his firm's total portfolio.
Facebook, Inc. Common Stock (Nasdaq: FB) is Citadel Advisors's third largest position and represents 2.0% of his firm's total portfolio.
Managers with more than $100 million in qualifying assets under management are required to disclose their holdings to the SEC each quarter via 13F filings. Qualifying assets include long positions in U.S. equities and ADRs, call/put options, and convertible debt securities. Shorts, cash positions, foreign investments and other assets are not included. It is important to note that these filings are due 45 days after the quarter end date. Therefore, Citadel Advisors's holdings above represent positions held as of December 31st and not necessarily reflective of the fund's current stock holdings.
However, most can agree that with thousands of stocks traded on U.S. exchanges, doing thorough research on each one is nearly impossible for smaller investors. Leveraging the resources of the largest hedge funds on Wall Street can be a powerful way to narrow down the list.
Author: Brian Dentino
Expertise: financial technology, analyzing market trends
Brian is a founder at finbox.io, where he's focused on building tools that make it faster and easier for investors to research stock fundamentals. Brian's background is in physics & computer science and previously worked as a software engineer at GE Healthcare. He enjoys applying his expertise in technology to help find market trends that impact investors.
Brian can be reached at [email protected].
As of this writing, Brian did not hold a position in any of the aforementioned securities and this is not a buy or sell recommendation on any security mentioned.
3 notes
·
View notes
Text
A Look At The Fair Value Of Euronet Worldwide, Inc. (NASDAQ: EEFT)

With the stock down -12.5% over the prior six months, investors may be tempted to sell shares of Euronet Worldwide, Inc. (NASDAQ: EEFT). In this article, I am going to calculate the fair value of Euronet Worldwide by forecasting its future cash flows and discounting them back to today’s value. Investors may find the results of the analysis surprising.
DCF Methodology
The basic philosophy behind a DCF analysis is that the intrinsic value of a company is equal to the future cash flows of that company, discounted back to present value. The general formula is provided below. The intrinsic value is considered the actual value or “true value” of an asset based on an individual’s underlying expectations and assumptions.

Cash flows into the firm in the form of revenue as the company sells its products and services, and cash flows out as it pays its cash operating expenses such as salaries or taxes (taxes are part of the definition for cash operating expenses for purposes of defining free cash flow, even though taxes aren’t generally considered a part of operating income). With the leftover cash, the firm will make short-term net investments in working capital (an example would be inventory and receivables) and longer-term investments in property, plant and equipment. The cash that remains is available to pay out to the firm’s investors: bondholders and common shareholders.
I will take you through my own expectations for Euronet Worldwide as well as explain how I arrived at certain assumptions. The full analysis was completed on Monday, March 19. An updated analysis using real-time data can be viewed in your web browser at finbox.io's Euronet Worldwide DCF analysis page. The steps involved in the valuation are:
1. Forecast Free Cash Flows
Create a revenue forecast
Forecast EBITDA profit margin
Calculate free cash flow
2. Select a discount rate
3. Estimate a terminal value
4. Calculate the equity value
Step 1: Forecast Free Cash Flows
The key assumptions that have the greatest impact on cash flow projections are typically related to growth, profit margin and investments in the business. The analysis starts at the top of the income statement by creating a forecast for revenue and then works its way down to net operating profit after tax (NOPAT), as shown below.

From NOPAT, deduct cash outflows like capital expenditures and investments in net working capital and add back non-cash expenses from the income statement such as depreciation and amortization to calculate the unlevered free cash flow forecast (shown above).
Create A Revenue Forecast
When available, the finbox.io’s pre-built models use analyst forecasts as the starting assumptions. To forecast revenue, analysts gather data about the company, its customers and the state of the industry. I typically review the analysts’ forecast and modify the growth rates based on historical performance, news and other insights gathered from competitors. Note that if a company only has a small number of analysts giving projections, the consensus forecast tends to not be as reliable as companies that have several analysts’ estimates. Another check for reliability is to analyze the range of estimates. If the range is really wide, it may be less accurate.
Euronet Worldwide provides payment and transaction processing and distribution solutions to financial institutions, retailers, service providers, and individual consumers worldwide. The company was founded in 1994 and is headquartered in Leawood, Kansas. Analysts covering the stock often compare the company to a peer group that includes DST Systems, Inc. (NYSE: DST), Global Payments Inc. (NYSE: GPN), Total System Services, Inc. (NYSE: TSS), and Western Union Company (NYSE: WU).

source: Benchmarks: Forecasted 5yr Revenue CAGRs
The company's 5-year revenue CAGR of 12.2% is above its selected comparable public companies: DST (-3.0%), GPN (10.8%) and WU (-0.5%) and only below TSS (22.4%). The company's projected 5-year revenue CAGR of 11.4% is above all of its selected comparable public companies.
As highlighted below, Euronet Worldwide's revenue growth has ranged from 6.5% to 17.8% over the last five fiscal years.

Going forward, analysts forecast that Euronet Worldwide's total revenue will reach $3,869 million by fiscal year 2022 representing a five-year CAGR of 11.4%. However, I conservatively adjusted my growth estimates lower as illustrated in the table below.

1 note
·
View note
Text
Is It Too Late To Buy Tahoe Resources Inc (NYSE: TAHO)?

Tahoe Resources Inc (NYSE: TAHO), a materials company with a market capitalization of $1.5 billion, saw its share price increase by 19.8% over the last month. As a small-cap stock, hardly covered by analysts, there is generally more of an opportunity for mispricing as there is less activity to push the stock closer to fair value. However, could the stock still be trading at a relatively cheap price? Let’s take a look at Tahoe Resources' outlook and value based on its most recent financial data to see if there are any catalysts for a price change.
Is Tahoe Resources Still Cheap?
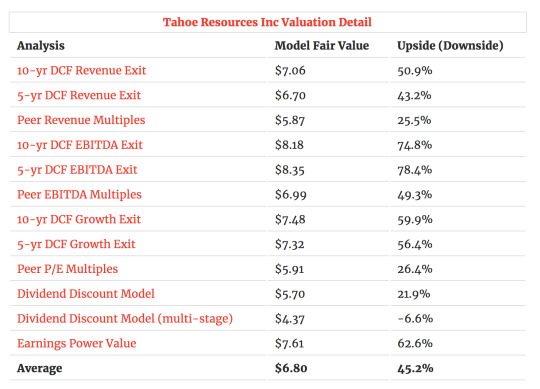
Value investors should be happy! Tahoe Resources is still a bargain right now. According to the valuation below, the intrinsic value for the stock is $6.80 per share, which is above what the market is valuing the company at the moment. This indicates a potential opportunity to buy low.
Tahoe Resources' share price also seems relatively stable compared to the rest of the market, as indicated by its low beta. If you believe the share price should eventually reach its true value, a low beta could suggest it is unlikely to rapidly do so anytime soon, and once it’s there, it may be hard to fall back down into an attractive buying range.
What Does The Future Of Tahoe Resources Look Like?
Investors looking for growth in their portfolio may want to consider the prospects of a company before buying its shares. Buying a great company with a robust outlook at a cheap price is always a good investment, so let’s also take a look at the company’s future expectations.
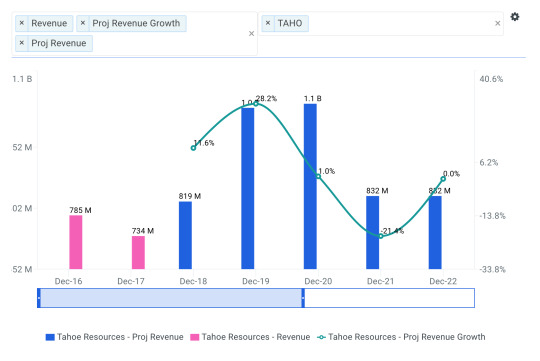
source: finbox.io data explorer
With Tahoe Resources' relatively muted top-line growth of 2.6% expected over the next five years on average, growth doesn’t seem like a key catalyst for a buying decision. At least not in the short to medium-term, unfortunately.
How This Impacts Investors
Although the company's expected future growth is relatively low, shares of Tahoe Resources still appear to be trading at a steep discount to its intrinsic value. Therefore, it may be a great time to purchase the stock or add more to your holdings.
However, there are also other factors to consider that could explain the current undervaluation. I recommend you continue to research Tahoe Resources to get a more comprehensive view of the company by looking at:
Risk Metrics: how is Tahoe Resources' financial health? Find out by viewing our financial leverage data metric which plots the dollars in total assets for each dollar of common equity over time.
Efficiency Metrics: how much free cash flow does Tahoe Resources generate as a percentage of total sales? Has it been increasing or decreasing over time? Review the firm's free cash flow margin here.
Forecast Metrics: what is Tahoe Resources' projected EBITDA margin? Is the company expected to improve its profitability going forward? Analyze the company's projected EBITDA margin here.
Author: Andy Pai
Expertise: financial modeling, mergers & acquisitions
Andy is also a founder at finbox.io, where he's focused on building tools that make it faster and easier for investors to do investment research. Andy's background is in investment banking where he led the analysis on over 50 board advisory engagements involving mergers and acquisitions, fairness opinions and solvency opinions. Some of his board advisory highlights:
Sears Holdings Corp.'s $620 mm spin-off via rights offering of Sears Outlet, Hometown Stores and Sears Hardware Stores.
Cerberus Capital Management's $3.3 bn acquisition of SUPERVALU Inc.'s New Albertsons, Inc. assets.
Andy can be reached at [email protected].
As of this writing, I did not hold a position in any of the aforementioned securities and this is not a buy or sell recommendation on any security mentioned.
0 notes
Text
Should You Buy Tyson Foods, Inc. On Account Of Its P/E Multiple?

Tyson Foods, Inc. (NYSE: TSN) trades at a P/E multiple of 9.6x, which is much lower than the Consumer Staples sector median of 23.0x. While this makes TSN appear like a stock to add to your portfolio, you might change your mind after gaining a better understanding of the assumptions behind the P/E ratio. In this article, I will break down what the P/E ratio is, how to interpret it and what to watch out for.
Understanding Valuation Multiples and the P/E Ratio
A Multiples Valuation, also known as a Comparable Companies Analysis, determines the value of a subject company by benchmarking the subject's financial performance against similar public companies (Peer Group). We can infer if a company is undervalued or overvalued relative to its peers by comparing metrics like growth, profit margin, and valuation multiples.
A P/E Multiple is a valuation ratio that indicates the multiple of earnings investors are willing to pay for one share of a company:
P/E Multiple = Stock Price ÷ Earnings Per Share
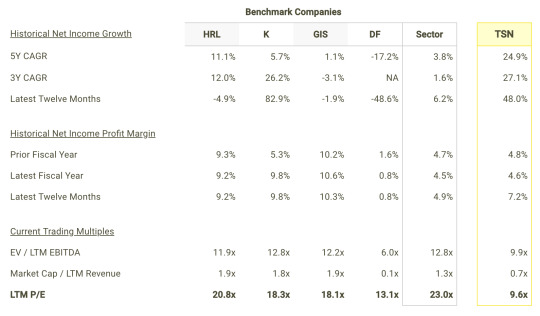
The P/E ratio is not meant to be viewed in isolation and is only useful when comparing it to other similar companies. Since it is expected that similar companies have similar P/E ratios, we can come to some conclusions about the stock if the ratios are different. I compare Tyson's P/E multiple to those of Hormel Foods Corporation (NYSE: HRL), Kellogg Company (NYSE: K), General Mills, Inc. (NYSE: GIS) and Dean Foods Company (NYSE: DF) in the chart below.
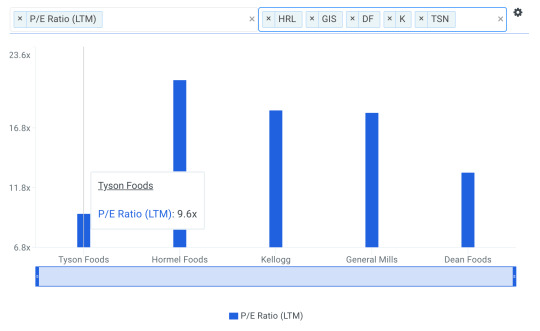
source: finbox.io Benchmarks: P/E Multiples
Since Tyson's P/E of 9.6x is lower than the median of its peers (18.2x), it means that investors are paying less than they should for each dollar of TSN's earnings. As such, our analysis shows that TSN represents an undervalued stock. In fact, finbox.io's P/E Multiple Model calculates a fair value of $129.31 per share which implies 75.4% upside.
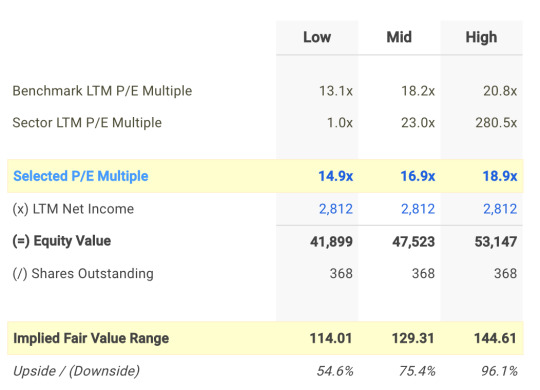
Note that the selected multiple of 16.9x in the analysis above was determined by averaging Tyson's current P/E multiple with its peer group and sector.
Understanding the P/E Ratio's Limitations
Before jumping to the conclusion that Tyson should be added to your portfolio, it is important to understand that our conclusion rests on two important assumptions.
(1) the selected peer group actually contains companies that truly are similar to Tyson, and
(2) the selected peer group stocks are being fairly valued by the market.
If the first assumption is not accurate, the difference in P/E ratios could be due to a variety of factors. For example, if you accidentally compare Tyson with higher growth companies, then its P/E multiple would naturally be lower than its peers since investors reward high growth stocks with a higher price.
source: P/E model
Now if the second assumption does not hold true, Tyson's lower multiple may be because firms in our peer group are being overvalued by the market.
What This Means For Investors
As a shareholder, you may have already conducted fundamental analysis on the stock so its current undervaluation could signal a potential buying opportunity to increase your position in TSN. However, keep in mind the limitations of the P/E ratio when making investment decisions. There are a variety of other fundamental factors that I have not taken into consideration in this article. If you have not done so already, I highly recommend you to complete your research on Tyson by taking a look at the following:
Valuation Metrics: what is Tyson's free cash flow yield and how does it compare to its publicly traded peers? This metric measures the amount of free cash flow for each dollar of equity (market capitalization). Analyze the free cash flow yield here.
Risk Metrics: what is Tyson's CapEx coverage? This is the amount a company outlays for capital assets for each dollar it generates from those investments. View the company's CapEx coverage here.
Efficiency Metrics: inventory turnover is a ratio that measures the number of times a company's inventory is sold and replaced over the year. View Tyson's inventory turnover here.
Author: Matt Hogan
Expertise: Valuation, financial statement analysis
Matt Hogan is also a co-founder of finbox.io. His expertise is in investment decision making. Prior to finbox.io, Matt worked for an investment banking group providing fairness opinions in connection to stock acquisitions. He spent much of his time building valuation models to help clients determine an asset’s fair value. He believes that these same valuation models should be used by all investors before buying or selling a stock.
His work is frequently published at InvestorPlace, Benzinga, ValueWalk, AAII, Barron's, Seeking Alpha and investing.com.
Matt can be reached at [email protected].
As of this writing, I did not hold a position in any of the aforementioned securities and this is not a buy or sell recommendation on any security mentioned.
1 note
·
View note
Text
Should You Sell Henry Schein, Inc. (NASDAQ: HSIC) At Its Current P/E Multiple?

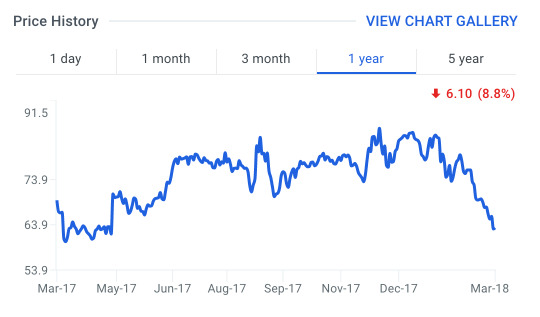
Henry Schein, Inc. (NASDAQ: HSIC) trades at a P/E multiple of 25.7x, which is lower than the Healthcare sector median of 31.7x. While this makes HSIC appear like a stock to add to your portfolio, you might change your mind after gaining a better understanding of the assumptions behind the P/E ratio. In this article, I will break down what the P/E ratio is, how to interpret it and what to watch out for.
Understanding Valuation Multiples and the P/E Ratio
A Multiples Valuation, also known as a Comparable Companies Analysis, determines the value of a subject company by benchmarking the subject's financial performance against similar public companies (Peer Group). We can infer if a company is undervalued or overvalued relative to its peers by comparing metrics like growth, profit margin, and valuation multiples.
A P/E Multiple is a valuation ratio that indicates the multiple of earnings investors are willing to pay for one share of a company:
P/E Multiple = Stock Price ÷ Earnings Per Share
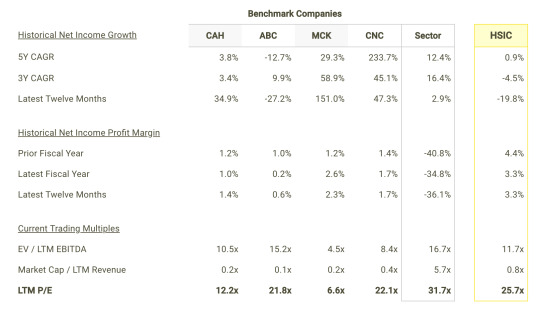
The P/E ratio is not meant to be viewed in isolation and is only useful when comparing it to other similar companies. Since it is expected that similar companies have similar P/E ratios, we can come to some conclusions about the stock if the ratios are different. I compare Henry Schein's P/E multiple to those of Cardinal Health, Inc. (NYSE: CAH), AmerisourceBergen Corporation (Holding Co) (NYSE: ABC), McKesson Corporation (NYSE: MCK) and Centene Corporation (NYSE: CNC) in the chart below.
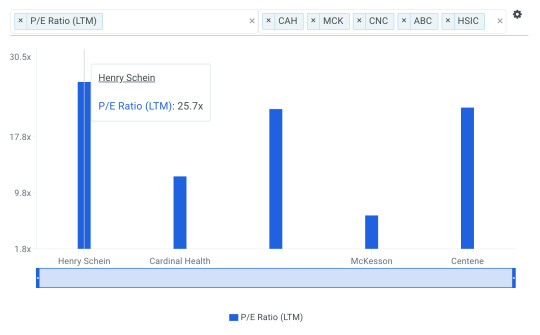
source: finbox.io Benchmarks: P/E Multiples
Since Henry Schein's P/E of 25.7x is higher than the median of its peers (17.0x), it means that investors are paying more than they should for each dollar of HSIC's earnings. As such, our analysis shows that HSIC represents an overvalued stock. In fact, finbox.io's P/E Multiple Model calculates a fair value of $58.16 per share which implies -14.5% downside.
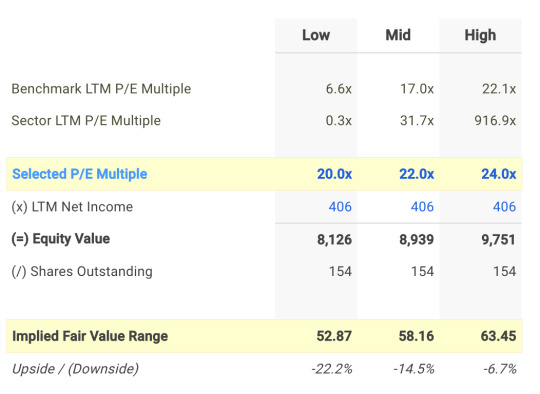
Note that the selected multiple of 22.0x in the analysis above was determined by averaging Henry Schein's current P/E multiple with its peer group and sector.
Understanding the P/E Ratio's Limitations
Before jumping to the conclusion that Henry Schein should be banished from your portfolio, it is important to understand that our conclusion rests on two important assumptions.
(1) the selected peer group actually contains companies that truly are similar to Henry Schein, and
(2) the selected peer group stocks are being fairly valued by the market.
If the first assumption is not accurate, the difference in P/E ratios could be due to a variety of factors. For example, if you accidentally compare Henry Schein with lower growth companies, then its P/E multiple would naturally be higher than its peers since investors reward high growth stocks with a higher price.
source: P/E model
Now if the second assumption does not hold true, Henry Schein's higher multiple may be because firms in our peer group are being undervalued by the market.
What This Means For Investors
As a shareholder, you may have already conducted fundamental analysis on the stock so its current overvaluation could signal a potential selling opportunity to reduce your exposure to HSIC. However, keep in mind the limitations of the P/E ratio when making investment decisions. There are a variety of other fundamental factors that I have not taken into consideration in this article. If you have not done so already, I highly recommend you to complete your research on Henry Schein by taking a look at the following:
Valuation Metrics: how much upside do shares of Henry Schein have based on Wall Street's consensus price target? Take a look at our analyst upside data explorer that compares the company's upside relative to its peers.
Risk Metrics: how is Henry Schein's financial health? Find out by viewing our financial leverage data metric which plots the dollars in total assets for each dollar of common equity over time.
Efficiency Metrics: return on equity is used to measure the return that a firm generates on the book value of common equity. View Henry Schein's return on equity here.
Author: Andy Pai
Expertise: financial modeling, mergers & acquisitions
Andy is also a founder at finbox.io, where he's focused on building tools that make it faster and easier for investors to do investment research. Andy's background is in investment banking where he led the analysis on over 50 board advisory engagements involving mergers and acquisitions, fairness opinions and solvency opinions. Some of his board advisory highlights:
Sears Holdings Corp.'s $620 mm spin-off via rights offering of Sears Outlet, Hometown Stores and Sears Hardware Stores.
Cerberus Capital Management's $3.3 bn acquisition of SUPERVALU Inc.'s New Albertsons, Inc. assets.
Andy can be reached at [email protected].
As of this writing, I did not hold a position in any of the aforementioned securities and this is not a buy or sell recommendation on any security mentioned.
0 notes
Text
Why Steven Cohen Increased His US Concrete Stake By 64%

A schedule 13G filing with the SEC on Friday evening revealed that Steven Cohen increased his stake in U.S. Concrete, Inc. (Nasdaq: USCR) by $20.7 million. With the stock down -16.4% in the last month, it's worth taking a closer look at the company.
Point72 Adds To Its US Concrete Stake
On February 14th, Steven Cohen's firm Point72 Asset Management filed its quarterly Form 13F with the SEC. The filing showed that the investment firm held 529,956 shares of US Concrete worth $44.3 million as of December 31st.
However, a new filing on Friday revealed that Point72 Asset Management purchased an additional 337,927 shares bringing the hedge fund's total ownership stake to 867,883 shares worth roughly $53.1 million. This also represents 5.2% of US Concrete's total equity.
The company's shares last traded at $61.15 as of Monday afternoon, down -16.4% over the last month. Could the recent buying activity signal a promising road ahead while the stock trades near its 52-week low?
source: finbox.io
Potential Reasons For Adding Shares
US Concrete produces and sells ready-mixed concrete, aggregates, and concrete-related products and services to the construction industry in the United States and Canada. It primarily serves concrete sub-contractors, general contractors, governmental agencies, property owners and developers, architects, engineers, and home builders. Wall Street analysts covering the stock often compare the company to a peer group that includes Eagle Materials (NYSE: EXP), Vulcan Materials (NYSE: VMC), Summit Materials (NYSE: SUM) and Martin Marietta Materials (NYSE: MLM). Analyzing US Concrete's valuation metrics and ratios relative to peers provides further insight into why Point72 Asset Management purchased shares.
A company's projected 5-year EBITDA CAGR is the average annual growth rate of EBITDA over a five year period. It's calculated as follows:
5yr CAGR = [ EBITDA FY+5 / EBITDA FY ] ^ (1/5 years) - 1
The chart below plots the five year EBITDA compounded annual growth rate for US Concrete and its peers.
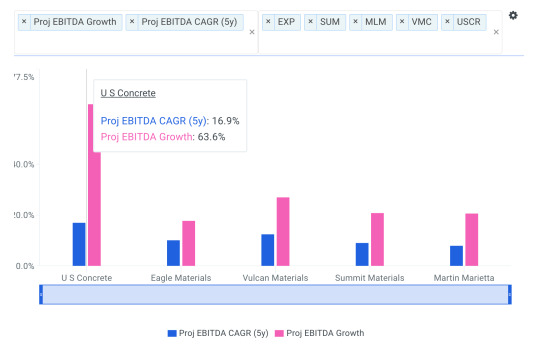
source: finbox.io
The company's projected 5-year EBITDA CAGR of 16.9% is above all of its selected comparable public companies: EXP (10.1%), VMC (12.4%), SUM (9.0%) and MLM (7.9%). In addition, US Concrete's 1-year projected EBITDA growth of 63.6% is also well above all of its peers.
A company's EBITDA multiple is calculated by dividing its Enterprise Value by EBITDA and is often used to benchmark the fair market value of a company. Its key benefit over the P/E multiple is that it's capital structure-neutral, and, therefore, better at comparing companies with different levels of debt.
High growth stocks typically trade at higher valuation multiples. However, this does not appear to be the case as illustrated in the chart below.
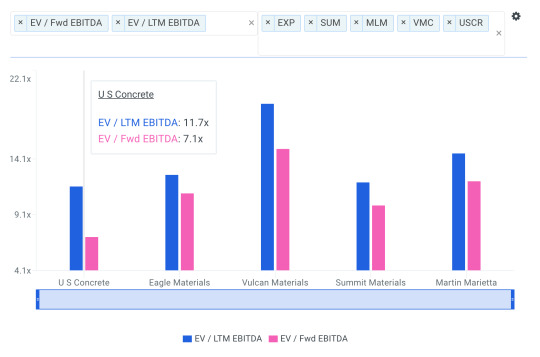
source: finbox.io
US Concrete's LTM EBITDA multiple of 11.7x is below all of its selected comparable public companies. Furthermore, its forward EBITDA multiple of 7.1x is also below the entire peer group. This make's the company's shares highly attractive purely on a relative valuation approach.
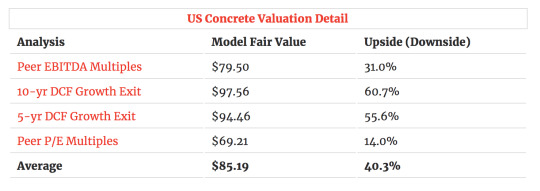
In addition, finbox.io's average fair value estimate of $85.19 implies 40.3% upside and is calculated from 4 valuation models as shown in the table below. Each analysis uses consensus Wall Street estimates for the projections when available.
US Concrete shares have traded lower over the last month and the stock now appears to be trading at a significant discount to its intrinsic value. This could be a reason why Steven Cohen's hedge fund is adding to his stake in the company.
However, it is important to note that investors should never blindly copy the trading activity of illustrious money managers such as Mr. Cohen. However, keeping an eye on their buying and selling activity will help in making a more informed investment decision.
I recommend investors continue their research on US Concrete to get a more comprehensive view of the company.
Author: Andy Pai
Expertise: financial modeling, mergers & acquisitions
Andy is also a founder at finbox.io, where he's focused on building tools that make it faster and easier for investors to do investment research. Andy's background is in investment banking where he led the analysis on over 50 board advisory engagements involving mergers and acquisitions, fairness opinions and solvency opinions. Some of his board advisory highlights:
Sears Holdings Corp.'s $620 mm spin-off via rights offering of Sears Outlet, Hometown Stores and Sears Hardware Stores.
Cerberus Capital Management's $3.3 bn acquisition of SUPERVALU Inc.'s New Albertsons, Inc. assets.
Andy can be reached at [email protected].
As of this writing, I did not hold a position in any of the aforementioned securities and this is not a buy or sell recommendation on any security mentioned.
0 notes
Text
At $35.50 Per Share, Is Twitter Inc (NYSE: TWTR) A Buy?

Twitter, Inc (NYSE: TWTR), a highly followed social media firm with a market capitalization of $26.6 billion, saw its share price increase by 44.2% over the prior three months. As a large-cap stock with high coverage by analysts, you could assume any recent changes in the company’s outlook is already priced into the stock. But is there still an opportunity here to buy? I examine Twitter's valuation and outlook in more detail to determine if there’s still a buying opportunity.
Is There An Opportunity In Twitter?
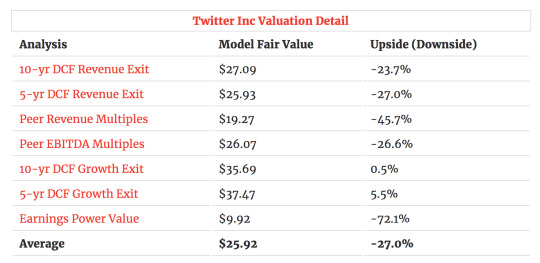
Twitter appears to be overvalued by -27.0% at the moment, based on 7 separate valuation models. The stock is currently trading at $35.51 on the market compared to our average intrinsic value of $25.92. This means that the buying opportunity has probably disappeared for now.
source: finbox.io
Furthermore, Twitter's share price also seems relatively stable compared to the rest of the market as indicated by its low beta of 0.61. If you believe the share price should eventually reach its true value, a low beta could suggest it is unlikely to rapidly do so anytime soon. And once it’s there, it may be hard to fall back down into an attractive buying range.
Can We Expect Growth From Twitter?
Future outlook is an important aspect when you’re looking at buying a stock, especially if you are an investor looking for growth in your portfolio. Although value investors would argue that it’s the intrinsic value relative to the price that matters the most, a more compelling investment thesis would be high growth potential at a cheap price.
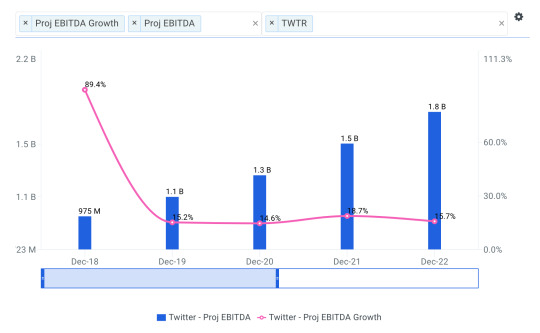
source: finbox.io data explorer
With EBITDA expected to grow on average of 28.0% over the next couple years, the future certainly appears bright for Twitter. It looks like higher cash flows are in the cards for shareholders, which should feed into a higher share valuation.
What This Means For Investors
Many investors separate stocks into value and growth categories based on quantitative metrics. However, one of the most famous investors in the world views this as foolish. In Warren Buffett's 1992 letter to Berkshire Hathaway Inc. (NYSE: BRK.B) shareholders, Buffett touches upon a subject at odds with much of the investment industry:
"Most analysts feel they must choose between two approaches customarily thought to be in opposition: 'value' and 'growth.' Indeed, many investment professionals see any mixing of the two terms as a form of intellectual cross-dressing.
We view that as fuzzy thinking… In our opinion, the two approaches are joined at the hip: Growth is always a component in the calculation of value, constituting a variable whose importance can range from negligible to enormous and whose impact can be negative as well as positive."
While investors tend to categorize stocks into value and growth, some of the most successful investors view growth as simply one component of a company's value. Twitter has positioned itself so that double-digit growth appears to be a reasonable assumption for the foreseeable future. However, this growth does not look highly attractive at current trading levels. As such, investors may want to hold off on buying or adding to their TWTR position for the time being.
I recommend you continue to research Twitter to get a more comprehensive view of the company by looking at:
Risk Metrics: what is Twitter's cash ratio which is used to assess a company's short-term liquidity. View the company's cash ratio here.
Efficiency Metrics: return on equity is used to measure the return that a firm generates on the book value of common equity. View Twitter's return on equity here.
Forecast Metrics: what is Twitter's projected EBITDA margin? Is the company expected to improve its profitability going forward? Analyze the company's projected EBITDA margin here.
Author: Brian Dentino
Expertise: financial technology, analyzing market trends
Brian is a founder at finbox.io, where he's focused on building tools that make it faster and easier for investors to research stock fundamentals. Brian's background is in physics & computer science and previously worked as a software engineer at GE Healthcare. He enjoys applying his expertise in technology to help find market trends that impact investors.
Brian can be reached at [email protected].
As of this writing, Brian did not hold a position in any of the aforementioned securities and this is not a buy or sell recommendation on any security mentioned.
0 notes
Text
Is It Time To Sell RealPage, Inc (NASDAQ: RP)?

New form 4 filings with the SEC have revealed that RealPage, Inc. (RP) insiders have been selling large quantities of stock since September. With shares up 31.8% in the last six months, it’s worth taking a closer look at whether it’s time to exit.
Insider Selling: RealPage
A number of top executives and investors have been selling shares of RealPage (Nasdaq: RP) according to filings with the SEC including Stephen Winn (Chairman & CEO), Seren Capital (10% owner), David Monk (EVP) and others. Total insider selling has totaled $138.2 million since September which is approximately 3.1% of RealPage’s total market capitalization. Not an insignificant amount.
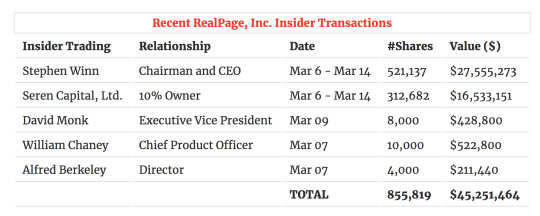
Note that Stephen Winn is the sole manager and president of Seren Capital. Mr. Winn’s sales were also effected pursuant to a Rule 10b5-1 trading plan. However, selling nearly $140 million worth of shares since September is a fairly large figure relative to the company’s total equity value.
Why Are Insiders Selling Shares?
RealPage provides software and data analytics for the real estate industry in the United States. Analysts covering the stock often compare the company to a peer group that includes Guidewire Software (NYSE: GWRE), Tyler Technologies (NYSE: TYL), Ellie Mae(NYSE: ELLI) and Black Knight Financial Services (NYSE: BKI). Analyzing RealPage’s valuation metrics and ratios relative to its peers provides further insight into why insiders may be selling their shares.
EBITDA margin or Earnings before Interest, Taxes, Depreciation and Amortization margin measures the portion of revenue a company converts to earnings. It is a strong measure of a company’s pricing power and capital efficiency. All else equal, companies with higher EBITDA margins command higher valuation multiples.
The company’s EBITDA margin of 15.6% only above GWRE (5.7%) and below TYL (25.6%), ELLI (20.7%) and BKI (44.9%).
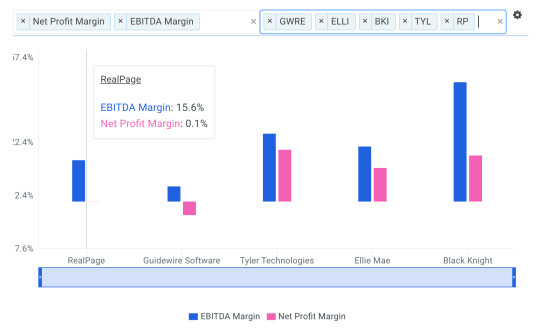
source: finbox.io
Net Profit Margin is defined as Net Income / Total Revenue. All else equal, companies with higher profit margins command higher valuation multiples. RealPage’s net profit margin of 0.1% is also below the majority of its peers.
Return on Equity (ROE) measures a company’s profitability in relation to the book value of Shareholders’ Equity. ROE is a measure of how effectively management makes investments to generate earnings for shareholders. RealPage’s ROE of 0.1% is below the majority of its peers as illustrated in the chart below.
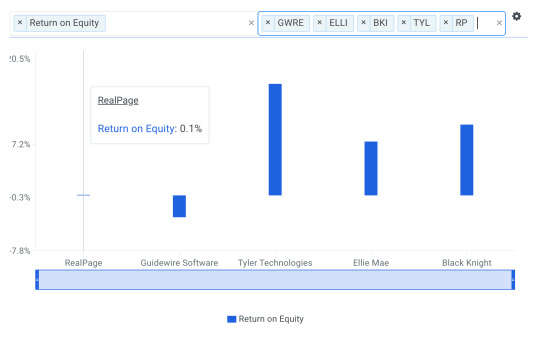
source: finbox.io
RealPage’s management appears to be underperforming relative to peers in terms of operating margins and shareholder returns.
RealPage’s Stock Price and Valuation
The company’s shares last traded at $52.75 as of Thursday, up 46.1% over the last year and near its all-time high. While the stock has made impressive gains, the recent insider transactions could signal a troubling road ahead for shareholders.
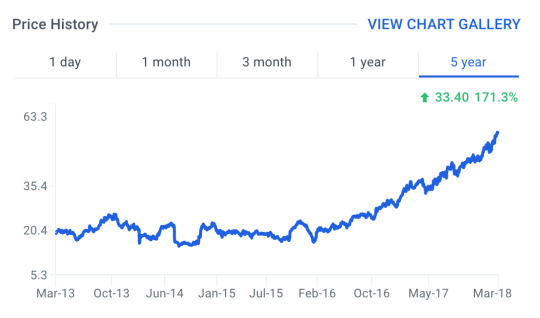
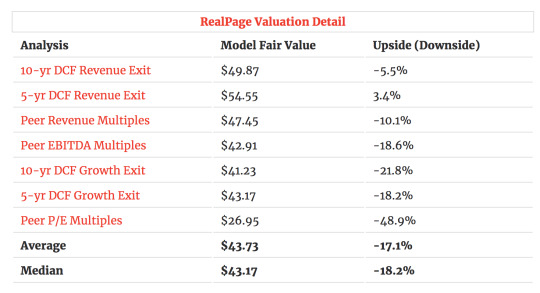
In addition, a number of finbox.io’s valuation analyses calculate an average fair value estimate of $43.73 per share. This implies -17.1% downside and is calculated from 7 valuation models as shown in the table below. Each analysis uses consensus Wall Street estimates for the projections when available.
While individual buys and sells among insiders is not necessarily noteworthy, a major trend in buying or selling by corporate insiders could provide useful insights into the future prospects of a company. It certainly appears noteworthy as a number of RealPage insiders are selling shares. Investors may want to take a closer look.
Author: Andy Pai
Expertise: financial modeling, mergers & acquisitions
Andy is also a founder at finbox.io, where he’s focused on building tools that make it faster and easier for investors to do investment research. Andy’s background is in investment banking where he led the analysis on over 50 board advisory engagements involving mergers and acquisitions, fairness opinions and solvency opinions. Some of his board advisory highlights:
Sears Holdings Corp.’s $620 mm spin-off via rights offering of Sears Outlet, Hometown Stores and Sears Hardware Stores.
Cerberus Capital Management’s $3.3 bn acquisition of SUPERVALU Inc.’s New Albertsons, Inc. assets.
Andy can be reached at [email protected].
As of this writing, I did not hold a position in any of the aforementioned securities and this is not a buy or sell recommendation on any security mentioned.
0 notes
Text
Does Canadian Pacific Railway's (NYSE: CP) PE Multiple Signal A Buying Opportunity?

Canadian Pacific Railway Limited (NYSE: CP) trades at a P/E multiple of 13.8x, which is lower than the Industrials sector median of 22.9x. While this makes CP appear like a stock to add to your portfolio, you might change your mind after gaining a better understanding of the assumptions behind the P/E ratio. In this article, I will break down what the P/E ratio is, how to interpret it and what to watch out for.
Understanding Valuation Multiples and the P/E Ratio
A Multiples Valuation, also known as a Comparable Companies Analysis, determines the value of a subject company by benchmarking the subject's financial performance against similar public companies (Peer Group). We can infer if a company is undervalued or overvalued relative to its peers by comparing metrics like growth, profit margin, and valuation multiples.
A P/E Multiple is a valuation ratio that indicates the multiple of earnings investors are willing to pay for one share of a company:
P/E Multiple = Stock Price ÷ Earnings Per Share
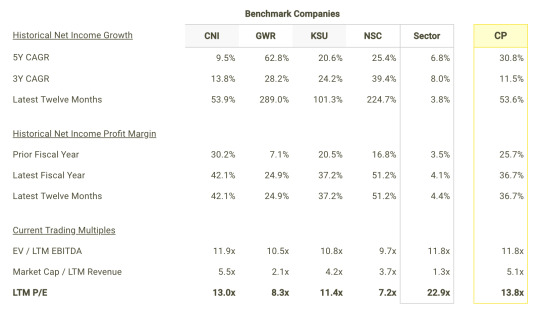
The P/E ratio is not meant to be viewed in isolation and is only useful when comparing it to other similar companies. Since it is expected that similar companies have similar P/E ratios, we can come to some conclusions about the stock if the ratios are different. I compare Canadian Pacific Railway's P/E multiple to those of Canadian National Railway Company (NYSE: CNI), Genesee & Wyoming, Inc. (NYSE: GWR), Kansas City Southern (NYSE: KSU) and Norfolk Southern Corporation (NYSE: NSC) in the chart below.
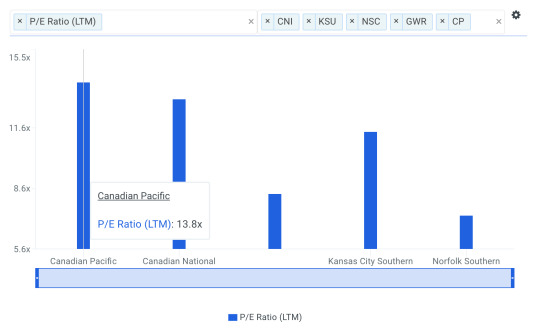
source: finbox.io Benchmarks: P/E Multiples
Since Canadian Pacific Railway's P/E of 13.8x is higher than the median of its peers (9.9x), it means that investors are paying more than they should for each dollar of CP's earnings. As such, our analysis shows that CP represents an overvalued stock. In fact, finbox.io's P/E Multiple Model calculates a fair value of $147.14 per share which implies -16.8% downside.
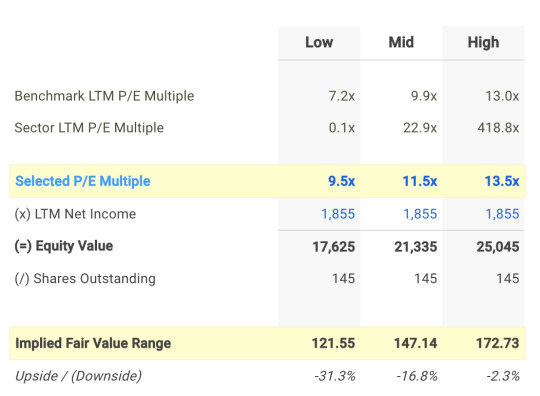
Note that the selected multiple of 11.5x in the analysis above was determined by comparing Canadian Pacific Railway's current P/E multiple with its peer group. Canadian Pacific Railway's financial characteristics look most comparable to Kansas City Southern so I took that into consideration as well. Kansas City Southern currently trades at 11.4x earnings as illustrated in more detail below.
Understanding the P/E Ratio's Limitations
Before jumping to the conclusion that Canadian Pacific Railway should be banished from your portfolio, it is important to understand that our conclusion rests on two important assumptions.
(1) the selected peer group actually contains companies that truly are similar to Canadian Pacific Railway, and
(2) the selected peer group stocks are being fairly valued by the market.
If the first assumption is not accurate, the difference in P/E ratios could be due to a variety of factors. For example, if you accidentally compare Canadian Pacific Railway with lower growth companies, then its P/E multiple would naturally be higher than its peers since investors reward high growth stocks with a higher price.
source: P/E model
Now if the second assumption does not hold true, Canadian Pacific Railway's higher multiple may be because firms in our peer group are being undervalued by the market.
What This Means For Investors
As a shareholder, you may have already conducted fundamental analysis on the stock so its current overvaluation could signal a potential selling opportunity to reduce your exposure to CP. However, keep in mind the limitations of the P/E ratio when making investment decisions. There are a variety of other fundamental factors that I have not taken into consideration in this article. If you have not done so already, I highly recommend you to complete your research on Canadian Pacific Railway by taking a look at the following:
Risk Metrics: what is Canadian Pacific Railway's asset efficiency? This ratio measures the amount of cash flow that a company generates from its assets. View the company's asset efficiency here.
Efficiency Metrics: fixed asset turnover is calculated by dividing revenue by average fixed assets. View Canadian Pacific Railway's fixed asset turnover here.
Forecast Metrics: what is Canadian Pacific Railway's projected EBITDA margin? Is the company expected to improve its profitability going forward? Analyze the company's projected EBITDA margin here.
Author: Brian Dentino
Expertise: financial technology, analyzing market trends
Brian is a founder at finbox.io, where he's focused on building tools that make it faster and easier for investors to research stock fundamentals. Brian's background is in physics & computer science and previously worked as a software engineer at GE Healthcare. He enjoys applying his expertise in technology to help find market trends that impact investors.
Brian can be reached at [email protected].
As of this writing, Brian did not hold a position in any of the aforementioned securities and this is not a buy or sell recommendation on any security mentioned.
0 notes
Text
Will Bitcoin Price Ever Be Too Hot?
Unless you’ve been living under a rock, you most likely know that bitcoin price has been flying high for the entire year. Most recently a surge in price has seen the price of bitcoin catapult from $10,000 to over $15,000 btc/usd in no more than a single week so far. At the time of this article, the price of bitcoin is hovering around $16,840. This is a more than 2,000% increase compared to where the currency was just one year ago.

Without question, cryptocurrencies are benefiting in a large way from this newly found attention on digital currencies. Even other cryptocurrencies like Litecoin and Ethereum have enjoyed healthy price movement during the last few weeks. Litecoin, for instance, has moved up in price from under $7 in March to more than $300 this month.
Furthermore, the price of ethereum was under $15 in February of this year and now its value is above $600. But there are still many barriers to entry for mainstream players, believe it or not. The risks of opening an unregulated trading account in an unregulated industry means that one single cryptocurrency hack can completely wipe out someone’s purse of cryptocurrencies.
In fact, it has been speculated that some $64 million in bitcoin has been stolen by hackers who broke into bitcoin mining marketplace, NiceHash. Events like this continue to keep mainstream, conservative investors away from what could be one of the healthiest market booms of the decade.
Billionaire investor, Warren Buffett is very much against cryptocurrency. He’s been put on record saying, “"Stay away from it. It's a mirage, basically...The idea that it has some huge intrinsic value is a joke in my view." But in spite of this, many tech-focused figureheads are rallying behind the decentralized currency market and stocks have soon followed. Right now, there is a mining boom going on and it has nothing to do with picks or shovels.
Take, for instance, Riot Blockchain (RIOT). This stock has enjoyed a very healthy rise in price ever since “transforming into a strategic investor and operator of blockchain technologies.” In fact, since late September, shares of Riot have increased in price from $4.27 to as high as $33.27 this week. Currently, shares are trading around $25.
Digital Power Corporation (DPW) has also benefited greatly from the bitcoin boom. On November 22, shares of the company were trading at $0.56 and this week, the stock price has seen a rise to highs of $5.95. Rumors were apparently floating around that the company was to do business with Amazon, the global online conglomerate. These rumors ended up having no basis as the company made a direct announcement to address the topic on December 6. What management did do, however is raise their revenue guidance 50% from their prior estimates for 2018.
Digital Power expects to report growth in comprehensive income based on the appreciation of its securities held for resale on its balance sheet. Further, revenue expectations are said to be in the ballpark of $36million to $38 million for 2018. This is up from the original expectation of $25 million, which was made previously.
One of the most “notorious” players in the space John McAfee heads up MGT Capital Investments (MGTI) is targeting the bitcoin mining space. MGT recently executed a new purchase order with Bitmain Technologies for an additional 500 S9 Antminer mining rigs, with shipment expected early in the first quarter of 2018.
The importance of this release is that it puts the company one step closer to its goal of having over 5,000 Bitmain S9’s for its mining operations. At this level, the company is anticipating that its EBITDA from mining operations will be somewhere around $2 million per month.
Of course, this was on December 6th. Since then, Bitcoin prices have skyrocketed even further. As many can also see, this move from cryptocurrencies has bolstered new attention from traditional markets as well. The CBOE (CBOE) begun trading bitcoin futures this week and the ticker is “XBT”. Furthermore, rival CME Group (CME) has also said that it will begin handling bitcoin futures contacts beginning on Dec. 18th.

Even Nasdaq (NDAQ) has reported to sources that it plans kick off its own bitcoin futures in 2018. As far as online brokers are concerned, both TD Ameritrade (AMTD) and Ally Financial (ALLY) have said that they will make bitcoin futures available to their customers.
This now begs the question: Who will adopt bitcoin currency as a form of payment and not just a tradable “thing”? Online shopping site, Overstock.com (OSTK) has long been in support of bitcoin and a decentralized payment option. The company has even come out to say that it will keep as much as half of the bitcoin it receives as a store.
In addition to this, Square (SQ) has also made a move into the space to get in on the action. The payment processing company announced in November that it is experimenting with an option for some users of its Cash app to purchase bitcoin.
For now, there seems to be two types of people with very little in between: those is vast support of it like Goldman Sachs’ (GS) Lloyd Blankfein & PayPal’s (PYPL) Peter Thiel and then there are those who are in direct disagreement with cryptocurrency having any value like Berkshire Hathaway’s (BRK-A) Warren Buffett. What side of the fence are you on?
2 notes
·
View notes
Text
Adrangi’s Kerrisdale Capital Doubles Down On Its Top Stock
Sahm Adrangi’s Kerrisdale Capital has doubled down on its position in Luxoft, which is now 20% of the firm’s portfolio. Adrangi shared his thesis exclusively with ValueWalk and explained in an interview why he feels Luxoft is such an attractive opportunity.

Sahm Adrangi doubles down on Luxoft after downward guidance revision
Luxoft is scheduled to release its next earnings report on Nov. 16, but the company’s stock took a hit last quarter when it revised forward guidance downwards due to slowing growth. Management lowered fiscal 2018 guidance for revenue from $943 million to $920 million and for earnings per share from $3.26 to $2.85, due to declines at Luxoft’s largest customers. Luxoft stock plunged after the revision in August and has never recovered, falling from above $60 per share to closer to $45 per share.
Kerrisdale Capital, which has about $150 million in assets under management, has held Luxoft shares since the first quarter of 2015, but Adrangi tells ValueWalk that they doubled their position during the third quarter because the stock’s decline made it an attractive opportunity. He feels the sell-off was greatly overdone and that Luxoft is attractive over the long term because of its competitive advantage in high end IT application development.
Instead of focusing on the most basic types of software development, such as building websites, Luxoft offers more complex programming services such as development of self-driving technology, custom client relationship management portals and infotainment systems for vehicles.
“Over the long term we think that for these IT outsourcers that focus on high-end application development, there is a lot of demand for their services. As every company and industry digitizes every function of both their client-facing and internal infrastructure, there’s a limited number of developers graduating from U.S. colleges that can meet that demand. So Fortune 500 companies have to look abroad, and particularly to Eastern Europe where some of the most advanced software engineers are,” Adrangi tells ValueWalk.
Two IT services firms trade spots in Kerrisdale’s portfolio
Adrangi was attracted to Luxoft because of its similarities with Cognizant, which was once Kerrisdale Capital’s second largest holding. In fact, he sees Luxoft as being similarly positioned as Cognizant a decade ago in terms of opportunity and growth trajectory, and Luxoft has traded places with Cognizant in Kerrisdale’s portfolio. The firm has been gradually selling off its stake in Cognizant, and Adrangi explained to ValueWalk why these two IT services have traded positions in his view. Part of the reason boils down to the type of programming they do, while the other part is due to valuation.
“When we talk about Luxoft, we refer to Cognizant because of the growth trajectory,” he clarifies. “It was the size of Luxoft 15 years ago, and since then the stock has gone up 30 times. The reason it has done so well is there’s just a lot of demand out there for developer work, but today that demand is more at the high end versus some of the more basic, commodity type of IT outsourcing.”
One of the ways the firm has differentiated itself from other IT services firms is through its focus on highly-experienced programmers in Central and Eastern Europe, which produce almost 1 million engineering graduates every year. Programmers who work at Luxoft can do much more than basic projects like designing a website. Cognizant, on the other hand, focuses on low-end applications and a labor arbitrage strategy.
Perceived problems
There is also one other key difference between the two firms, aside from their ages and the type of programming they do, and that’s customer concentration. It is this difference that Adrangi believes is why many think Luxoft doesn’t deserve a premium valuation multiple. The firm’s business is highly concentrated among a handful of major customers including Deutsche Bank and UBS, while Cognizant’s client base is more diversified. Customer concentration can be chalked up to the stage of the business, however, as Luxoft is at an earlier stage than Cognizant.
Unfortunately the high client concentration has made it appear that the company’s growth is slowing. Deutsche Bank is the firm’s biggest customer, and it has scaled back IT spending because of ongoing restructuring, which has delayed a number of projects. Credit Suisse, a smaller but fast growing customer, also delayed some of its projects, taking a bite out of Luxoft’s forecasted revenues.
“Luxoft won Deutsche Bank and UBS as clients in 2011-2013 and did a great job for those customers, such that DB and UBS hired a ton of programmers from Luxoft,” Adrangi tells ValueWalk. “As those projects unwind, we’re seeing a decline in the number of developers [assigned to their projects]. We’re always going to see that. It’s not surprising to see slow growth at the top customers offset by rapid growth at smaller customers because the top one or two customers always have just gotten so large.”
Additionally, Adrangi says the firm had setbacks in its business with AT&T and UnitedHealthcare, two accounts it gained through acquisitions, but unfortunately for Luxoft, the management of both acquired firms had set unrealistically high growth expectations. As a result, the firm cut its fiscal 2018 revenue guidance from $943 million to $920 million and its earnings per share outlook from $3.26 to $2.85, which tanked its stock by as much as 30% following the last earnings report.
The core of Kerrisdale Capital’s thesis
Adrangi told ValueWalk that the firm has seen 58% revenue growth from clients who are outside its top five accounts with the slowdown in growth among the biggest accounts being more than offset by rapid growth in business from smaller customers. Kerrisdale Capital pegs the long-term compound growth potential at 15%.
One reason for this growth is Luxoft’s expansion into new areas of technology like autonomous driving. The firm’s business has been highly concentrated in the financial services industry historically, but the rapid growth in autonomous driving is presenting new opportunities with a greater than 35% growth rate. The firm’s management has told Adrangi and his team that the automotive sector is a major priority, and one of the auto OEM accounts that was added last year has already become one of the firm’s 10 biggest accounts.
0 notes
Text
Sahm Adrangi’s Kerrisdale Capital Doubles Down On Its Top Stock
Sahm Adrangi’s Kerrisdale Capital has doubled down on its position in Luxoft, which is now 20% of the firm’s portfolio. Adrangi shared his thesis exclusively with ValueWalk and explained in an interview why he feels Luxoft is such an attractive opportunity.

Sahm Adrangi doubles down on Luxoft after downward guidance revision
Luxoft is scheduled to release its next earnings report on Nov. 16, but the company’s stock took a hit last quarter when it revised forward guidance downwards due to slowing growth. Management lowered fiscal 2018 guidance for revenue from $943 million to $920 million and for earnings per share from $3.26 to $2.85, due to declines at Luxoft’s largest customers. Luxoft stock plunged after the revision in August and has never recovered, falling from above $60 per share to closer to $45 per share.
Kerrisdale Capital, which has about $150 million in assets under management, has held Luxoft shares since the first quarter of 2015, but Adrangi tells ValueWalk that they doubled their position during the third quarter because the stock’s decline made it an attractive opportunity. He feels the sell-off was greatly overdone and that Luxoft is attractive over the long term because of its competitive advantage in high end IT application development.
Instead of focusing on the most basic types of software development, such as building websites, Luxoft offers more complex programming services such as development of self-driving technology, custom client relationship management portals and infotainment systems for vehicles.
“Over the long term we think that for these IT outsourcers that focus on high-end application development, there is a lot of demand for their services. As every company and industry digitizes every function of both their client-facing and internal infrastructure, there’s a limited number of developers graduating from U.S. colleges that can meet that demand. So Fortune 500 companies have to look abroad, and particularly to Eastern Europe where some of the most advanced software engineers are,” Adrangi tells ValueWalk.
Two IT services firms trade spots in Kerrisdale’s portfolio
Adrangi was attracted to Luxoft because of its similarities with Cognizant, which was once Kerrisdale Capital’s second largest holding. In fact, he sees Luxoft as being similarly positioned as Cognizant a decade ago in terms of opportunity and growth trajectory, and Luxoft has traded places with Cognizant in Kerrisdale’s portfolio. The firm has been gradually selling off its stake in Cognizant, and Adrangi explained to ValueWalk why these two IT services have traded positions in his view. Part of the reason boils down to the type of programming they do, while the other part is due to valuation.
“When we talk about Luxoft, we refer to Cognizant because of the growth trajectory,” he clarifies. “It was the size of Luxoft 15 years ago, and since then the stock has gone up 30 times. The reason it has done so well is there’s just a lot of demand out there for developer work, but today that demand is more at the high end versus some of the more basic, commodity type of IT outsourcing.”
One of the ways the firm has differentiated itself from other IT services firms is through its focus on highly-experienced programmers in Central and Eastern Europe, which produce almost 1 million engineering graduates every year. Programmers who work at Luxoft can do much more than basic projects like designing a website. Cognizant, on the other hand, focuses on low-end applications and a labor arbitrage strategy.
Perceived problems
There is also one other key difference between the two firms, aside from their ages and the type of programming they do, and that’s customer concentration. It is this difference that Adrangi believes is why many think Luxoft doesn’t deserve a premium valuation multiple. The firm’s business is highly concentrated among a handful of major customers including Deutsche Bank and UBS, while Cognizant’s client base is more diversified. Customer concentration can be chalked up to the stage of the business, however, as Luxoft is at an earlier stage than Cognizant.
Unfortunately the high client concentration has made it appear that the company’s growth is slowing. Deutsche Bank is the firm’s biggest customer, and it has scaled back IT spending because of ongoing restructuring, which has delayed a number of projects. Credit Suisse, a smaller but fast growing customer, also delayed some of its projects, taking a bite out of Luxoft’s forecasted revenues.
“Luxoft won Deutsche Bank and UBS as clients in 2011-2013 and did a great job for those customers, such that DB and UBS hired a ton of programmers from Luxoft,” Adrangi tells ValueWalk. “As those projects unwind, we’re seeing a decline in the number of developers [assigned to their projects]. We’re always going to see that. It’s not surprising to see slow growth at the top customers offset by rapid growth at smaller customers because the top one or two customers always have just gotten so large.”
Additionally, Adrangi says the firm had setbacks in its business with AT&T and UnitedHealthcare, two accounts it gained through acquisitions, but unfortunately for Luxoft, the management of both acquired firms had set unrealistically high growth expectations. As a result, the firm cut its fiscal 2018 revenue guidance from $943 million to $920 million and its earnings per share outlook from $3.26 to $2.85, which tanked its stock by as much as 30% following the last earnings report.
The core of Kerrisdale Capital’s thesis
Adrangi told ValueWalk that the firm has seen 58% revenue growth from clients who are outside its top five accounts with the slowdown in growth among the biggest accounts being more than offset by rapid growth in business from smaller customers. Kerrisdale Capital pegs the long-term compound growth potential at 15%.
One reason for this growth is Luxoft’s expansion into new areas of technology like autonomous driving. The firm’s business has been highly concentrated in the financial services industry historically, but the rapid growth in autonomous driving is presenting new opportunities with a greater than 35% growth rate. The firm’s management has told Adrangi and his team that the automotive sector is a major priority, and one of the auto OEM accounts that was added last year has already become one of the firm’s 10 biggest accounts.
0 notes
Text
Chuck CAPM Into The Garbage
By Erik Kobayashi-Solomon, Managing Director – Framework Investing
The first rule of modern finance – that a dollar today is worth more than a dollar tomorrow – is an elegant first principle that underlies project financing as well as bond and equity investing.
Also see
Is Value Investing Really in the Tank?

However, in equity investing, the tactical implementation of this elegant principle – the rate used in discounted cash flow analyses – is contentious because of the subjectivity of choosing an appropriate rate. This subjectivity is born from the fact that, unlike bonds, stocks have no nominal coupon rate or face value from which to calculate the current market rate. Equity discount rates are, in other words, unobservable, so subject to differences in opinion and methodology.
Our position is that the traditional method of assigning an equity discount rate – boosting a fixed income reference rate by a “risk premium” – is fundamentally flawed because it fails to take into consideration the very different types of risk borne by fixed income and equity investors. We believe that the risks borne by fixed income and equity investors cannot be directly compared, so basing equity rates on fixed income rates is invalid.
Because we see conceptual problems in combining and comparing fixed income and equity rates, it follows that we also reject the commonly-used measure of Weighted Average Cost of Capital (WACC). Our position is that talking about a “weighted average” of two fundamentally different quantities makes as little sense as averaging apples and oranges.
The Capital Asset Pricing Model (CAPM) is the academically-accepted framework for assigning appropriate discount rates. There are a multitude of theoretical issues with using CAPM to determine equity discount rates, a good summary of which listed here. From an empirical standpoint, Fama and French, as well as others, have shown that CAPM simply has limited or no predictive power in the real world.
Despite the demonstrated weaknesses in the CAPM formulation, the methodology that it represents – namely, “start with a fixed income rate and add something to account for added risk” – persists as the go-to method for thinking about determining cost of equity.

In natural language, the CAPM tells us that the appropriate discount rate for an equity investment is directly related to the risk-free rate and to the asset’s price variance compared to that of the market.
Let’s pull apart the CAPM, see why it is inappropriate for determining a company’s cost of equity, and build a model for a more effective, sensible way of performing this vital task.
Low-Hanging Fruit: Discard Beta
The first thing that sufficiently capitalized principal investors can do to improve the CAPM equation is to discard the beta term – representing covariance of the asset vis-à-vis the market, normalized by the asset’s own variance. An unlevered principal investor need not worry about market price fluctuations over an arbitrarily short time frame; investment returns are not path dependent, but rely only upon the start and end points and whatever cash flows were realized during the interim period.
What Does Value Investing REALLY mean?
Levered and agent investors[1] are concerned with path dependency and market price fluctuations, but the reasons are much less related to discount rates and the value of the asset – the topics of our discussion – and much more to market and career risk, respectively.
Levered investors may have to re-collateralize a margin account, so should acknowledge up front that valuation risk is less important to them than the level and type of leverage used (i.e., margin account or options). Agent investors must acknowledge the time-dependent nature of returns of stocks under their management because underperformance for any one year might affect their fund’s assets under management and / or career prospects. Again, these issues do not pertain to the question at hand, so we will just say that the concept of beta, a formalization of the “risk” associated with path dependency, should be ignored when considering an appropriate discount rate for principal investors.
The Crux of Our Argument: Risk is Vector, not Scalar, and Different Types of Risk Cannot Be Summed
The more important reason to invalidate the CAPM and its back-of-the-envelope cousins is that the risk incurred by a bond investor is different in nature from the risk incurred by a stock investor and, in our view cannot and should not be compared or “weighted.”
Let’s look at two investors – one, an investor in a fixed-rate bond of an economically mature, stable company; the other, an investor in the stock of that same company.
The credit investor accepts the risk that the investee company will fail. In exchange for accepting this risk, the credit investor receives a fixed, periodic fee, and may also hold legal rights to ownership of the firm’s assets if the equity value of the company collapses to zero.
Note that the bond investor is not betting on the firm’s success – its future growth and prosperity – but rather betting against its failure. If the company can generate enough cash to pay interest and principal payments over the life of the bond, the bond investor is satisfied.
International Value Investing Interviews-
In contrast to a bond investor, an investor in the equity of the company is betting for its success relative to alternatives. Equity is a residual claim on future economic growth, so if a company in which one holds an investment fails to boost its economic value as fast as alternative investments do, the investment will not be successful on a relative basis.
Put simply, equity risk represents an opportunity cost because of the nature of equity itself.

Anyone who has had to make practical investing decisions knows full well that the risk associated with not failing is very different than the risk associated with not succeeding. In the parlance we use at Framework Investing, a bond investor accepts exposure to a company’s failure (on an absolute basis) while an equity investor gains exposure to a company’s success (on a relative basis).
Clearly, the two risks are connected, especially at a specific and fairly rare point: the point at or near which the book value of equity of a company goes to zero. We would submit, however, that for most companies, most of the time, the relationship between absolute failure (bankruptcy) and relative success are tenuous at best, and cannot and should not be connected theoretically or mathematically.
The CAPM and similar methods treat rates as scalar quantities. However, as is clear from our examples, risk is not a scalar, but a vector term, that is intimately tied to directionality of outcomes. Three percent payment in exchange for accepting downside risk simply cannot be added or compared to opportunity costs related to gaining exposure to upside potential.
This dichotomy is made starker when we think back to the way the CAPM is implemented. The CAPM relates a specific company’s cost of equity, not to the company’s cost of debt, but to the rate paid by on debt issued by a sovereign government.
At a high level, investors in government bonds are betting that the overall economy of the issuing nation-state will remain robust enough and that the rule of law and administrative effectiveness of that nation-state will remain secure enough that tax receipts from the economy will continue at a sufficient level. In other words, investors in government bonds are betting that the taxation power of a state will not fail.
Value Investing Framework Based On Solid Fundamentals ...
This nation-state level risk is clearly different from either risk mentioned in the table above. Why should the opportunity cost for owning an equity ownership in a company relative to alternative equity investments be in any way related to the power of a nation to tax its citizens?
It’s true that the compensation for accepting the extremely low risk of a nation-state losing taxing power should be low, and that that the opportunity cost of investing in an individual stock instead of some alternative will likely be higher. CAPM describes the relationships between the two risks correctly, but attempts to connect the two mathematically when they cannot and should not be. Just because the relationship between the rates set forth by the CAPM is appropriate (i.e., sovereign bond rate is lower than company-specific equity rate) does not mean that the formal description of that relationship is correct or even valid.
With this line of reasoning, we discard any reference to risk-free interest rates in CAPM, and CAPM collapses.
To build up an alternative to CAPM, let’s focus in on the topic of opportunity costs and making risky choices.
Our CAPM Alternative: Based on Long-Term Risky Choices
As equity investors, we are confronted by a plethora of choices.
The most fundamental choice, and one that has received a great deal of attention recently, is that of whether to actively invest or to make a passive investment in an index fund.
The case for active management has become more difficult. An illustration of this difficulty is the anecdote of a bet between renown value investor Warren Buffett and a hedge fund-of-funds manager that over a 10-year time horizon, an investment in a low-cost index would beat an investment in a selection of hedge funds.
Reportedly, Buffett is only months away from winning this $1 million bet as the hedge fund has generated $200,000 in profit, versus index profits of $854,000. The opportunity cost of the active investment has been significant – the principal owner of capital would have been significantly better off by investing in the index.
Over time, it has been academically demonstrated that it is difficult for agent investors to consistently construct baskets of individual investments whose aggregate price performance exceeds that of the price performance of the broad index.
We submit that, the opportunity cost of investing in an individual equity security should be measured against the expected return of the market as a whole. At the initiation of an investment in the equity of a firm, any investor can decide whether or not to invest in an individual security or in an index. If a company is unable to generate cash flows sufficient to boost its value by at least the rate at which we can reasonably assume the index will, there is clearly an opportunity cost to investing in that company and an investor would be better off investing in the index at large.
At what rate can we reasonably expect the market to compound? For that, we look back at an historical series as a base.

This series only goes back to 1950, but carrying the analysis back to the late 19th century (using Shiller’s data), generates similar return statistics. Each line represents the listed compound annual growth rate for an investor who buys the index on a particular day and sells the index on the day closest to the time period listed (i.e., 10, 20, 30, or 40 years later). Average values for CAGRs in each of the four time periods are within 41 basis points of one another and hover around 7% per year. These returns do not include reinvestment of dividends; once dividends are included, the average CAGR moves up to around 10% per year. This 10% per year level was also found by Ibbotson and Chen in research published in 2003.
As much as academics in the finance world like to think otherwise, the business of investment is a business of horseshoes and hand grenades, and any digits to the right of a decimal point should be considered for their comedic value only. The actual return of large cap stocks as measured by serious academics is probably a few basis points on one side or the other of 10%, but for simplicity’s sake, we use the 10% figure to discount future cash flows.
In other words, our rewrite of CAPM becomes:

The discount rate must be equal to the expected market return because the risk we are taking is related to opportunity costs.
Stability of Our Discount Rate
In our opinion, one of the great shortcomings of CAPM’s estimate of cost of equity is that it is continually changing. A continuously changing discount rate makes sense only if one assumes that 1) securities are efficiently priced and 2) path dependence matters. As value investors, we reject the first contention and earlier in this essay explained why path dependence should not matter to principal investors.
In general, we believe that the only important risk to owners of a company’s equity is the uncertainty surrounding its operational performance. Changing technology, shifting customer preferences, fluctuations in input prices, and other factors certainly affect the ability of a company to continue generating cash flows. However, the one constant imperative is that the company manages its response to the competitive environment and invests wisely enough to continue to generate value for its shareholders that meets or exceeds the market at large.
We believe that equity market returns are a function of economic growth and aggregate capital structure – with equity owners essentially receiving levered exposure on the growth of the underlying economy. Several recent academic papers also find this to be empirically true (Cornell (2009), Straehl and Ibbotson (2017)). We think there are good reasons to think that economic growth rates in developed markets over the next 10 years are likely to fall (e.g., demographic pressures, a return to zero-sum, nationalistic trade policies, increased outlays for maintenance capital expenditures to account for environmental degradation, etc.). If we are right about this, the broader market will likely lag its average historical rate of growth and our required hurdle rate for investment will likely fall.
Even still, we continue to use our 10% cost of equity for large capitalization firms so we do not take on idiosyncratic risks as the market resets its economic growth expectations lower.
[1] An “agent investor” is a professional investor working on behalf of a principal owner of capital – a professional money manager, in other words.
Get our free newsletter and investor case studies
1 note
·
View note
Text
Chuck CAPM Into The Garbage - There Is A Better Way To Think About Cost Of Equity
By Erik Kobayashi-Solomon, Managing Director – Framework Investing
The first rule of modern finance – that a dollar today is worth more than a dollar tomorrow – is an elegant first principle that underlies project financing as well as bond and equity investing.
Also see
Is Value Investing Really in the Tank?
This industry is projected to double in size from $22 billion to an estimated $44 billion
However, in equity investing, the tactical implementation of this elegant principle – the rate used in discounted cash flow analyses – is contentious because of the subjectivity of choosing an appropriate rate. This subjectivity is born from the fact that, unlike bonds, stocks have no nominal coupon rate or face value from which to calculate the current market rate. Equity discount rates are, in other words, unobservable, so subject to differences in opinion and methodology.
Our position is that the traditional method of assigning an equity discount rate – boosting a fixed income reference rate by a “risk premium” – is fundamentally flawed because it fails to take into consideration the very different types of risk borne by fixed income and equity investors. We believe that the risks borne by fixed income and equity investors cannot be directly compared, so basing equity rates on fixed income rates is invalid.
Because we see conceptual problems in combining and comparing fixed income and equity rates, it follows that we also reject the commonly-used measure of Weighted Average Cost of Capital (WACC). Our position is that talking about a “weighted average” of two fundamentally different quantities makes as little sense as averaging apples and oranges.
The Capital Asset Pricing Model (CAPM) is the academically-accepted framework for assigning appropriate discount rates. There are a multitude of theoretical issues with using CAPM to determine equity discount rates, a good summary of which listed here. From an empirical standpoint, Fama and French, as well as others, have shown that CAPM simply has limited or no predictive power in the real world.
Despite the demonstrated weaknesses in the CAPM formulation, the methodology that it represents – namely, “start with a fixed income rate and add something to account for added risk” – persists as the go-to method for thinking about determining cost of equity.
In natural language, the CAPM tells us that the appropriate discount rate for an equity investment is directly related to the risk-free rate and to the asset’s price variance compared to that of the market.
Let’s pull apart the CAPM, see why it is inappropriate for determining a company’s cost of equity, and build a model for a more effective, sensible way of performing this vital task.
Low-Hanging Fruit: Discard Beta
The first thing that sufficiently capitalized principal investors can do to improve the CAPM equation is to discard the beta term – representing covariance of the asset vis-à-vis the market, normalized by the asset’s own variance. An unlevered principal investor need not worry about market price fluctuations over an arbitrarily short time frame; investment returns are not path dependent, but rely only upon the start and end points and whatever cash flows were realized during the interim period.
What Does Value Investing REALLY mean?
Levered and agent investors[1] are concerned with path dependency and market price fluctuations, but the reasons are much less related to discount rates and the value of the asset – the topics of our discussion – and much more to market and career risk, respectively.
Levered investors may have to re-collateralize a margin account, so should acknowledge up front that valuation risk is less important to them than the level and type of leverage used (i.e., margin account or options). Agent investors must acknowledge the time-dependent nature of returns of stocks under their management because underperformance for any one year might affect their fund’s assets under management and / or career prospects. Again, these issues do not pertain to the question at hand, so we will just say that the concept of beta, a formalization of the “risk” associated with path dependency, should be ignored when considering an appropriate discount rate for principal investors.
The Crux of Our Argument: Risk is Vector, not Scalar, and Different Types of Risk Cannot Be Summed
The more important reason to invalidate the CAPM and its back-of-the-envelope cousins is that the risk incurred by a bond investor is different in nature from the risk incurred by a stock investor and, in our view cannot and should not be compared or “weighted.”
Let’s look at two investors – one, an investor in a fixed-rate bond of an economically mature, stable company; the other, an investor in the stock of that same company.
The credit investor accepts the risk that the investee company will fail. In exchange for accepting this risk, the credit investor receives a fixed, periodic fee, and may also hold legal rights to ownership of the firm’s assets if the equity value of the company collapses to zero.
Note that the bond investor is not betting on the firm’s success – its future growth and prosperity – but rather betting against its failure. If the company can generate enough cash to pay interest and principal payments over the life of the bond, the bond investor is satisfied.
International Value Investing Interviews-
In contrast to a bond investor, an investor in the equity of the company is betting for its success relative to alternatives. Equity is a residual claim on future economic growth, so if a company in which one holds an investment fails to boost its economic value as fast as alternative investments do, the investment will not be successful on a relative basis.
Put simply, equity risk represents an opportunity cost because of the nature of equity itself.
Anyone who has had to make practical investing decisions knows full well that the risk associated with not failing is very different than the risk associated with not succeeding. In the parlance we use at Framework Investing, a bond investor accepts exposure to a company’s failure (on an absolute basis) while an equity investor gains exposure to a company’s success (on a relative basis).
Clearly, the two risks are connected, especially at a specific and fairly rare point: the point at or near which the book value of equity of a company goes to zero. We would submit, however, that for most companies, most of the time, the relationship between absolute failure (bankruptcy) and relative success are tenuous at best, and cannot and should not be connected theoretically or mathematically.
The CAPM and similar methods treat rates as scalar quantities. However, as is clear from our examples, risk is not a scalar, but a vector term, that is intimately tied to directionality of outcomes. Three percent payment in exchange for accepting downside risk simply cannot be added or compared to opportunity costs related to gaining exposure to upside potential.
This dichotomy is made starker when we think back to the way the CAPM is implemented. The CAPM relates a specific company’s cost of equity, not to the company’s cost of debt, but to the rate paid by on debt issued by a sovereign government.
At a high level, investors in government bonds are betting that the overall economy of the issuing nation-state will remain robust enough and that the rule of law and administrative effectiveness of that nation-state will remain secure enough that tax receipts from the economy will continue at a sufficient level. In other words, investors in government bonds are betting that the taxation power of a state will not fail.
Value Investing Framework Based On Solid Fundamentals ...
This nation-state level risk is clearly different from either risk mentioned in the table above. Why should the opportunity cost for owning an equity ownership in a company relative to alternative equity investments be in any way related to the power of a nation to tax its citizens?
It’s true that the compensation for accepting the extremely low risk of a nation-state losing taxing power should be low, and that that the opportunity cost of investing in an individual stock instead of some alternative will likely be higher. CAPM describes the relationships between the two risks correctly, but attempts to connect the two mathematically when they cannot and should not be. Just because the relationship between the rates set forth by the CAPM is appropriate (i.e., sovereign bond rate is lower than company-specific equity rate) does not mean that the formal description of that relationship is correct or even valid.
With this line of reasoning, we discard any reference to risk-free interest rates in CAPM, and CAPM collapses.
To build up an alternative to CAPM, let’s focus in on the topic of opportunity costs and making risky choices.
Our CAPM Alternative: Based on Long-Term Risky Choices
As equity investors, we are confronted by a plethora of choices.
The most fundamental choice, and one that has received a great deal of attention recently, is that of whether to actively invest or to make a passive investment in an index fund.
The case for active management has become more difficult. An illustration of this difficulty is the anecdote of a bet between renown value investor Warren Buffett and a hedge fund-of-funds manager that over a 10-year time horizon, an investment in a low-cost index would beat an investment in a selection of hedge funds.
Reportedly, Buffett is only months away from winning this $1 million bet as the hedge fund has generated $200,000 in profit, versus index profits of $854,000. The opportunity cost of the active investment has been significant – the principal owner of capital would have been significantly better off by investing in the index.
Over time, it has been academically demonstrated that it is difficult for agent investors to consistently construct baskets of individual investments whose aggregate price performance exceeds that of the price performance of the broad index.
We submit that, the opportunity cost of investing in an individual equity security should be measured against the expected return of the market as a whole. At the initiation of an investment in the equity of a firm, any investor can decide whether or not to invest in an individual security or in an index. If a company is unable to generate cash flows sufficient to boost its value by at least the rate at which we can reasonably assume the index will, there is clearly an opportunity cost to investing in that company and an investor would be better off investing in the index at large.
At what rate can we reasonably expect the market to compound? For that, we look back at an historical series as a base.
This series only goes back to 1950, but carrying the analysis back to the late 19th century (using Shiller’s data), generates similar return statistics. Each line represents the listed compound annual growth rate for an investor who buys the index on a particular day and sells the index on the day closest to the time period listed (i.e., 10, 20, 30, or 40 years later). Average values for CAGRs in each of the four time periods are within 41 basis points of one another and hover around 7% per year. These returns do not include reinvestment of dividends; once dividends are included, the average CAGR moves up to around 10% per year. This 10% per year level was also found by Ibbotson and Chen in research published in 2003.
As much as academics in the finance world like to think otherwise, the business of investment is a business of horseshoes and hand grenades, and any digits to the right of a decimal point should be considered for their comedic value only. The actual return of large cap stocks as measured by serious academics is probably a few basis points on one side or the other of 10%, but for simplicity’s sake, we use the 10% figure to discount future cash flows.
In other words, our rewrite of CAPM becomes:
The discount rate must be equal to the expected market return because the risk we are taking is related to opportunity costs.
Stability of Our Discount Rate
In our opinion, one of the great shortcomings of CAPM’s estimate of cost of equity is that it is continually changing. A continuously changing discount rate makes sense only if one assumes that 1) securities are efficiently priced and 2) path dependence matters. As value investors, we reject the first contention and earlier in this essay explained why path dependence should not matter to principal investors.
In general, we believe that the only important risk to owners of a company’s equity is the uncertainty surrounding its operational performance. Changing technology, shifting customer preferences, fluctuations in input prices, and other factors certainly affect the ability of a company to continue generating cash flows. However, the one constant imperative is that the company manages its response to the competitive environment and invests wisely enough to continue to generate value for its shareholders that meets or exceeds the market at large.
We believe that equity market returns are a function of economic growth and aggregate capital structure – with equity owners essentially receiving levered exposure on the growth of the underlying economy. Several recent academic papers also find this to be empirically true (Cornell (2009), Straehl and Ibbotson (2017)). We think there are good reasons to think that economic growth rates in developed markets over the next 10 years are likely to fall (e.g., demographic pressures, a return to zero-sum, nationalistic trade policies, increased outlays for maintenance capital expenditures to account for environmental degradation, etc.). If we are right about this, the broader market will likely lag its average historical rate of growth and our required hurdle rate for investment will likely fall.
Even still, we continue to use our 10% cost of equity for large capitalization firms so we do not take on idiosyncratic risks as the market resets its economic growth expectations lower.
[1] An “agent investor” is a professional investor working on behalf of a principal owner of capital – a professional money manager, in other words.
Get our free newsletter and investor case studies
1 note
·
View note
Text
Throw CAPM Into The Garbage - There Is A Better Way To Think About Cost Of Equity
By Erik Kobayashi-Solomon, Managing Director – Framework Investing
The first rule of modern finance – that a dollar today is worth more than a dollar tomorrow – is an elegant first principle that underlies project financing as well as bond and equity investing.
Also see
Is Value Investing Really in the Tank?
This industry is projected to double in size from $22 billion to an estimated $44 billion
However, in equity investing, the tactical implementation of this elegant principle – the rate used in discounted cash flow analyses – is contentious because of the subjectivity of choosing an appropriate rate. This subjectivity is born from the fact that, unlike bonds, stocks have no nominal coupon rate or face value from which to calculate the current market rate. Equity discount rates are, in other words, unobservable, so subject to differences in opinion and methodology.
Our position is that the traditional method of assigning an equity discount rate – boosting a fixed income reference rate by a “risk premium” – is fundamentally flawed because it fails to take into consideration the very different types of risk borne by fixed income and equity investors. We believe that the risks borne by fixed income and equity investors cannot be directly compared, so basing equity rates on fixed income rates is invalid.
Because we see conceptual problems in combining and comparing fixed income and equity rates, it follows that we also reject the commonly-used measure of Weighted Average Cost of Capital (WACC). Our position is that talking about a “weighted average” of two fundamentally different quantities makes as little sense as averaging apples and oranges.
The Capital Asset Pricing Model (CAPM) is the academically-accepted framework for assigning appropriate discount rates. There are a multitude of theoretical issues with using CAPM to determine equity discount rates, a good summary of which listed here. From an empirical standpoint, Fama and French, as well as others, have shown that CAPM simply has limited or no predictive power in the real world.
Despite the demonstrated weaknesses in the CAPM formulation, the methodology that it represents – namely, “start with a fixed income rate and add something to account for added risk” – persists as the go-to method for thinking about determining cost of equity.
In natural language, the CAPM tells us that the appropriate discount rate for an equity investment is directly related to the risk-free rate and to the asset’s price variance compared to that of the market.
Let’s pull apart the CAPM, see why it is inappropriate for determining a company’s cost of equity, and build a model for a more effective, sensible way of performing this vital task.
Low-Hanging Fruit: Discard Beta
The first thing that sufficiently capitalized principal investors can do to improve the CAPM equation is to discard the beta term – representing covariance of the asset vis-à-vis the market, normalized by the asset’s own variance. An unlevered principal investor need not worry about market price fluctuations over an arbitrarily short time frame; investment returns are not path dependent, but rely only upon the start and end points and whatever cash flows were realized during the interim period.
What Does Value Investing REALLY mean?
Levered and agent investors[1] are concerned with path dependency and market price fluctuations, but the reasons are much less related to discount rates and the value of the asset – the topics of our discussion – and much more to market and career risk, respectively.
Levered investors may have to re-collateralize a margin account, so should acknowledge up front that valuation risk is less important to them than the level and type of leverage used (i.e., margin account or options). Agent investors must acknowledge the time-dependent nature of returns of stocks under their management because underperformance for any one year might affect their fund’s assets under management and / or career prospects. Again, these issues do not pertain to the question at hand, so we will just say that the concept of beta, a formalization of the “risk” associated with path dependency, should be ignored when considering an appropriate discount rate for principal investors.
The Crux of Our Argument: Risk is Vector, not Scalar, and Different Types of Risk Cannot Be Summed
The more important reason to invalidate the CAPM and its back-of-the-envelope cousins is that the risk incurred by a bond investor is different in nature from the risk incurred by a stock investor and, in our view cannot and should not be compared or “weighted.”
Let’s look at two investors – one, an investor in a fixed-rate bond of an economically mature, stable company; the other, an investor in the stock of that same company.
The credit investor accepts the risk that the investee company will fail. In exchange for accepting this risk, the credit investor receives a fixed, periodic fee, and may also hold legal rights to ownership of the firm’s assets if the equity value of the company collapses to zero.
Note that the bond investor is not betting on the firm’s success – its future growth and prosperity – but rather betting against its failure. If the company can generate enough cash to pay interest and principal payments over the life of the bond, the bond investor is satisfied.
International Value Investing Interviews-
In contrast to a bond investor, an investor in the equity of the company is betting for its success relative to alternatives. Equity is a residual claim on future economic growth, so if a company in which one holds an investment fails to boost its economic value as fast as alternative investments do, the investment will not be successful on a relative basis.
Put simply, equity risk represents an opportunity cost because of the nature of equity itself.
Anyone who has had to make practical investing decisions knows full well that the risk associated with not failing is very different than the risk associated with not succeeding. In the parlance we use at Framework Investing, a bond investor accepts exposure to a company’s failure (on an absolute basis) while an equity investor gains exposure to a company’s success (on a relative basis).
Clearly, the two risks are connected, especially at a specific and fairly rare point: the point at or near which the book value of equity of a company goes to zero. We would submit, however, that for most companies, most of the time, the relationship between absolute failure (bankruptcy) and relative success are tenuous at best, and cannot and should not be connected theoretically or mathematically.
The CAPM and similar methods treat rates as scalar quantities. However, as is clear from our examples, risk is not a scalar, but a vector term, that is intimately tied to directionality of outcomes. Three percent payment in exchange for accepting downside risk simply cannot be added or compared to opportunity costs related to gaining exposure to upside potential.
This dichotomy is made starker when we think back to the way the CAPM is implemented. The CAPM relates a specific company’s cost of equity, not to the company’s cost of debt, but to the rate paid by on debt issued by a sovereign government.
At a high level, investors in government bonds are betting that the overall economy of the issuing nation-state will remain robust enough and that the rule of law and administrative effectiveness of that nation-state will remain secure enough that tax receipts from the economy will continue at a sufficient level. In other words, investors in government bonds are betting that the taxation power of a state will not fail.
Value Investing Framework Based On Solid Fundamentals ...
This nation-state level risk is clearly different from either risk mentioned in the table above. Why should the opportunity cost for owning an equity ownership in a company relative to alternative equity investments be in any way related to the power of a nation to tax its citizens?
It’s true that the compensation for accepting the extremely low risk of a nation-state losing taxing power should be low, and that that the opportunity cost of investing in an individual stock instead of some alternative will likely be higher. CAPM describes the relationships between the two risks correctly, but attempts to connect the two mathematically when they cannot and should not be. Just because the relationship between the rates set forth by the CAPM is appropriate (i.e., sovereign bond rate is lower than company-specific equity rate) does not mean that the formal description of that relationship is correct or even valid.
With this line of reasoning, we discard any reference to risk-free interest rates in CAPM, and CAPM collapses.
To build up an alternative to CAPM, let’s focus in on the topic of opportunity costs and making risky choices.
Our CAPM Alternative: Based on Long-Term Risky Choices
As equity investors, we are confronted by a plethora of choices.
The most fundamental choice, and one that has received a great deal of attention recently, is that of whether to actively invest or to make a passive investment in an index fund.
The case for active management has become more difficult. An illustration of this difficulty is the anecdote of a bet between renown value investor Warren Buffett and a hedge fund-of-funds manager that over a 10-year time horizon, an investment in a low-cost index would beat an investment in a selection of hedge funds.
Reportedly, Buffett is only months away from winning this $1 million bet as the hedge fund has generated $200,000 in profit, versus index profits of $854,000. The opportunity cost of the active investment has been significant – the principal owner of capital would have been significantly better off by investing in the index.
Over time, it has been academically demonstrated that it is difficult for agent investors to consistently construct baskets of individual investments whose aggregate price performance exceeds that of the price performance of the broad index.
We submit that, the opportunity cost of investing in an individual equity security should be measured against the expected return of the market as a whole. At the initiation of an investment in the equity of a firm, any investor can decide whether or not to invest in an individual security or in an index. If a company is unable to generate cash flows sufficient to boost its value by at least the rate at which we can reasonably assume the index will, there is clearly an opportunity cost to investing in that company and an investor would be better off investing in the index at large.
At what rate can we reasonably expect the market to compound? For that, we look back at an historical series as a base.
This series only goes back to 1950, but carrying the analysis back to the late 19th century (using Shiller’s data), generates similar return statistics. Each line represents the listed compound annual growth rate for an investor who buys the index on a particular day and sells the index on the day closest to the time period listed (i.e., 10, 20, 30, or 40 years later). Average values for CAGRs in each of the four time periods are within 41 basis points of one another and hover around 7% per year. These returns do not include reinvestment of dividends; once dividends are included, the average CAGR moves up to around 10% per year. This 10% per year level was also found by Ibbotson and Chen in research published in 2003.
As much as academics in the finance world like to think otherwise, the business of investment is a business of horseshoes and hand grenades, and any digits to the right of a decimal point should be considered for their comedic value only. The actual return of large cap stocks as measured by serious academics is probably a few basis points on one side or the other of 10%, but for simplicity’s sake, we use the 10% figure to discount future cash flows.
In other words, our rewrite of CAPM becomes:
The discount rate must be equal to the expected market return because the risk we are taking is related to opportunity costs.
Stability of Our Discount Rate
In our opinion, one of the great shortcomings of CAPM’s estimate of cost of equity is that it is continually changing. A continuously changing discount rate makes sense only if one assumes that 1) securities are efficiently priced and 2) path dependence matters. As value investors, we reject the first contention and earlier in this essay explained why path dependence should not matter to principal investors.
In general, we believe that the only important risk to owners of a company’s equity is the uncertainty surrounding its operational performance. Changing technology, shifting customer preferences, fluctuations in input prices, and other factors certainly affect the ability of a company to continue generating cash flows. However, the one constant imperative is that the company manages its response to the competitive environment and invests wisely enough to continue to generate value for its shareholders that meets or exceeds the market at large.
We believe that equity market returns are a function of economic growth and aggregate capital structure – with equity owners essentially receiving levered exposure on the growth of the underlying economy. Several recent academic papers also find this to be empirically true (Cornell (2009), Straehl and Ibbotson (2017)). We think there are good reasons to think that economic growth rates in developed markets over the next 10 years are likely to fall (e.g., demographic pressures, a return to zero-sum, nationalistic trade policies, increased outlays for maintenance capital expenditures to account for environmental degradation, etc.). If we are right about this, the broader market will likely lag its average historical rate of growth and our required hurdle rate for investment will likely fall.
Even still, we continue to use our 10% cost of equity for large capitalization firms so we do not take on idiosyncratic risks as the market resets its economic growth expectations lower.
[1] An “agent investor” is a professional investor working on behalf of a principal owner of capital – a professional money manager, in other words.
Get our free newsletter and investor case studies
0 notes