#BigDataTools
Explore tagged Tumblr posts
Visit Tumblr Blog
Explore Tumblr blogs with no restrictions, modern design and the best experience.
Last Seen Tumblr Blogs


Fun Fact
Tumblr Inc. is funded by 13 investors.
Text

Choosing between Power BI and Tableau for Databricks integration? This visual guide breaks down the key features that matter to data engineers and analysts—from connection methods to real-time analytics, cloud compatibility, and authentication.
🔍 Whether you're working in a Microsoft ecosystem or multi-cloud environment, knowing the right BI tool to pair with Databricks can accelerate your data pipeline efficiency.
💡 Explore the comparison and choose smarter.
🧠 Learn more from our detailed blog post: 🔗 https://databrickstraining7.blogspot.com/2025/08/databricks-power-bitableau-integration.html
🎓 Upskill with expert-led Databricks Training at AccentFuture: 🔗 https://www.accentfuture.com/courses/databricks-training/
#Databricks#PowerBI#Tableau#DataEngineering#BigDataTools#BIcomparison#ETLtools#DataAnalytics#MicrosoftPowerBI#TableauIntegration#SparkWithDatabricks#DataPipeline#AccentFuture#CloudAnalytics#DataCareer
0 notes
Text
Top Reasons Businesses Choose Apache NiFi for Real-Time Data Processing
Learn why businesses are adopting Apache NiFi for real-time data processing. Explore its benefits in automation, scalability, and streamlined data flow management.
0 notes
Text
BigQuery Essentials: Fast SQL Analysis on Massive Datasets
In an era where data is king, the ability to efficiently analyze massive datasets is crucial for businesses and analysts alike. Google BigQuery, a serverless, highly scalable, and cost-effective multi-cloud data warehouse, empowers users to run fast SQL queries and gain insights from vast amounts of data. This blog will explore the essentials of BigQuery, covering everything from loading datasets to optimizing queries and understanding the pricing model.
What is BigQuery?
Google BigQuery is a fully managed, serverless data warehouse that allows users to process and analyze large datasets using SQL. It seamlessly integrates with other Google Cloud Platform services, offering robust features like real-time analytics, automatic scaling, and high-speed querying capabilities. BigQuery excels in handling petabyte-scale datasets, making it a favorite among data analysts and engineers.

Google big Query
Loading Datasets into BigQuery
Before you can perform any analysis, you'll need to load your datasets into BigQuery. The platform supports various data sources, including CSV, JSON, Avro, Parquet, and ORC files. You can load data from Google Cloud Storage, Google Drive, or even directly from your local machine.
To load data, you can use the BigQuery web UI, the bq command-line tool, or the BigQuery API. When preparing your data, ensure it's clean and well-structured to avoid errors during the loading process. BigQuery also offers data transfer services that automate the ingestion of data from external sources like Google Ads, Google Analytics, and YouTube.

Loading Datasets into BigQuery
Writing and Optimizing SQL Queries
BigQuery offers a powerful SQL dialect that enables you to write complex queries to extract insights from your data. Here are some tips to optimize your SQL queries for better performance:
Use SELECT * sparingly: Avoid using SELECT * in your queries as it processes all columns, increasing execution time and costs. Specify only the columns you need.
Leverage built-in functions: BigQuery provides various built-in functions for string manipulation, date operations, and statistical calculations. Use them to simplify and speed up your queries.
Filter early: Apply filters in your queries as early as possible to reduce the dataset size and minimize processing time.
Use JOINs wisely: When joining tables, ensure you use the most efficient join types and conditions to optimize performance.
Partitioning & Clustering in BigQuery
Partitioning and clustering are powerful features in BigQuery that help optimize query performance and reduce costs:
Partitioning: This involves dividing a table into smaller, manageable segments called partitions. BigQuery supports partitioning by date, ingestion time, or an integer range. By querying only relevant partitions, you can significantly reduce query time and costs.
Clustering: Clustering organizes the data within each partition based on specified columns. It enables faster query execution by improving data locality. When clustering, choose columns that are frequently used in filtering and aggregating operations.

Partitioning & Clustering in BigQuery
Pricing Model and Best Practices
BigQuery's pricing is based on two main components: data storage and query processing. Storage is billed per gigabyte per month, while query processing costs are based on the amount of data processed when running queries.
To manage costs effectively, consider the following best practices:
Use table partitions and clustering: As discussed earlier, these techniques can help reduce the amount of data processed and, consequently, lower costs.
Monitor usage: Regularly review your BigQuery usage and costs using the Google Cloud Console or BigQuery's built-in audit logs.
Set budget alerts: Establish budget alerts within Google Cloud Platform to receive notifications when spending approaches a predefined threshold.
Optimize query performance: Write efficient SQL queries to process only the necessary data, minimizing query costs.
FAQs
What types of data can I load into BigQuery?
BigQuery supports various data formats, including CSV, JSON, Avro, Parquet, and ORC files. Data can be loaded from Google Cloud Storage, Google Drive, or your local machine.
How can I reduce BigQuery costs?
Use table partitions and clustering, optimize your SQL queries, and regularly monitor your usage and spending. Additionally, set up budget alerts to stay informed about your expenses.
Can I use BigQuery with other Google Cloud services?
Yes, BigQuery seamlessly integrates with other Google Cloud Platform services, such as Google Cloud Storage, Google Data Studio, and Google Sheets, allowing you to create a comprehensive data analysis ecosystem.
What is the difference between partitioning and clustering in BigQuery?
Partitioning divides a table into smaller segments based on date, ingestion time, or integer range, while clustering organizes data within partitions based on specified columns. Both techniques enhance query performance and reduce costs.
Is BigQuery suitable for real-time analytics?
Absolutely. BigQuery supports real-time analytics, allowing you to gain insights from streaming data with minimal latency. It is well-suited for applications requiring up-to-the-minute data analysis.
Embark on your journey with BigQuery, and unlock the potential of your data with fast, scalable, and efficient SQL analysis!
Home
instagram
#BigQuery#GoogleCloudPlatform#CloudAnalytics#SQLAnalytics#DataWarehousing#BigDataTools#QueryOptimization#DataScience#SunshineDigitalServices#ModernAnalytics#Instagram
0 notes
Text
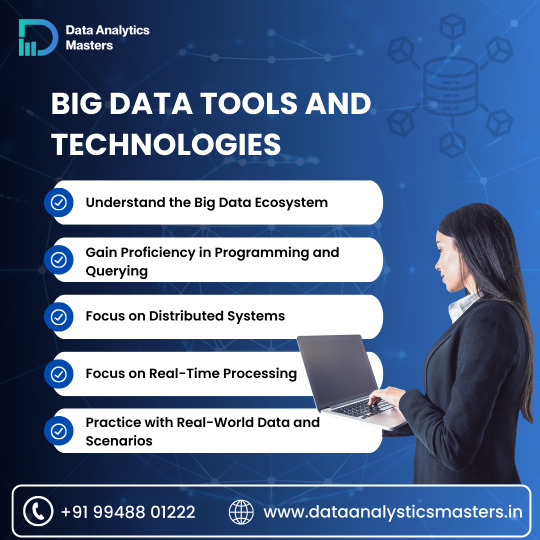
🚀 Dive into the World of Big Data with Data Analytics Masters! 💡 Gain mastery in:
The Big Data Ecosystem Programming & Querying Distributed Systems Real-Time Processing Real-World Data Scenarios ✨ Upskill yourself and stay ahead in the data game!
📞 Call us at +91 99488 01222 🌐 Visit us: www.dataanalyticsmasters.in
0 notes
Text
Open Source Tools for Data Science: A Beginner’s Toolkit
Data science is a powerful tool used by companies and organizations to make smart decisions, improve operations, and discover new opportunities. As more people realize the potential of data science, the need for easy-to-use and affordable tools has grown. Thankfully, the open-source community provides many resources that are both powerful and free. In this blog post, we will explore a beginner-friendly toolkit of open-source tools that are perfect for getting started in data science.
Why Use Open Source Tools for Data Science?
Before we dive into the tools, it’s helpful to understand why using open-source software for data science is a good idea:
1. Cost-Effective: Open-source tools are free, making them ideal for students, startups, and anyone on a tight budget.
2. Community Support: These tools often have strong communities where people share knowledge, help solve problems, and contribute to improving the tools.
3. Flexible and Customizable: You can change and adapt open-source tools to fit your needs, which is very useful in data science, where every project is different.
4. Transparent: Since the code is open for anyone to see, you can understand exactly how the tools work, which builds trust.

Essential Open Source Tools for Data Science Beginners
Let’s explore some of the most popular and easy-to-use open-source tools that cover every step in the data science process.
1. Python
The most often used programming language for data science is Python. It's highly adaptable and simple to learn.
Why Python?
- Simple to Read: Python’s syntax is straightforward, making it a great choice for beginners.
- Many Libraries: Python has a lot of libraries specifically designed for data science tasks, from working with data to building machine learning models.
- Large Community: Python’s community is huge, meaning there are lots of tutorials, forums, and resources to help you learn.
Key Libraries for Data Science:
- NumPy: Handles numerical calculations and array data.
- Pandas: Helps you organize and analyze data, especially in tables.
- Matplotlib and Seaborn: Used to create graphs and charts to visualize data.
- Scikit-learn: A powerful tool for machine learning, offering easy-to-use tools for data analysis.
2. Jupyter Notebook
Jupyter Notebook is a web application where you can write and run code, see the results, and add notes—all in one place.
Why Jupyter Notebook?
- Interactive Coding: You can write and test code in small chunks, making it easier to learn and troubleshoot.
- Great for Documentation: You can write explanations alongside your code, which helps keep your work organized.
- Built-In Visualization: Jupyter works well with visualization libraries like Matplotlib, so you can see your data in graphs right in your notebook.
3. R Programming Language
R is another popular language in data science, especially known for its strength in statistical analysis and data visualization.
Why R?
- Strong in Statistics: R is built specifically for statistical analysis, making it very powerful in this area.
- Excellent Visualization: R has great tools for making beautiful, detailed graphs.
- Lots of Packages: CRAN, R’s package repository, has thousands of packages that extend R’s capabilities.
Key Packages for Data Science:
- ggplot2: Creates high-quality graphs and charts.
- dplyr: Helps manipulate and clean data.
- caret: Simplifies the process of building predictive models.
4. TensorFlow and Keras
TensorFlow is a library developed by Google for numerical calculations and machine learning. Keras is a simpler interface that runs on top of TensorFlow, making it easier to build neural networks.
Why TensorFlow and Keras?
- Deep Learning: TensorFlow is excellent for deep learning, a type of machine learning that mimics the human brain.
- Flexible: TensorFlow is highly flexible, allowing for complex tasks.
- User-Friendly with Keras: Keras makes it easier for beginners to get started with TensorFlow by simplifying the process of building models.
5. Apache Spark
Apache Spark is an engine used for processing large amounts of data quickly. It’s great for big data projects.
Why Apache Spark?
- Speed: Spark processes data in memory, making it much faster than traditional tools.
- Handles Big Data: Spark can work with large datasets, making it a good choice for big data projects.
- Supports Multiple Languages: You can use Spark with Python, R, Scala, and more.
6. Git and GitHub
Git is a version control system that tracks changes to your code, while GitHub is a platform for hosting and sharing Git repositories.
Why Git and GitHub?
- Teamwork: GitHub makes it easy to work with others on the same project.
- Track Changes: Git keeps track of every change you make to your code, so you can always go back to an earlier version if needed.
- Organize Projects: GitHub offers tools for managing and documenting your work.
7. KNIME
KNIME (Konstanz Information Miner) is a data analytics platform that lets you create visual workflows for data science without writing code.
Why KNIME?
- Easy to Use: KNIME’s drag-and-drop interface is great for beginners who want to perform complex tasks without coding.
- Flexible: KNIME works with many other tools and languages, including Python, R, and Java.
- Good for Visualization: KNIME offers many options for visualizing your data.
8. OpenRefine
OpenRefine (formerly Google Refine) is a tool for cleaning and organizing messy data.
Why OpenRefine?
- Data Cleaning: OpenRefine is great for fixing and organizing large datasets, which is a crucial step in data science.
- Simple Interface: You can clean data using an easy-to-understand interface without writing complex code.
- Track Changes: You can see all the changes you’ve made to your data, making it easy to reproduce your results.
9. Orange
Orange is a tool for data visualization and analysis that’s easy to use, even for beginners.
Why Orange?
- Visual Programming: Orange lets you perform data analysis tasks through a visual interface, no coding required.
- Data Mining: It offers powerful tools for digging deeper into your data, including machine learning algorithms.
- Interactive Exploration: Orange’s tools make it easier to explore and present your data interactively.
10. D3.js
D3.js (Data-Driven Documents) is a JavaScript library used to create dynamic, interactive data visualizations on websites.
Why D3.js?
- Highly Customizable: D3.js allows for custom-made visualizations that can be tailored to your needs.
- Interactive: You can create charts and graphs that users can interact with, making data more engaging.
- Web Integration: D3.js works well with web technologies, making it ideal for creating data visualizations for websites.
How to Get Started with These Tools
Starting out in data science can feel overwhelming with so many tools to choose from. Here’s a simple guide to help you begin:
1. Begin with Python and Jupyter Notebook: These are essential tools in data science. Start by learning Python basics and practice writing and running code in Jupyter Notebook.
2. Learn Data Visualization: Once you're comfortable with Python, try creating charts and graphs using Matplotlib, Seaborn, or R’s ggplot2. Visualizing data is key to understanding it.
3. Master Version Control with Git: As your projects become more complex, using version control will help you keep track of changes. Learn Git basics and use GitHub to save your work.
4. Explore Machine Learning: Tools like Scikit-learn, TensorFlow, and Keras are great for beginners interested in machine learning. Start with simple models and build up to more complex ones.
5. Clean and Organize Data: Use Pandas and OpenRefine to tidy up your data. Data preparation is a vital step that can greatly affect your results.
6. Try Big Data with Apache Spark: If you’re working with large datasets, learn how to use Apache Spark. It’s a powerful tool for processing big data.
7. Create Interactive Visualizations: If you’re interested in web development or interactive data displays, explore D3.js. It’s a fantastic tool for making custom data visualizations for websites.
Conclusion
Data science offers a wide range of open-source tools that can help you at every step of your data journey. Whether you're just starting out or looking to deepen your skills, these tools provide everything you need to succeed in data science. By starting with the basics and gradually exploring more advanced tools, you can build a strong foundation in data science and unlock the power of your data.
#DataScience#OpenSourceTools#PythonForDataScience#BeginnerDataScience#JupyterNotebook#RProgramming#MachineLearning#TensorFlow#DataVisualization#BigDataTools#GitAndGitHub#KNIME#DataCleaning#OrangeDataScience#D3js#DataScienceForBeginners#DataScienceToolkit#DataAnalytics#data science course in Coimbatore#LearnDataScience#FreeDataScienceTools
1 note
·
View note
Text

#BigData#DataProcessing#InMemory#DistributedComputing#Analytics#MachineLearning#StreamProcessing#ApacheSpark#OpenSource#DataScience#Hadoop#BigDataTools
0 notes
Text
There are three major big data security practices that define an enterprise’s BI security system and play an important role in creating a flexible end-to-end big data security system for an organization.
0 notes
Text
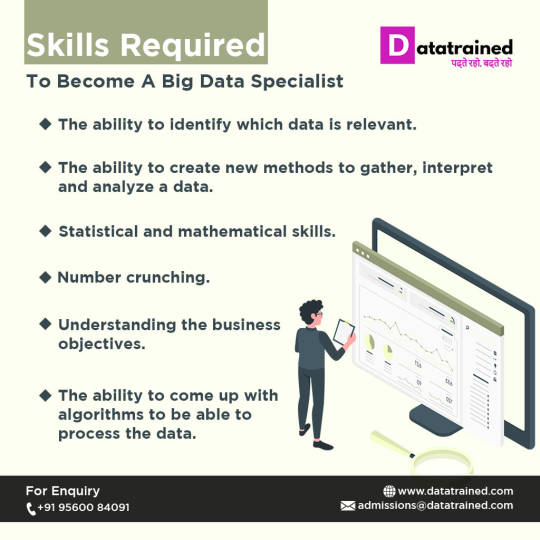
Skills Required to become a Big Data Specialist.
Big Data is considered one of the most trending and emerging technologies. With the increase in data, organizations are adopting these technologies to gain better insights. Here are the top 5 must-have skills needed for being a big data specialist.
Visit for more: https://datatrained.com/big-data-analytics-in-collaboration-with-ibm?fbclid=IwAR3G7WN2PLFhAc4y7nvbgqiA__wSDGPrfe5OG1_xzzjb1Nz4muVE_YB6GFY
#bigdatatools#datascience#hadoop#dataanalytics#dataanalysis#artificialintelligence#technology#machinelearning
0 notes
Photo

Get expertise in Big data processing through our Apache Hadoop training in Chennai. We provide comprehensove training with complete hands-on practices. Call 8608700340 to know more. -SLA #bigdatatechnologies #hadoopcertification #apachehadoop #spark #apachespark #bigdatatools #mongodb #apachestorm #rprogramming #neo4j #rapidminer #dataanalytics #hpcc #pentaho #learnfromhome #utilisequarantine #futuristic #careerdriven #postlockdowngoals #preparedforanything #kknagarchennai #slajobs #summerlearning #creative #learning #transformyourcareer #allcourses #bigdataengineer #bigdataanalytics #bigdatahadoop https://www.instagram.com/p/B_AMnT4APMR/?igshid=kzfa4n41671e
#bigdatatechnologies#hadoopcertification#apachehadoop#spark#apachespark#bigdatatools#mongodb#apachestorm#rprogramming#neo4j#rapidminer#dataanalytics#hpcc#pentaho#learnfromhome#utilisequarantine#futuristic#careerdriven#postlockdowngoals#preparedforanything#kknagarchennai#slajobs#summerlearning#creative#learning#transformyourcareer#allcourses#bigdataengineer#bigdataanalytics#bigdatahadoop
0 notes
Photo

Big Data Software: Vergleich der besten Big Data Tools in 2018
Vergleich der besten Big Data Tools in 2018: ✓Dundas BI ✓iCharts ✓Rapid Insight ✓Databox ✓Klipfolio ✓Tableau ✓Board ✓Sisense. Möchten Sie mehr zu dem Thema erfahren und sich ausführlich informieren? Wir haben für Sie einen umfangreichen Test durchgeführt. Mehr dazu finden Sie hier ➛
https://www.shopboostr.de/big-data-software
Unsere E-Commerce Agentur aus Berlin & München berät Sie gerne bei der Umsetzung Ihres individuellen Projektvorhabens.
0 notes
Link

The data today is just too big to ignore. It is the new gold, which needs to be extracted, refined, distributed and finally monetized. We have around 2.3 trillion gigabytes of data and it will be doubled in the next two years. The use of big data in healthcare might shock many but it can save the lives of many. Have a look at some of the uses:
1. Patient’s care is everything
The healthcare industry is more focused on improving the patient’s care quality these days. Apart from that, they are also focusing on reducing the healthcare cost as well as providing support for the reformed payment structure. Doctors are finding it useful in providing patient-related data. This at of sharing the data is in the favor of patients only as it helps in improving the healthcare. The process includes This approach requires reporting, processing, data management, and process automation. To provide the good healthcare, it is very much necessary that doctors and hospitals work together.
2. The healthcare and internet of things
The Internet of things is defined as the system of connected computing devices that are interrelated to collect and exchange data. There is a huge rise in the volume of data with each connected device. The data received from the IoT is mostly in the unstructured form. Thus the data engineers have enough scope of using Hadoop and analytics. Using IoT in healthcare is important and spending money on healthcare IoT will cost around $120 billion in the coming few years.
Also Read: How Big Data Will Change Your Business
3. Reducing the medical cost
The cost of the healthcare procedure is extremely high and is growing day by day. For this, the predictive analysis comes to the rescue by helping in cutting the hospital cost. Using Big data we can track those patients who are at high risk and needs proper attention. In this way, we could eradicate the readmission cost completely. Not only data, the improved technology will help in optimizing staff for a better pharmaceutical supply chain.
4. Use of Big data in Health Research department
The right type and amount of data are always needed for any research and the same as in the case of the health department. All hospitals submit data on medical cases using big data. As without big data that data is of no worth. This data could save the life of many people and better care can be provided to all the patients.
Read more info at — https://www.oodlestechnologies.com/blog/tagged/bigdata
0 notes
Text
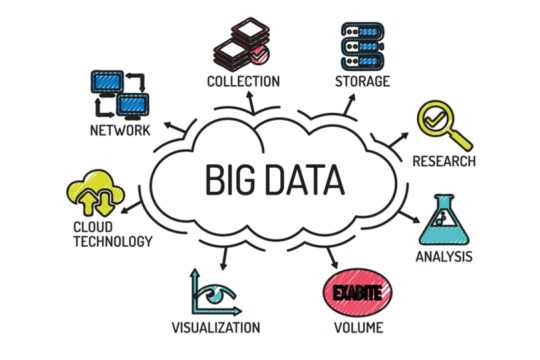
Big Data Made Simple: Tools, Trends, and Technologies
Big Data Made Simple: Tools, Trends, and Technologies
In the modern era, the term "Big Data" has transcended the realm of tech jargon to become a cornerstone of contemporary business strategy. But what exactly is Big Data, and why is it so crucial? This blog will unravel the mysteries of Big Data by exploring its core components, real-world applications, and the tools and professionals that bring data to life.
Big Data Analysis
What is Big Data?
To understand Big Data, we must first appreciate its defining characteristics, commonly referred to as the 5Vs: Volume, Velocity, Variety, Veracity, and Value.
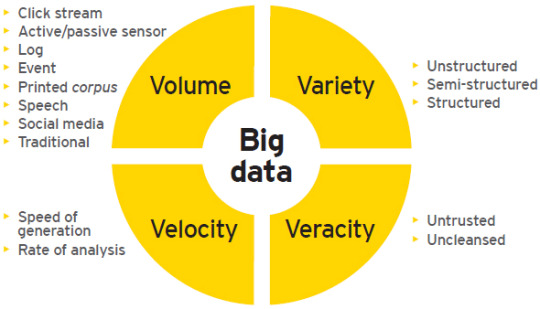
Big data Characteristics
Volume: Big Data is characterized by vast quantities of data, from terabytes to petabytes and beyond. The sheer scale of data generated daily is staggering.
Velocity: The speed at which data is generated, processed, and analyzed is crucial. In many industries, real-time data processing is necessary for making timely decisions.
Variety: Data comes in all shapes and sizes. From structured data in databases to unstructured data like social media posts and videos, Big Data encompasses a wide array of data types.
Veracity: Ensuring the accuracy and trustworthiness of data is critical. High veracity ensures that insights drawn from data are reliable and actionable.
Value: Ultimately, the purpose of Big Data is to derive value. By analyzing Big Data, businesses can gain insights that lead to improved decision-making and strategic advantages.
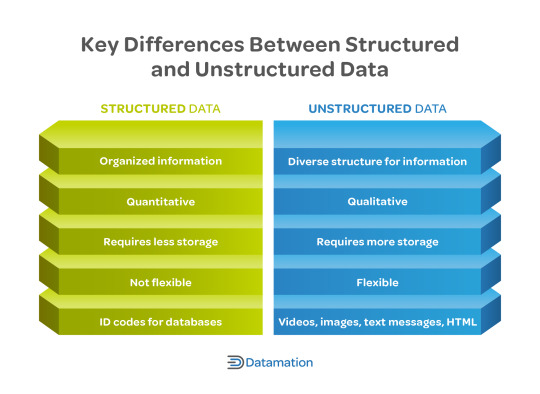
Structured vs Unstructured Data
Data can be broadly categorized into two types: structured and unstructured.
Structured Data: This refers to data that is organized into a defined format, such as rows and columns in a database. It is easily searchable and often stored in data warehouses.
Unstructured Data: This type of data lacks a pre-defined structure. Examples include emails, videos, social media posts, and sensor data. While more challenging to analyze, unstructured data often holds valuable insights.
Types of Data format
Real-world Use Cases
Big Data is transforming industries across the globe. Here are a few notable examples:
Healthcare: In healthcare, Big Data is used for predicting epidemics, improving patient care, and enhancing the accuracy of diagnoses. Large datasets enable personalized medicine and efficient resource management.
Finance: Financial institutions leverage Big Data for fraud detection, risk management, and personalized banking services. By analyzing transaction patterns, banks can offer tailored solutions to customers.
Retail: Retailers use Big Data to optimize inventory management, enhance customer experience, and drive marketing strategies. Understanding consumer behavior through data analysis can lead to increased sales.
IoT (Internet of Things): With the proliferation of connected devices, IoT generates massive amounts of data. Analyzing this data can improve operational efficiency, predictive maintenance, and smart city management.
Overview of Analysis Tools
Several tools and platforms are essential for Big Data analysis:
SQL Server: A relational database management system that handles structured data and provides robust querying capabilities.
Hive: A data warehouse infrastructure built on top of Hadoop, enabling easy data summarization and analysis.
BigQuery: A serverless, highly scalable data warehouse offered by Google Cloud, known for its speed and SQL-like interface.
SparkSQL: Part of the Apache Spark ecosystem, SparkSQL allows for querying structured data with fast, in-memory processing.
Cloud Platforms: Cloud services like AWS, Azure, and Google Cloud provide scalable infrastructure and tools for Big Data storage, processing, and analysis.
Big data Analysis Tools
The Role of Data Engineers & Analysts
Data engineers and analysts play pivotal roles in the Big Data ecosystem:
Data Engineers: They are responsible for designing, building, and maintaining the architecture that allows data to be ingested, processed, and stored. Their work ensures that data is accessible and reliable for analysis.
Data Analysts: Analysts transform raw data into meaningful insights. They use statistical techniques and tools to interpret data, identify trends, and provide actionable recommendations for business growth.

Role of Data Analysis
FAQs
1. What are the main challenges of working with Big Data? Managing the volume, ensuring data quality, and integrating diverse data types are some of the major challenges in Big Data.
2. How does Big Data differ from traditional data? Big Data involves large volumes, high velocity, and diverse formats, while traditional data is usually smaller, slower, and more uniform in structure.
3. What skills are essential for a career in Big Data? Key skills include proficiency in data analysis tools, programming languages like Python or R, and a strong understanding of data management and architecture.
4. Can small businesses benefit from Big Data? Absolutely. Big Data can help small businesses understand customer behavior, improve marketing strategies, and optimize operations.
5. How is Big Data impacting privacy? With the increase in data collection, privacy concerns are rising. It's important for companies to comply with regulations and ensure data protection practices are in place.
By demystifying Big Data, businesses can harness its potential to drive innovation and maintain a competitive edge in today’s data-driven world.
Home
instagram
youtube
#BigData#DataAnalytics#DataScience#CloudComputing#DataEngineering#BigDataTools#TechEducation#DataDriven#SunshineDigitalServices#DigitalInnovation#Instagram#Youtube
0 notes
Photo

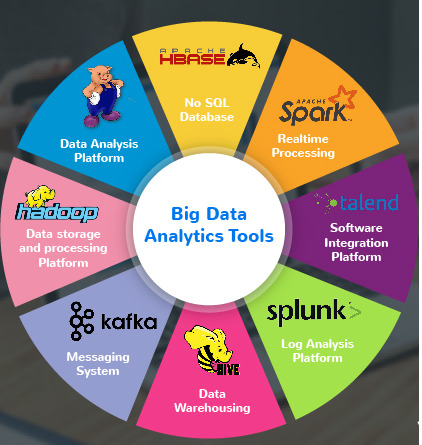
When it is about data analytics tools, we generally have questions. What is the deviation between such a large number of data analytic tools? Which is better? Which one will be a good idea for You to consider? Get the latest technology updates with techiexpert, as we help you with the recent techniques and certain researches on technology. Checkout best tools for big data analytics-: j.mp/2G6oOW5 and Stay tuned with j.mp/2YsLBm3ko. #techiexpert #technology #bigdatatools #dataanalytics #artificialintelligence
1 note
·
View note
Photo
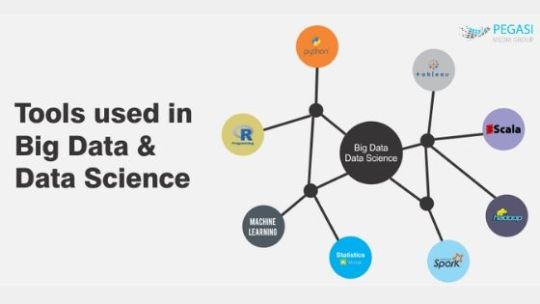
Know about #BigDataTools with #PegasiMediaGroup at http://bit.ly/2qTuHhD
0 notes
Photo

ビッグテータ可視化ツールはつまりBIツールで、今企業のデータ分析と意思決定に広く応用されて、とても役に立ちます。しかし、市場で製品が多くて、みんなきっとどれを選択すべきか悩むことがあるでしょう。もし下図のようなダッシュボードを作成したい場合、どのような方法を使えればいいんですか? http://www.finereport.com/jp/analysis/bigdatatools/
BIツール——データエンジニア、データアナリスト、開発者 1.Tableau 2.FineReport 3.PowerBI
データ可視化のチャートライブラリ——開発者、エンジニア向け 4.Echarts 5.Highcharts
データマップ類 6.Power Map 2016 7.Arc GIS
データマイニングのプログラミング言語——データサイエンティスト、データアナリスト 8.R 9.Python
0 notes
Link
Another crucial aspect of data worth remembering is its importance. The data becomes useless unless it is turned into useful and knowledgeable information to help management in decision making. As a result of this unprecedented growth, numerous Big Data tools and software has gradually proliferated. While these tools can perform several data analysis tasks they also provide efficiency in time and cost. Additionally, these tools can also help enhance the effectiveness of business by exploring business insights.
0 notes