#Cluster sampling vs quota sampling
Explore tagged Tumblr posts
Visit Tumblr Blog
Explore Tumblr blogs with no restrictions, modern design and the best experience.
Last Seen Tumblr Blogs


Fun Fact
In 2020, 44% of users from Denmark used Tumblr daily.
Text
Cluster Sampling: Types, Advantages, Limitations, and Examples
Explore the various types, advantages, limitations, and real-world examples of cluster sampling in our informative blog. Learn how this sampling method can help researchers gather data efficiently and effectively for insightful analysis.
#Cluster sampling#Sampling techniques#Cluster sampling definition#Cluster sampling steps#Types of cluster sampling#Advantages of cluster sampling#Limitations of cluster sampling#Cluster sampling comparison#Cluster sampling examples#Cluster sampling applications#Cluster sampling process#Cluster sampling methodology#Cluster sampling in research#Cluster sampling in surveys#Cluster sampling in statistics#Cluster sampling design#Cluster sampling procedure#Cluster sampling considerations#Cluster sampling analysis#Cluster sampling benefits#Cluster sampling challenges#Cluster sampling vs other methods#Cluster sampling vs stratified sampling#Cluster sampling vs random sampling#Cluster sampling vs systematic sampling#Cluster sampling vs convenience sampling#Cluster sampling vs multistage sampling#Cluster sampling vs quota sampling#Cluster sampling vs snowball sampling#Cluster sampling steps explained
0 notes
Text
Research | Population vs Sample and Sample Strategies
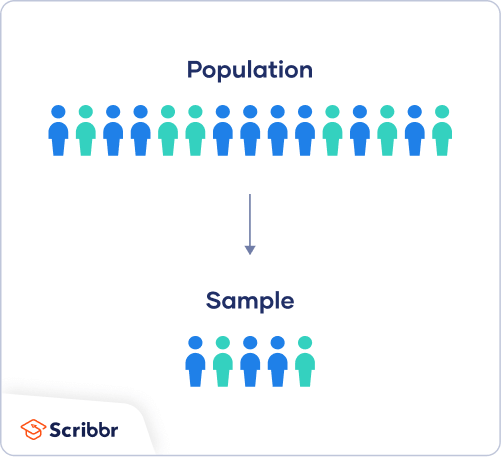
via Scribbr
Within the context of research, a population is the entire group a researcher would want to draw conclusions on, whilst a sample is the group from which the data would be gathered to represent the population. The population can be defined based on a variety of factors, such as geographical location, age, income, etc. It can be very broad, or extremely specific based on the topic of research. Sampling itself can be divided into two sections;
Probability Sampling : A random selection of the population, allowing for strong statistical inferences about a given group.
Non-Probability Sampling : A Non random selection based on convenience or a certain criterion or criteria, allowing for easy collection of data.
Probability Sampling Methods
Probability Sampling is mainly used in quantitative research. It means that every member of the population has a chance of being selected. If the goal is to produce results representative of the whole population, probability sampling techniques are the most valid choice. These can be divided into four groups;
Simple Random Sample
Systematic Sample
Stratified Sample
Cluster Sample
The first technique dictates that any random member of the population has an equal chance of being selected. Therefore the sampling frame should include the whole population. To conduct this, RNG or other chance based techniques could be used to gather a sample. Systematic sampling is similar to simple random sampling, but it is usually slightly easier to conduct. Every member of the population is listed with a number, but instead of randomly generating numbers, individuals are chosen at regular intervals. It is important to make sure that there is no hidden pattern in the list that might skew the sample.
Stratified sampling involves dividing the population into subpopulations that may differ in important ways. It allows you draw more precise conclusions by ensuring that every subgroup is properly represented in the sample. This method involves separating the population into substrata based on characteristics such as age, gender, or other relevant factors. Based on the overall proportions of the population, the sample must be reflective of that ratio. So, the sample is formed by calculating the the number of people based on the size of the strata. After this, any of the above two sampling strategies could be used.
Cluster sampling also involves dividing the population into subgroups, but each subgroup should have similar characteristics to the whole sample. Instead of sampling individuals from each subgroup, you randomly select entire subgroups. While this method is better suited to dealing with large, dispersed populations, there is room for more error within the sample, as there could be substantial differences between clusters.
Non-Probability Sampling Methods
This sampling technique is based on non-random criteria, and not every individual has a chance to be included in the sample. This type of sampling is cheaper and easier to access, but runs a larger risk of sampling bias. If a non-probability sample is used, it must be as representative of the population as possible.
Non-probability sampling techniques are often used in qualitative research. The aim is not to test a hypothesis about a broad population, but to develop an initial understanding of a small or under-researched population. This too, can be divided into four groups;
Convenience Sample
Purposive Sample
Snowball Sample
Quota Sample
Convenience sampling is the most self-explanatory; it includes a population that is most accessible to the researcher. While it is easier, there is no way to guarantee generalisable results. Another method of sampling similar to this is voluntary response sampling, which involves voluntary action to help the researcher (eg;- an online survey). Alas, this method of selection is also somewhat biased, as some people are inherently more likely to volunteer than others, and thus are likely to have stronger opinions on a given topic.
Purposive sampling involves selecting a demography that is most useful towards the topic of research being conducted. It is often used in qualitative research, where the researcher wants to gain detailed knowledge about a specific phenomenon rather than make statistical inferences, or where the population is very small and specific. When using this method, a strong rationale and criteria need to be made clear based on inclusion and exclusion.
If a population is harder to access, a snowball sample can be used to recruit participants via other participants. This is also susceptible to sampling bias, as there is no way to guarantee representation of the entire population based on the reliance of other participants to recruit more people.
A quota is a non-random selection of a predetermined number or proportion of units. This is the basic premise of quota sampling. To find a quota, the population must be divided into mutually exclusive strata, and individuals would be recruited until the quota is reached. These units share specific characteristics, determined prior to forming each strata. The aim of quota sampling is to control what or who makes up the sample.
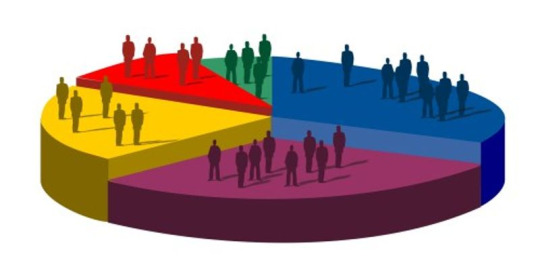
via labroots
So how can this be applied to my primary research methods? In terms of the survey, first we must determine the population. The primary purpose of this survey is to gather data on the general Sri Lankan population's attitudes towards their daily commute to school or work. The secondary purpose is to garner if the average Sri Lankan student or salaryman enjoys their daily routine, and whether they would be doing something different. Since the demography is more vague (mostly being based on geographical location), the responses would be a result of voluntary response sampling; the only factors that I can control are the platforms that I post the survey on and whether or not participants share the survey on their own public networks.
These sampling strategies are more applicable to my focus and control group initiatives. The purpose of these two groups is to gather qualitative information on the population's attitudes towards a Solarpunk future, whether these attitudes change based on animated content, and to measure the change between those who have seen the animation and those who haven't. The population in this case would be those at university. Why? This is because it is statistically likely that those who attend AOD are culturally diverse Sri Lankans, between the ages of 16 and 25 (Gen Z), belong to families of a moderate to high income bracket (which would heighten their access to information), and are more versed in non-traditional problem solving skills as a result of majoring in design.
As I am looking into qualitative research, I would have to use a non-probability sampling strategy. Convenience sampling would be ruled out as it is a more unreliable strategy, as would quota and snowball sampling. This leaves purposive sampling, which fits well into what I am trying to do; gather data on a small specific population on a niche concept/idea. For the purpose of this research, as mentioned earlier, I would like to gather a section of the current L4 batch (which as it happens, is representative of the population of AOD). This is due to their cultural diversity, age (as Gen Z, they are more likely to be progressive and environmentally conscious), and most importantly their experience in design- which at this point is not as much as the average designer but more than the average person their age. Due to the nature of them being exposed in large part to the standard education system, which prioritises subjects such as math, science, etc., and just breaking into the design field, these students could offer fresh perspectives on the topic of my research.
This could be taken a step further; looking at the L4s, I could conduct multi-stage sampling by including an element of stratified sampling; depending on if I can procure the necessary data on those from my campus.
Now that I have narrowed down what kind of strategies I want to use for my primary research, I can move on to curating a new set of questions based on this information.
0 notes
Text
Enabling low code graph data apps with Amazon Neptune and Graphistry
One of the common challenges to unlocking the value of graph databases is building easy-to-use, customer-facing data tools that expose graph-powered insights in impactful and visual ways. Data engineers need to inspect data quality, data scientists need to perform discovery and inspect models, analysts need to investigate connections, and managers need insight into what’s going on. The ability for a project to make data easily accessible is often the difference between reaching many users in your organization vs. having little return on your project. However, all too often, creating these data applications isn’t easy, as trying to combine the required components together quickly turns into a slog. Recently, Graphistry released a new open-source tool, graph-app-kit, which aims to solve this problem by providing a low code way to create powerful data applications for your Amazon Neptune managed graph database. graph-app-kit pairs the simplicity of a Streamlit data app, with point-and-click visual analytics tools of the GPU-accelerated Graphistry platform, all backed by a robust and scalable graph database in Neptune. The combination enables you to investigate your graph while performing analytical operations, such as viewing key clusters, as shown in the following animation. The GPU acceleration provided by Graphistry means even large Neptune results can be visually analyzed in a web browser. In this post, we demonstrate how to use graph-app-kit to generate a full-stack dashboard, complete with GPU-backed graph analytics on top of Neptune. We cover the process of launching Neptune, configuring and launching graph-app-kit, and building your first dashboard, by only modifying a few lines of code. For our data, we build upon the identity graph used in the post Building a customer identity graph with Amazon Neptune to construct an interactive enterprise-ready data dashboard that can be made available to business users like security and fraud, sales and marketing, and supply chain and logistics. Overview of solution Before we dive into the details, let’s first take a moment to answer the question: What is graph-app-kit? graph-app-kit is an open-source software project that integrates best-of-breed tools in the Python data science ecosystem: Streamlit dashboarding with Jupyter notebook authoring Tabular and graph analytics packages, including the RAPIDS GPU ecosystem with cuDF, cuGraph, and Graphistry for GPU visual graph analytics Database adapters, such as for Neptune, for a robust and scalable graph database optimized for storing billions or relationships and querying them with millisecond latency The core of graph-app-kit is a Docker host used to run all these technologies. Docker provides standardized configuration, launching, and operation, resulting in a quick-to-deploy system. The architecture of a deployed graph-app-kit instance consists of five containers: The first of these containers is a reverse proxy server, using Caddy, which directs incoming requests to one of four backend containers. Two of these containers run Streamlit dashboards, one configured to serve public-facing dashboards and the other configured to serve private password-protected dashboards. The remaining two containers are part of the Graphistry platform. One of these containers runs the Graphistry platform, while the other runs a Jupyter server that is used to interact with both Graphistry. The following diagram shows the architecture of the launched graph-app-kit stack for Neptune. This post covers the latest version of graph-app-kit, but for any future changes and potential customizations, we suggest you refer to the graph-app-kit tutorials in the GitHub repo. To get started deploying this stack, we have provided AWS CloudFormation templates for both Neptune and graph-app-kit, which make it easy to launch and manage your stacks. When you create this stack, you will be responsible for AWS charges incurred. Launching Neptune (optional if using an existing cluster) The first step in our deployment is to create our Neptune cluster and load the identity dataset. This data, such as the device identifiers, browsers, cookies, and history of sites visited or mobile apps used, represents a unique identity for a collection of users. This data also contains known demographics about the user based on information provided through various account profiles. This data is highly connected and is similar to what you might find via web server logs or clickstream data, as shown below. To use a GPU, you must selection an AWS region with a GPU quota. If you already have a Neptune instance with identity data, you can skip ahead to the next step. Launch Neptune with the preloaded identity data from the identity graph tutorial. Choose the stack for your preferred Region: Region View Launch US East (Ohio) View US East (N. Virginia) View US West (Oregon) View EU (Ireland) View In the Capabilities section, select the two check-boxes that grant the stack permissions to create the AWS Identity and Access Management (IAM) roles. Choose Create stack. The process of creating your stack may take up to 20 minutes to complete. When the process is complete, open the generated Identity-Graph-Sample stack’s Outputs It displays the values you need to configure graph-app-kit: VPC – ID vpc-abc PublicSubnet1 – ID subnet-abc DBClusterReadEndpoint – URL abc.cluster-ro-xyz.zzz.neptune.amazonaws.com To facilitate a fast bulk load of the sizable identity dataset, this CloudFormation script uses a Neptune cluster with an r5.12xlarge instance. After you complete this step, we recommend resizing the Neptune instance size to an r5.2xlarge to reduce the overall cost. You can view the Amazon Neptune costs on the pricing page. Launching graph-app-kit The CloudFormation template uses the Graphistry Core offering in the AWS Marketplace, which requires you accept its terms and conditions. After we launch Neptune, we’re ready to configure and launch graph-app-kit. Launch graph-app-kit for the Region where your Neptune cluster resides and you have GPU EC2 instances enabled: Region View Launch US East (Ohio) View US East (N. Virginia) View US West (Oregon) View EU (Ireland) View Fill in the launch settings using the output values you recorded earlier and select the instance size. Make sure that the VPC and subnet chosen are capable of connecting to the VPC of your Neptune cluster and that the subnet is the public subnet, so that you are able to access graph-app-kit from the internet. The least expensive self-managed GPU and Graphistry configuration for graph-app-kit is g4dn.xlarge (EC2 pricing information). To further lower costs by going CPU-only and with a free Graphistry Hub account, see Configuration 2: Minimal. Choose Create Stack to begin the stack creation. If your account isn’t configured for GPU capacity, you can launch a minimal CPU-only version of graph-app-kit with a subset of the components. Launching graph-app-kit may take up to 10 minutes to complete. To monitor the progress of the installation, SSH into the instance (user ubuntu) and run the following code: tail -f /var/log/cloud-init-output.log -n 1000 When the stack creation is complete, the public IP address is available on the stack’s Outputs tab on the AWS CloudFormation console. With graph-app-kit deployed, the following features are now available: All public dashboards can be viewed at http://[the.public.ip.address]/public/dash Private dashboards are available after logging in at http://[the.public.ip.address]/private/dash You can access notebooks to live-edit dashboards at http://[the.public.ip.address]/notebook Administrator functions are located at http://[the.public.ip.address]/admin The default login credentials for protected pages are admin / i-theInstanceID and should be changed upon first login. Sample Gremlin dashboard graph-app-kit runs Python-based dashboards using Streamlit. Let’s take a look at one of the dashboards that comes out of the box with graph-app-kit. From the drop-down menu, choose Gremlin: Simple Sample. A view is shown with a layout consisting controls on the left that filter the data, in this case a slider for the number of edges to show, and a main content area that shows filtered data, in this case the Graphistry browser. Changing the filtering controls causes the dashboard to populate the Graphistry browser with data from the Neptune database. Creating a new dashboard One of the top use cases for a graph data app is enabling users to filter data by predefined attributes and visually explore the resulting graph. We’ve looked at a very simple dashboard with a single filter, but in many cases, you want to have multiple different criteria to refine your filter. Let’s see how we can extend that view to add additional filters to our dashboard. For this post, we copy and modify the existing view of our sample Gremlin database to add the ability to filter our results by state. The process of creating most new dashboards is easy to accomplish and involves the following steps: Clone the existing view, in this case the Gremlin sample. Register the new view in Streamlit. Add or modify any filtering UI controls. For this post, we add a drop-down menu to filter by state. Update the view’s query to incorporate the filter control values. Cloning the Gremlin sample view using Jupyter’s file browser To create our new view, named Blog Search Demo, we copy an existing Gremlin sample view. You can accomplish this by a variety of methods, but for this post, we use Jupyter, which is included as part of graph-app-kit. Go to http://[the.public.ip.address]/notebook/tree/notebooks/graph-app-kit/public/views/ , and log in. From the New drop-down folder, choose Folder. Choose the generated folder Untitled. Choose Rename. Enter blog_search_demo. Navigate to http://[the.public.ip.address]/notebook/tree/notebooks/graph-app-kit/public/views/demo_neptune_01_minimal_gremlin. Choose Duplicate and Duplicate selected. Select our newly duplicated file and choose Move. Move it to /notebooks/graph-app-kit/public/views/blog_search_demo. Go to your new folder blog_search_demo and select the copied file. Rename it to _init_py. Registering the new view in Streamlit Now that we have created a copy of this view, we need to register this view with Streamlit by giving it a name and unique application ID. The name property is the name of the dashboard in the UI, and app_id is used for the lexicographic sort order of dashboards on the dashboard drop-down menu. To change these properties for our new view, complete the following steps: Using Jupyter’s file browser, choose the file _init_.py to open it for editing. At the top of the file, make the following changes: For app_id, change app_neptune_01 to blog_search. For name, change GREMLIN: Simple Sample to Blog - Faceted search. Save the file. Go to http://[[the.public.ip.address]]/public/dash. From the drop-down menu, choose Blog – Faceted Search to refresh your browser to the new view. Adding the filter control Most graph-app-kit views are variants of the same flow: show filters, pass their settings to a query runner, then pass the query results to a main area results renderer. In our example, we need to add a new filter control to the sidebar_area() method and incorporate the new filter into our query, which we complete in the following sections. Our first step is to add a new filtering control to the sidebar by editing the sidebar_area() method. Out of the box, Streamlit comes with a variety of different filter controls such as sliders, drop-downs, and text boxes, which we can use to add additional filtering criteria to our application. For this post, we add a new drop-down menu containing the states to the UI by adding the st.sidebar.selectbox() call to our method. If we want the filter value to be part of the URL, such as for when sharing links, we can also copy the URL init and set pattern used in the next lines for the num_edges UI control. Finally, we expose the filter controls’ value by returning from sidebar_area() method. See the following code: def sidebar_area(): state = st.sidebar.selectbox( 'Find users from this state?', [ 'All States', 'Alabama', 'Alaska', … Additional States omitted for brevity... 'Wisconsin', 'Wyoming' ]) num_edges_init = urlParams.get_field('num_matches', 10000) … Updating the Gremlin query to incorporate the filter With our new filter UI control in place, we update the query to utilize this new filter. First, we add the new filter setting state into the method signature for run_filters(). Next, we add an additional step to our Gremlin traversal to include the filtering criteria when it is set. The following code shows our updated method: def run_filters(num_edges, state): g, conn = gremlin_helper.connect_to_neptune() logger.info('Querying neptune') t = g.V().inE() if not state == "All States": t = t.has('visited', 'state', state) res = t.limit(num_edges).outV().path().by( __.valueMap().with_(WithOptions.tokens)).toList() nodes_df, edges_df = path_to_df(res) ... When we save the file and reload the browser, our users can now filter data by state and see the results. The following screenshot shows the interactive dashboard with custom state filter. Examining this visualization quickly reveals the top clusters in the filtered identity graph. Although not covered in this post, graph-app-kit also includes examples of how to integrate additional GPU-accelerated analytics projects common in the RAPIDS ecosystem, such as cuGraph and BlazingSQL. The dashboard examples show using GPU acceleration to make analytical and machine learning UIs interactive on larger data. Conclusion When you add up the blue lines of code, this was surprisingly little work. graph-app-kit took care of the plumbing, all the way through deployment, data pipeline, and the UI. Your team can focus on just repeating the short graph-app-kit process for your custom view. Being able to quickly share purpose-built tools means more of your users can finally leverage the power of graph analysis and drive insights from their business data. In this post, we showed you how to do the following: Launch a full graph dashboarding stack in your private cloud Create a new Streamlit view straight from Jupyter Add a new UI filter control Run a custom Gremlin graph query over your Neptune graph database Show the results with GPU-accelerated interactive graph visualization using Graphistry’s Python client As you bring graph data to more of your organization, join us in the Graphistry community chat and feel free to contribute your extensions! If you have any questions, comments, or other feedback, we’re always available through your Amazon account manager or via the Neptune Discussion Forums. About the Authors Leo Meyerovich is the founder and CEO of Graphistry Inc for 100X’ing investigations with GPU-accelerated visual graph analytics and workflow automation. His previous research in high-performance computing, security verification, and programming language design received awards including SIGPLAN 10 Year Test of Time and multiple best-paper awards. Dave Bechberger is a Sr. Graph Architect with the Amazon Neptune team. He used his years of experience working with customers to build graph database-backed applications as inspiration to co-author “Graph Databases in Action” by Manning. Taylor Riggan is a Sr. Specialist Solutions Architect focusing on graph databases at AWS. He works with customers of all sizes to help them learn and use purpose-built NoSQL databases via the creation of reference architectures, sample solutions, and delivering hands-on workshops. https://aws.amazon.com/blogs/database/enabling-low-code-graph-data-apps-with-amazon-neptune-and-graphistry/
0 notes
Text
Weekly Digest, September 23
Monday newsletter published by Data Science Central. Previous editions can be found here. The contribution flagged with a + is our selection for the picture of the week. To subscribe, follow this link. Announcements * Deep Learning and AI For All - eBook * Democratizing Data Analytics and AI - Sep 25 * Migrating R Applications to the Cloud using Databricks - Sep 26 * Data Engineering, Prep & Labeling for AI (Cognilytica 2019 report) * Forecasting Using TensorFlow and FB's Prophet - Oct 17 * Building Accessible Dashboards in Tableau - Oct 15 Featured Resources and Technical Contributions * The Math of Machine Learning - Berkeley University Textbook * Explaining Logistic Regression as Generalized Linear Model * Artificial Neural Networks Explained * Correlation Coefficients in One Picture * AWK - a Blast from Wrangling Past. * Applications of Data Analytics * Authorship Analysis as a Text Classification/Clustering Problem * Boosting your Machine Learning productivity with SAS Viya * MS Data Science vs MS Machine Learning / AI vs MS Analytics + * Google Released Angular 7: What’s New in Angular 7? * Water Dataset Provides Ground-Level Insight into Business Risk * Question: Blending 4 data sources * Question: Cleaning responses to meet quotas after sampling Featured Articles * AI trading the market * How AI/ML Could Return Manufacturing Prowess Back to US * The simplest explanation of machine learning you’ll ever read * Ethics and Artificial Intelligence * What is Artificial Intelligence? * The devil is in the details * Designing an Analytics Roadmap * How to set up an intelligent automation CoE * Best Paths to Becoming a Great Data Scientist * A data-based view of customer analysis * How AI Is Changing Cyber Security Picture of the Week Source: article flagged with a + To make sure you keep getting these emails, please add [email protected] to your address book or whitelist us. To subscribe, click here. Follow us: Twitter | Facebook. http://bit.ly/30hIcs1
0 notes
Photo

Oracle Weblogic Admin Online Training in Hyderabad, India, USA & UK.
WEBLOGIC SERVER 11G/12C ADMINISTRATION TRAINING
Lucidtechsystems is a brand and providing quality Oracle WebLogic Training in Hyderabadthrough Online,Classroom,Corporate,Weekends and Fast track training on demand to the students in worldwide .LucidTechSystems is one best Oracle WebLogic server 11g/12c training institute in Hyderabad and providing IT End-to-End training with real-time hands-on exposure through the IT Experts to the students. We are giving best Oracle WebLogic Server 11g or 12C administration Online Training in USA,UK,Singapore,Canada,India and also classroom training in Hyderabad.Lucid Tech Systems provides flexibility to the students while choosing online classes, classroom training, corporate training, a summary of courses and their scope.
Faculty : Real-time experience
Highlights In Our WebLogic Training Service:
In LucidTechSystems all faculties or trainers have experienced the pleasure of training and trained Resources is accessible all over the world.LucidTechSystems Training leads to excel understanding, IT Industry latest skills requirement and proficiency with consulting service Lucid Tech Systems real-time skilled instructors accomplish your ideas/thoughts and create competently /expertly driven environment.We will develop the association with DEVELOPMENT, TESTING, QA, UAT, STAGE and PRODUCTION Environments.
Lucid Tech Systems help out along with WebLogic training in certification programs , Resume preparation, Boost Interview skills, Live Project life cycle, evolution, clarifying Doubts through Questions and Answers Method, Providing the Material with Video Sessions, troubleshooting bugs or issues in different target environment such as DEVELOPMENT, TESTING, QA, UAT, STAGE and PRODUCTION, support the novel thoughts.
Lucid Tech Systems is one best Oracle WebLogic Training through online and offline or classroom training center in Hyderabad, We also provide WebLogic online training in USA states California,Texas,New Jersey,New York,Illinois,Massachusetts,Georgia,Virginia,Colorado,Maryland,Washington etc and countries India,UK,Canada, Japan, Malaysia, Singapore,UAE, Kuwait , Abu Dhabi, Dubai, Australia, South Africa etc.
See other related Apache Tomcat Training course also.
Methodology:
The main purpose of this course is to give the students a conceptual practical knowledge of the Oracle Weblogic Administration.
Each concept will be explained in details first and then the practical implementation of the same concept will be shown by the trainer on the system.
Oracle Weblogic server 11g/12C Training mainly aims to get you ready for the interview after With this Weblogic Training Program coupled with sufficient practice of the exercises taught in the program a student will gain as much as knowledge equivalent to or above 4+ years of any Real Time Web logic Administrator.
What you will learn In WebLogic Training:
This oracle WebLogic training course trains Web administrators on techniques for installing and configuring Oracle WebLogic Server 11g. It also trains Web administrators to deploy Java EEapplications to Oracle WebLogic Server 11g using Administration Console and command-line and scripting tools like WLST.
Learn To:
Describe the architecture of WebLogic Server including domains, servers, and machines.
Install, configure and use WebLogic Server.
Perform routine Oracle WebLogic Server administration
Deploy different types of Java EE applications to Oracle WebLogic Server.
Required Prerequisites:
Basic TCP/IP networking knowledge of client/server concepts
Basic Linux commands and desktop navigation (if don’t know we will cover it )
Weblogic Training Course Topics:Introduction
History of web server, 2-tier architecture
Introduction to Java and J2EE
Overview on JVM
Introduction to J2EE Architecture
Various commercial products in 3-tiers the logic behind popularity of each product
Java Application Solution Architecture
Drawbacks of Web server
History of Application server
What is Application Server, 3-tier architecture
The need for an Application Server
Difference between Web server and Application server
Installation And Configuration (Weblogic and Domain)
Install WebLogic Server ( GUI, Console, Silent modes)
WebLogic Server Domains
Servers And Domains
Domain Configuration The Configuration Wizard
The Configuration Wizard: Creating A New Domain
Starting The Administrative Server
The Administration Console Administrative Tasks
Identifying Dynamic and Non-dynamic Attribute Changes in the Administration Console
Customizing Monitoring Tables Within the Administration Console
Setting the Domain Environment
Automatically Starting Admin Servers Managed Servers
Creating a Managed Server
Starting a Managed Server
Password boot.properties
Examining Server Status
Shutting Down Servers Admin
Server Shutdown
Admin Server Backup Start Scripts
XML , packing and unpacking commands, config_builder.sh
Starting and Stopping WebLogic Servers using Real-time Wrapper Scripts
Setting up WebLogic Server as Service
Starting and Stopping WebLogic Administration Server
Adding a WebLogic Managed Server to a Domain
Starting and Stopping a WebLogic Managed Server
Web Logic Server Life Cycle And Extending DomainStages Of Weblogic Startup Process:
STARTING
STANDBY
STARTING
ADMIN
RESUMING
RUNNING
RUNNING MODE
Java Naming and Directory (JNDI)
What is JNDI
Architecture Of JNDI
Why the JNDI required in Weblogic
Types of JNDIs
How to Viewing the JNDI Tree using Admin Console.
Setting up Weblogic Server Clustering Environment (Cluster)
What Is Clustering?
What Components Can Be Clustered?
Basic Cluster Diagrams
Web Container Load Balancing
Horizontal vs. Vertical Clustering
Horizontal Clustering
Clustering WebLogic Server
WebLogic Cluster Requirements
Configure Domain For Clustering
Create A Cluster
Multicasting vs. Unicasting
HttpClusterServlet Load Balancer
Horizontal Cluster setup ( 2 box,4 servers i.e.Domain Extension)
Vertical cluster setup (1 box , 3 servers)
Hybrid Cluster setup ( 2 boxes, 6 servers)
Managing Clusters
Assembling Applications (packing)
Java Web Application Architecture
The basic java files
The Infrastructure for Enterprise Web Applications
What is Application Assembly? JEE Modules
JEE Application Assembly Web Module
Web Module – Deployment Descriptor web.xml
XML WEB-INF Directory
Web Application Directory EJB Modules
EJB Deployment Descriptors ejb-jar.xml
Enterprise Application Modules
Enterprise Application Deployment Descriptor
Deploying Applications using various Methods
The Process
Deployment Overview
Archive Vs Expanded Directory
Default Deployment Names
Deployment Methods
Auto-Deployment
Console Deployment
Starting an Application
Stopping an Application
Updating Applications
Deleting Applications
Testing a Deployed Application
Monitoring Deployed Applications
Editing Deployment Descriptors Using Command Line
Deployment WebLogic.Deployer Command Syntax
Deployer Usage
wldeploy Ant Task
WebLogic Scripting Tool (WLST)
WebLogic Scripting Tool (WLST) Scripts
JDBC (Java Database Connectivity) and JTA Transactions
Introduction to JDBC
Types of JDBC Drivers
Working with a Database via JDBC (Client side)
The Need for Connection Pooling
Connection Pooling and Data Sources Connecting with Data Source
Steps in using Connection Pooling
Admin Tasks for Connection Pools and Data Sources
JDBC Driver Support in WebLogic Server
Database Access Using WebLogic Working with Data Sources
Creating a Data Source
Monitoring Data Source and Connection Pools
Creating Multidata Source (JDBC level Clustering)
Monitoring Multidata Source
JMS (Java Messaging Service)
Messaging Introduction
Messaging Components
Messaging Types
JMS (Java Messaging Service)
Message Driven Beans
(MDB) MDB as Message
Consumer JMS Resources
Durable Subscription
Deployment Descriptor Entry
Binding the Queue or Topic
WebLogic JMS Server
Creating a JMS Server
Creating a Connection Factory Creating a Topic, queue
Threshold and Quota
Configuring Threshold and Quota
Configure Distributed Destination
Creating a Distributed Topic/Queue
Monitoring JMS in WebLogic Messaging Bridge
JMS Clustering
Weblogic Server Security (Protecting Against Attacks)
WebLogic Server Security
Authentication / Authorization
Resources That Can Be Secured
Authentication Mechanisms
WebLogic Security Diagram
Overview: Security Tasks For Securing
Resources
WebLogic Security Realms
Managing Users/Groups
User Lockout
Managing Roles
Policies And Roles
Secure Socket Layer SSL (Encryption) and Security Frame Work
why SSL
Public Key / Private Key Encryption
Secure Communication Over The Web -SSL
SSL And WebLogic Server
Creating A Digital Certificate
Dealing With a CA
Configuring WebLogic Server SSL:
Keystores
Configure WebLogic SSL Settings
Configuring WebLogic Server SSL:
Setting A Listen Port
what is J2AA
what user and groups configurations
unlocking the users
What is realm and its modules
Apache HTTP Server Configuration and integration with Weblogic Server
Apache installation
Apache HTTP Server Plug-In
Installing Apache HTTP Server Plug-In
Configuring Apache HTTP Server Plug-In
Keep-Alive Connections
Using WebLogic As A Web Server (Virtual Hosting)
Web Server Overview
Using WebLogic Web Server
types of Virtual Hosts
Configuring The WebLogic Web Server Virtual Hosts
Creating Virtual Hosts
Specifying Virtual Host Names
Targeting Virtual Hosts to Server
Access Log
External Web Servers
WebLogic Scripting Tool (WLST i.e. command Mode Administration)
WLST Details
Starting WLST
Simple WLST Commands
WLST Is Hierarchical
Navigating WLST
Other WLST Commands
Scripting With WLST
Recording WLST Scripts
Configure Recording
Start Recording
Sample Recorded Script
Taking the thread dump through the WLST.
Node Manager( NM)
Node Manager Functionality
types of Node Managers
setting up the NM Environment
Starting an Administration Server from Node Manager
Starting a Managed Server from Node Manager
Restarting a Managed Server from Node Manager
Shutting Down a Server Instance From Node Manager
Working with Machines
Creating a Machine
Adding Server Instances To a Machine
Starting The Node Manager
Monitoring Managed Servers
Node Manager Logs and Configuration Files
Monitoring and Troubleshooting WebLogic Servers (Logging)
WebLogic Logging Services
Specifying the Logging Implementation
Message Severity
WebLogic Server Logs
Server Log
Viewing Server Log
Configuring Server Log
HTTP Access Log
Configuring HTTP Access Log
Domain Log
Viewing Logs
Performance Monitor using WebLogic Diagnostics Framework (WLDF)
log files
diagnostic modules
diagnostic Images
Archives
context
SNMP
What is InteroperabilityPerformance Tuning
Basic Tuning Methodology
Areas To Tune
Tuning Hardware
Tune The Operating System
Tune The JVM
JVM Choices
Tuning WebLogic Server
JDBC Settings
Thread Settings
Socket Readers
Socket Implementation
Monitoring Threads
Connection BackLog
Tuning The Back End
Muxer Threads
Work Managers and execute queues
Thread Dumps , Heap dumps and Core Dumps
Troubleshooting Weblogic Servers
How To Enable Disable Admin Console
How To Recover The Admin Password
How To Reset The Admin Password If Lost
Version Differences (WEBLOGIC 8.1 AND WEBLOGIC 9.1 AND ABOVE )
Regular Weblogic Server Issues.
Backup and Recovery Operations
Recommending a Backup and Recovery Strategy
Performing a Full Offline Backup and Recovery
Real Time Implementations
Real-time Weblogic Architectures
Real-time Tool (Remedy, Mantis bug tracking tool )
Sample Real-time Architectures
Daily Activities of the WebLogic Administrators
How to Apply patches
About Migration and Up gradation (From lower version o Higher Version )
Common Errors during WebLogic Administration (Issues)
NonTechnical Questions.
Tips on answering questions in Interviews
Tips for Resume preparation
Interview Questions
Interview Questions are real-time questions that were collected from various sources. By the end of this session, we are very sure that you will be comfortable able to answer all these questions with our WebLogic server 12c training.
Lucid Tech Systems Providing ” WebLogic Online Training “, ” WebLogic Training From Classroom” in Hyderabad, ” WebLogic Corporate Training in India”, In India Online Services providing top cities like Chennai, Bangalore, Mysore, Mumbai, Calcutta, Pune, Delhi, Noida, gorgon, NCR region etc.
Lucid Tech Systems WebLogic and SOA Admin classroom,online training Providing worldwide like Asia, Europe, America, Africa, Sweden, North Korea, South Korea, Canada, Netherlands, Italy, Russia, Israel, New Zealand , Norway, Singapore, Malaysia, UAE, Kuwait , Abu Dhabi, Dubai, Australia, South Africa, UK, USA etc.
Tags: Weblogic server 12c training,Weblogic server 12c training online India,Weblogic server 12c training in Hyderabad,Weblogic server 12c training online USA,Weblogic server 12c training online UK,Weblogic server 12c training online Canada,Weblogic Application server training, online weblogic administration training, Oracle weblogic administration training, weblogic online training from India, weblogic online training in Hyderabad, Weblogic training in Hyderabad, Weblogic portal server training online usa, Weblogic Application server training online USA,Weblogic portal server training in Hyderabad, Weblogic Application server training in Hyderabad Weblogic portal server training in india, Weblogic Application server training in India.
#Oracle Weblogic Admin Online Training in Hyderabad#Oracle Weblogic Admin Online Training in India#Oracle Weblogic Admin Online Training in USA#Oracle Weblogic Admin Online Training in UK#Oracle Weblogic Admin Online Training
0 notes