
Don't wanna be here? Send us removal request.
Statistics
We looked inside some of the posts by dynamictech01 and here's what we found interesting.
Average Info
Notes Per Post
1
Likes Per Post
1
Reblog Per Post
0
Reply Per Post
0
Number of Posts By Type
Text
1
Last Seen Tumblr Blogs


Fun Fact
Tumblr.com is the 103rd most visited website in the world.
Text
Bullish Candlestick Patterns
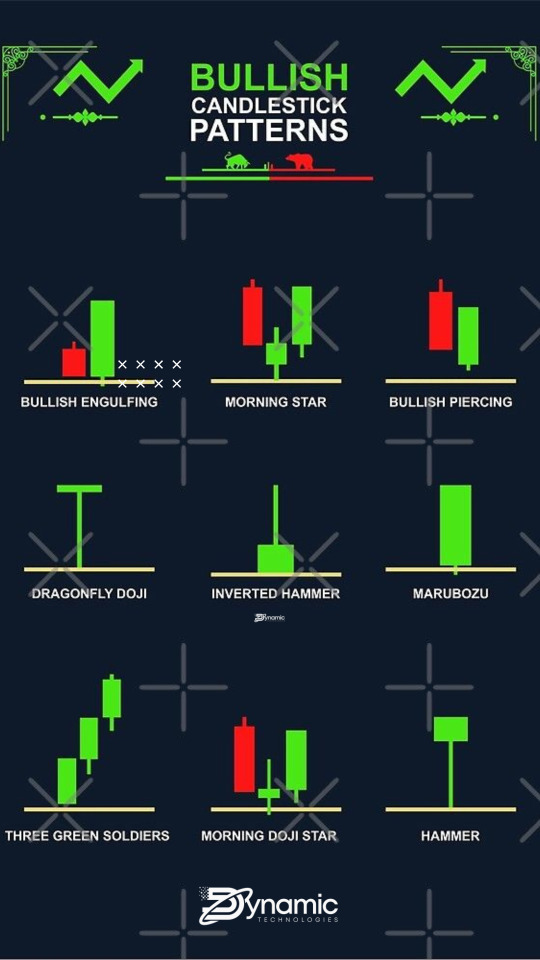
A bullish candlestick pattern is a type of chart pattern used in technical analysis that predicts an increase in stock price. This pattern is typically seen after a period of decline or consolidation and signals that the current trend is likely to reverse in an upward direction. The bullish candlestick pattern is formed when a candle’s open is lower than its close.
Bullish candlestick patterns can be used to identify buying opportunities in the stock market. These patterns can provide traders with a heads up that the market may be about to turn in their favor. Traders should look for patterns that appear in the midst of a downtrend. It is important to remember that these patterns are not always reliable and should be used in conjunction with other forms of technical analysis.
Bullish candlestick patterns typically consist of one large candle, followed by one or more smaller candle bodies. The large candle is the one that contains the buying pressure that is pushing the price higher. The smaller candles provide confirmation of the bullish trend. Some of the most common bullish candlestick patterns include the Hammer, Bullish Engulfing, Piercing Line, Morning Star, and Three White Soldiers.
Before entering into a trade based off of a bullish candlestick pattern, traders should ensure that the pattern is valid by looking at the preceding and following candles. It is also important to look for confirmation from other indicators, such as volume and momentum.
The Hammer is one of the most popular bullish candlestick patterns. It is formed when a candle has a small body at the top of the candle, followed by a much larger lower wick. The pattern is typically seen after a period of decline, indicating that buyers are beginning to enter the market.
The Bullish Engulfing pattern is another popular bullish candlestick pattern. This pattern is formed when a candle with a small body is followed by a much larger candle with a body that “engulfs” the previous candle. This pattern indicates that buyers are beginning to overwhelm sellers and that the current trend is likely to reverse.
The Piercing Line is a two-candle pattern that is formed when a long bearish candle is followed by a long bullish candle that “pierces” the midpoint of the previous candle. This pattern is typically seen after a period of decline and indicates that a reversal is likely.
The Morning Star pattern is a three-candle pattern that is formed when a long bearish candle is followed by a small-bodied candle, followed by a long bullish candle. This pattern indicates that buyers are beginning to enter the market and that the current trend is likely to reverse.
The Three White Soldiers is another three-candle pattern. This pattern is formed when three long bullish candles are seen in succession, indicating that buyers are becoming increasingly aggressive and that the current trend is likely to reverse.
Bullish candlestick patterns can be a useful tool for traders looking to capitalize on opportunities in the stock market. It is important to remember, however, that these patterns should not be used in isolation and should be used in conjunction with other forms of technical analysis. Traders should also look for confirmation from other indicators, such as volume and momentum, before entering into a trade based on a bullish candlestick pattern.
#candlestick pattern#Online Trading Platforms#Trading Software Solutions#Trading Software#Professional Trading Software
1 note
·
View note