#candlestick pattern
Explore tagged Tumblr posts
Visit Tumblr Blog
Explore Tumblr blogs with no restrictions, modern design and the best experience.
Last Seen Tumblr Blogs


Fun Fact
Tumblr has 16.74 million mobile monthly users in the US.
Text
What makes the bearish harami a weak bearish reversal indicator?
A bearish harami is one of the weakest bearish trend reversal candlestick.It is due to the psychology behind it.
In simple terms, it is the bears and bull's behaviour in the market that makes the bearish harami a weak trend reversal pattern.

The above picture depicts the behaviour of bulls and bears in the market that leads to the formation of bearish harami and also makes it a weak indicator.
Click here to read the explaination about their behaviour.
#stock trader#investing stocks#stock market#future and option trading#forex trading#forex#earn money online#investor#candlestick pattern#crypto traders
14 notes
·
View notes
Link
2 notes
·
View notes
Text
Bullish Candlestick Patterns
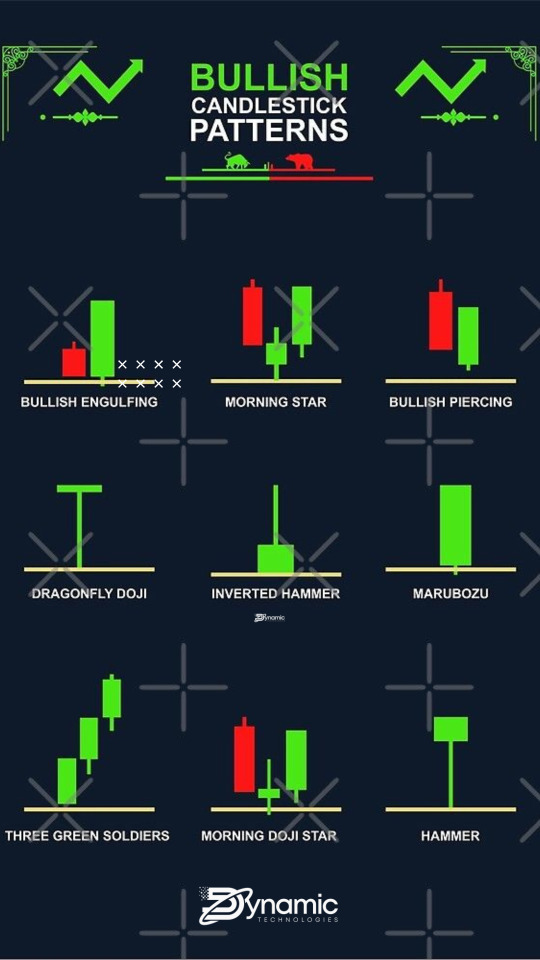
A bullish candlestick pattern is a type of chart pattern used in technical analysis that predicts an increase in stock price. This pattern is typically seen after a period of decline or consolidation and signals that the current trend is likely to reverse in an upward direction. The bullish candlestick pattern is formed when a candle’s open is lower than its close.
Bullish candlestick patterns can be used to identify buying opportunities in the stock market. These patterns can provide traders with a heads up that the market may be about to turn in their favor. Traders should look for patterns that appear in the midst of a downtrend. It is important to remember that these patterns are not always reliable and should be used in conjunction with other forms of technical analysis.
Bullish candlestick patterns typically consist of one large candle, followed by one or more smaller candle bodies. The large candle is the one that contains the buying pressure that is pushing the price higher. The smaller candles provide confirmation of the bullish trend. Some of the most common bullish candlestick patterns include the Hammer, Bullish Engulfing, Piercing Line, Morning Star, and Three White Soldiers.
Before entering into a trade based off of a bullish candlestick pattern, traders should ensure that the pattern is valid by looking at the preceding and following candles. It is also important to look for confirmation from other indicators, such as volume and momentum.
The Hammer is one of the most popular bullish candlestick patterns. It is formed when a candle has a small body at the top of the candle, followed by a much larger lower wick. The pattern is typically seen after a period of decline, indicating that buyers are beginning to enter the market.
The Bullish Engulfing pattern is another popular bullish candlestick pattern. This pattern is formed when a candle with a small body is followed by a much larger candle with a body that “engulfs” the previous candle. This pattern indicates that buyers are beginning to overwhelm sellers and that the current trend is likely to reverse.
The Piercing Line is a two-candle pattern that is formed when a long bearish candle is followed by a long bullish candle that “pierces” the midpoint of the previous candle. This pattern is typically seen after a period of decline and indicates that a reversal is likely.
The Morning Star pattern is a three-candle pattern that is formed when a long bearish candle is followed by a small-bodied candle, followed by a long bullish candle. This pattern indicates that buyers are beginning to enter the market and that the current trend is likely to reverse.
The Three White Soldiers is another three-candle pattern. This pattern is formed when three long bullish candles are seen in succession, indicating that buyers are becoming increasingly aggressive and that the current trend is likely to reverse.
Bullish candlestick patterns can be a useful tool for traders looking to capitalize on opportunities in the stock market. It is important to remember, however, that these patterns should not be used in isolation and should be used in conjunction with other forms of technical analysis. Traders should also look for confirmation from other indicators, such as volume and momentum, before entering into a trade based on a bullish candlestick pattern.
#candlestick pattern#Online Trading Platforms#Trading Software Solutions#Trading Software#Professional Trading Software
1 note
·
View note
Text
Understand the Art of Investing: The Dow Jones Candlestick Chart
Investors looking to get a leg up on the competition should make sure they understand how Dow Jones Candlestick Charts work. It's a powerful tool to help make better-informed decisions when it comes to investing. Dow Jones Candlestick Charts can be used to spot trends, gauge market sentiment and even anticipate where prices may head in the future. With the chart's visual display of data, investors are able to quickly interpret fluctuations in prices and identify buying and selling opportunities. The Dow Jones Candlestick Chart is an invaluable resource that can provide investors with the knowledge and confidence they need to make more successful investments.
0 notes
Text
Inverted Hammer Candlestick Pattern - Learn Trading Tips & Strategies Of It - By SS Trading Academy | What is Inverted hammer Candlestick Pattern? How to Identify and trade with it? and So on.
#Inverse hammer#inverted hammer#inverted hammer candle#inverted hammer candlestick pattern#inverted hammer pattern#inverted hammer vs hammer#bullish candlestick pattern#candlestick pattern#trading tips and tricks
0 notes
Link
Candlestick is a tool which is used to predict future trends and price direction in the Stock market. In this Mastering candlestick video of MMT Course by Tushar Ghone we have explained 4 modules in which different types of candlestick patterns like a single candlestick, two candlestick, and three candlestick patterns like doji, hammer, engulfing, and harami have also explained, and 4th one is surprise session to know about that watch full video.
0 notes
Text
The Tweezer Candlestick Pattern
The Tweezer Candlestick Pattern
The Tweezer candlestick pattern has its advantages and disadvantages. The first is its reliability. This candlestick pattern is often used by traders to determine the resistance zone in the market. The second is its reversal potential. The wicks of each candlestick are different, so it can be hard to tell which one is stronger or weaker. The Tweezer candlestick pattern appears when two…

View On WordPress
0 notes
Text
Bearish Engulfing pattern can result in uptrend ! When and How?
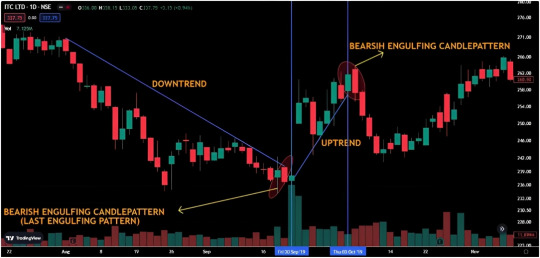
The above chart is a perfect example for a bearish engulfing pattern to act as a bullish trend reversal.This happens when bearish engulfing pattern occurs in the end of downtrend.
Click here to learn more about this in detail.
#stock trader#stock trading#candlestick pattern#crypto traders#future and option trading#forex trading#forex#earn money online#technical analysis
12 notes
·
View notes
Video
youtube
0 notes
Text
What is The Spinning Tops Candlestick Pattern? Is it bullish signal or bearish signal? Is it most significant candle or not? Where to find it in bottom or in top? where to trade with it and where to not? what are the best trading strategies for this candlestick pattern? These All Points has discussed in this blog. Read Now.
#candles#candlestick#candlestick pattern#candlestick patterns#bearish candlestick pattern#spinning tops candlestick pattern#spinning tops candle#spinning top pattern#trading strategy
0 notes
Link
The Inside Bar is a simple but efficient candlestick design. It can help you time your low-risk entries better. The best feature is that you may use it to trade trends or market reversals.
0 notes
Text
Mastering candlestick course
Candlestick is a tool which is used to predict future trends and price direction in the Stock market. In this Mastering candlestick video of MMT Course by Tushar Ghone we have explained 4 modules in which different types of candlestick patterns like a single candlestick, two candlestick, and three candlestick patterns like doji, hammer, engulfing, and harami have also explained, and 4th one is surprise session to know about that watch full video.
0 notes
Text
Everything You Must Know About Doji Candlesticks
Everything You Must Know About Doji Candlesticks
The Doji candle is a sort of candlestick that belongs to the Japanese candlestick chart family. Its unique training and formation give it its name. This three-column candlestick pattern is often considered an indicator of a potential market trend reversal. It comes in two different variations, depending on the trend of the market at the time. Identifying reversals The Doji candlestick is a…

View On WordPress
0 notes
Text
WHEN A BEARISH ENGULFING PATTERN IS SIGN OF SIDEWAYS TREND?
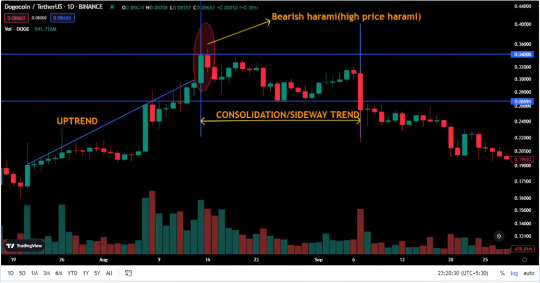
A bearish harami can sometimes result in a sideways trend.This happens when the bearish harami takes a form called the high price harami.
#stock trader#stock market#technical analysis#candlestick pattern#crypto traders#future and option trading#forex trading#forex
17 notes
·
View notes
Text
youtube
Candlestick Best Trading Tips
Begin to unleash the power of the
inside bar candlestick pattern.
Learn more.
#inside bar#candlestick chart#candlestick pattern#japanese candlesticks#candlestick patterns#candlesticks#chart analysis#price action#price target#price analysis#stocks day trader#forex day trader#online day trader#day traders#day trader#swing traders#intelligent investor#investors#trader#trading tips and tricks#intraday trading tips#day trading tips#stock trading tips#trading tips#bitcoin#short video#educational videos#video tutorial#videos#video
29 notes
·
View notes