
jessefelder
Jesse Felder's Tumblr
Jesse has been managing money for over 20 years. He began his professional career at Bear Stearns and later co-founded a multi-billion-dollar hedge fund firm headquartered in Santa Monica, California. Today he trades independently and publishes The Felder Report.
447 posts
Don't wanna be here? Send us removal request.
Last Seen Blogs

dabosscartel-blog
DaBoss Cartel

vastanxc
RacerZero

qsans
QsAns

honor225
Sans titre

thefluffyrailway-official
Boatz and Trainz with Paws
Text
A Unique Opportunity For Investors To Play Both Offense And Defense At The Same Time
This post is an excerpt from a recent report published in The Felder Report Premium.
I’m a die hard value investor to my core. I think when anyone learns about the “margin of safety” concept it either grabs them immediately or it doesn’t. When I first read about it in The Intelligent Investor it grabbed me and hasn’t let go since. While I believe it makes sense to approach investing in this way at all times, there’s an especially compelling case to be made for adopting a value investing framework today.
As noted by Rob Arnott recently, of all the various factors you could consider at present the value factor currently offers the greatest value. What’s more, it hasn’t been as attractive to be a value investor as it is today since the peak of the dotcom mania. Those who were investing back then should remember just how well value stocks did in the midst of the dotcom meltdown. For all the pain they suffered by lagging the market through the late-1990’s, value investors dramatically outperformed in the years after the peak.

It’s just this sort of risk amelioration that helps value consistently beat growth over the long run. While it may lag during the up cycle, value dramatically outperforms during down cycles. As they say, “defense wins championships.”

To the extent, then, that you believe general market risk is extraordinarily high, if you want to remain invested you should be doing so by utilizing a value approach. Because it has been so shunned in recent years, value today gives investors an opportunity to be both defensive and offensive at the same time. And it’s a framework, hedged (read more here) value (read more here) that is, I’m especially bullish on for the next several years.
8 notes
·
View notes
Text
If This Isn’t Stock Manipulation, I Don’t Know What Is

This post first appeared at TheFelderReport.com.
There is a growing chorus surrounding the topic of stock buybacks and whether they should be banned. Most recently, Chuck Schumer and Bernie Sanders wrote a piece for the New York Times arguing that buybacks are nothing more than corporate self-indulgence that leads to long-term harm to both companies and the economy. This may be true and, with equity valuations at or near all-time highs, buybacks certainly appear uneconomic at current prices but this is no reason to ban them. Companies should be allowed to throw money down the drain if they so choose. It’s a free country, as they say.
That said, there is a very good reason for banning buybacks and it’s the very same reason they were banned for decades before the Reagan administration allowed them to recommence in 1982: They are nothing more than stock manipulation on a massive scale.
As John Authers recently pointed out, “For much of the last decade, companies buying their own shares have accounted for all net purchases. The total amount of stock bought back by companies since the 2008 crisis even exceeds the Federal Reserve’s spending on buying bonds over the same period as part of quantitative easing. Both pushed up asset prices.” Let me rephrase that: there have been essentially no other buyers of equities over the past decade besides the companies themselves and they’ve spent over $4 trillion at it, even as liquidity has fallen to record lows.
So it’s not hard to understand how valuations have gone to the moon. Without that $4 trillion in stock buybacks and in a market where trading volume has been falling for decades they never would have been able to soar as high as they have. The chart below plots “The Buffett Yardstick” (total equity market capitalization relative to gross national product) against total net equity issuance (inverted). Since the late-1990’s both valuations and buybacks have been near record highs. Is this just a coincidence? Considering all of the above I think it’s safe to say it’s not.

The question then becomes why would management seek to inflate the valuation of their firm’s equity? The answer is very simple. As the Financial Times recently put it, “Corporate executives give several reasons for stock buybacks but none of them has close to the explanatory power of this simple truth: Stock-based instruments make up the majority of their pay and in the short term buybacks drive up stock prices.”
This is not just an inference made from the clear incentive executives have to fatten their own pockets. Harvard Business Review recently noted there is a statistical relationship between equity-based pay and buyback activity: “We find that the more vesting equity the CEO has in a given quarter, the higher the likelihood is of both buybacks and M&A. Like investment cuts, buybacks and M&A could be good rather than bad — but we find that vesting equity leads to the bad type.”
In addition, the Roosevelt Institute found another curious statistic: “In the first 8 days after a buyback announcement, insiders sell an average of $500,000 worth of stock per day—a five-fold increase as compared to the normal daily average of $100,000.” So the history of buybacks over the past several decades show that they are implemented when executives would most benefit from juicing the stock price and they take full advantage by selling heavily back to their own company.
If this isn’t stock manipulation, I don’t know what is.
Now I’m sure there are shareholders who would be unhappy with my criticism in this regard as they feel they have benefited alongside management during this time. That may be true in the short run. Manipulating the stock price certainly feels good to existing shareholders while it’s happening. However, repurchases made at prices that are uneconomic are damaging to the long-term health of the company.
Here again, history (and the chart above) shows that stock buybacks are pro-cyclical. Companies repurchase far more shares at peak valuations and then they halt buybacks altogether, or worse, issue shares when valuations are at their lows. As HBR puts it, there is just too much incentive for the “bad type” of stock buybacks – those that benefit execs in the short run and harm investors in the long run. What’s more, this cycle has seen the greatest amount of debt-financed buyback activity in history. Executive teams have leveraged up their companies to record levels while paying record valuations. As my friend John Hussman put it, corporate executives have, “quietly placed investors on margin.”

The bill will not come due for all of this leveraged equity manipulation until the next recession and concomitant credit crisis. And considering the size the of the leveraged buyback party executives have thrown over the past decade I think it’s safe to say the hangover is going to be just as riotous, though not in a celebratory way. At that point shareholders will be made painfully aware of the true cost of inebriating their upper managements with massive equity compensation and then giving them the keys to the financial car.
The good news is there is a very simple fix here. Stock buybacks in the open market should be banned because they are clearly the single greatest form of market manipulation that exists today. However, this would not preclude companies from putting together tender offers for their own shares. The difference between open market repurchases and a tender offer is night and day. Restricting companies to making tender offers would eliminate the ability to manipulate prices at the discretion of executives. Yet it would still provide a way for companies to deploy capital as they see fit and in a way that is much more forthright and fair to everyone involved.
Clearly, the rationale behind the original ban on stock buybacks was valid. The history of buybacks since their reinstatement over 35 years ago clearly demonstrates this. Hopefully, legislators will see the value in maintaining corporate determination of their own capital allocation while banning practices like open market activities that, in many cases, are clearly against the interest of every stakeholder outside of the executive suite.
8 notes
·
View notes
Text
The Worst Possible Environment For Stock Market Investors

This post first appeared at TheFelderReport.com.
“For the investor, a too-high purchase price for the stock of an excellent company can undo the effects of a subsequent decade of favorable business developments.” -Warren Buffett
“My greatest discovery was that a man must study general conditions, to size them so as to be able to anticipate probabilities.” -Jesse Livermore
It’s popular these days to note that valuation is not a good timing tool. While it may be helpful in understanding the prospects for long run returns it just has little utility for those focused on the near term. At the same time, technical analysis, or more precisely trend analysis, can be helpful in understanding the short-term dynamics in the markets but has little value for those trying to understand the likely trajectory and velocity of stocks over a longer period of time.
This is one of the reasons I have tried to utilize both to try to overcome the shortcomings of each in my own investing process. And I came to this process by learning about the markets the hard way. Buying cheap stocks that are in strong downtrends rarely works out okay; I can testify to that. Conversely, buying stocks trading at their most expensive valuations in history, even if they remain in an uptrend, rarely works well for a long-term investor.
The same can be said about the broad market. A cheap stock market in an uptrend is the ideal scenario as it presents investors with an opportunity to take advantage of greater long run returns and, hopefully, get the timing right. On the flip side, an expensive stock market in a downtrend represents the worst of all possible environments as it likely means poor long run returns punctuated by steep downdrafts.
Currently, this latter one is the situation we currently find ourselves in. The stock market today has rarely, if ever, been more expensive (Robert Shiller’s CAPE ratio current stands at 30). At the same time, it has just recently entered a new downtrend (as defined by price relative to its 200-day moving average). If history is any guide (see the insets in the chart below), investors would be wise to adopt a defensive approach so long as these two ominous conditions exist in concert.

Many thanks to Jason Goepfert (@SentimenTrader) for running the numbers for me.
2 notes
·
View notes
Text
Why Warren Buffett Would Be Buying Precious Metals Again Today (If He Could)

This post first appeared at TheFelderReport.com.
Warren Buffett is famous for many things one of which is his general dislike for precious metals as an investment. But maybe you’re old enough to remember when, just over 20 years ago, he backed up the truck and bought a ton of silver – over 3,000 tons, to be more precise. From the 1997 Berkshire Hathaway letter to shareholders:
Our second non-traditional commitment is in silver. Last year, we purchased 111.2 million ounces. Marked to market, that position produced a pre-tax gain of $97.4 million for us in 1997. In a way, this is a return to the past for me: Thirty years ago, I bought silver because I anticipated its demonetization by the U.S. Government. Ever since, I have followed the metal’s fundamentals but not owned it. In recent years, bullion inventories have fallen materially, and last summer Charlie and I concluded that a higher price would be needed to establish equilibrium between supply and demand.

Maybe you’re even old enough to remember that earlier time, just about 50 years ago, when the Oracle of Omaha amassed a position in silver. Either way, it’s interesting to look back at why he did so. “Demonetization by the U.S. Government,” was his thesis back in 1967. Essentially, he made a bet on the devaluation of the dollar against the gold price and chose silver as his trade vehicle. And there are some interesting parallels between then and today.

The dollar is no longer convertible into gold as it was back then but the dynamics that forced the discontinuation of this convertibility are still at work. Wikipedia discusses the “Nixon shock” by explaining that, “from 1950 to 1969, as Germany and Japan recovered, the US share of the world’s economic output dropped significantly, from 35% to 27%.” The very same situation is happening again today, only it is China taking share of the world’s economic output even as the dollar remains the world’s reserve currency.
The story continues, “furthermore, a negative balance of payments, growing public debt incurred by the Vietnam War, and monetary inflation by the Federal Reserve caused the dollar to become increasingly overvalued in the 1960s.” The negative balance of payments is far greater today even when normalized for the relative size of the economy, again thanks to our relationship with China, as is the rapidly growing pile of public debt.
And if you haven’t noticed the monetary inflation created by the Fed over the past decade you must have been living under a rock. The currency component of M1 is currently growing at an annual rate of 7%, a growth rate it first hit in May of 1966. It’s no longer the president’s purview to demonetize the dollar; it’s the market’s. And I’ll leave you decide whether the market should do so today based upon the aforementioned dynamics.
But it’s also important to look at his later thesis for buying silver: “In recent years, bullion inventories have fallen materially, and last summer Charlie and I concluded that a higher price would be needed to establish equilibrium between supply and demand.” Currently, we have a very similar situation in gold. As my friend, Luke Gromen, recently pointed out on twitter, registered gold stocks are currently testing their lowest levels on record. Thus it appears that a higher price is, “needed to establish equilibrium between supply and demand.”

All in all, it looks like buying gold today fits neatly into the Warren Buffett way of investing in precious metals. He may not be buying precious metals today – with all of the Comex registered gold stocks totaling just $165 million he could buy it all up and still not commit 1% of the total cash on hand at Berkshire Hathaway – but that doesn’t mean investors who understand the simple dynamics of supply and demand shouldn’t be doing so using the very same thesis he has used successfully in the past.
1 note
·
View note
Text
DotCom Deja Vu
The following is an excerpt from a recent chart book from The Felder Report Premium.
In a recent interview for RealVision Stan Druckenmiller spoke about how he realized late in 2000 that rising interest rates (second pane in the chart below), oil prices (third pane) and the dollar (bottom pane) were almost always a recipe for lower corporate earnings (top pane). This gave him the confidence to put on a very large short position backed by the idea that analysts were far too optimistic about future earnings. Looking at what interest rates, oil and the dollar have done recently it appears there’s a distinct possibility of a very similar disappointment playing out over the next few quarters.

Certainly, as noted by Top Down Charts recently, expectations of forward earnings growth have not been as optimistic as they are today since that inauspicious time.

Finally, the similarity between the price pattern of the S&P 500 today and the pattern it put in at the 2000 top may also be worth taking note of (chart via Nautilus Research).

All in all, investors may want to consider the possibility of another earnings disappointment that leads to a reevaluation of the merits of paying some of the most ridiculous prices in history, especially at a time when liquidity is being withdrawn at an unprecedented rate.
3 notes
·
View notes
Text
Yes, The Stock Market Is Just As ‘Stupid-Bat-$hit-Crazy Expensive’ Today As It Was At The Peak Of The DotCom Mania

This post first appeared at TheFelderReport.com.
It was almost a year ago I wrote “What Were You Thinking?” referring to a quote from an interview with Sun Microsystems CEO, Scott McNeely, that he gave a year or two after the peak of the DotCom mania:
At 10 times revenues, to give you a 10-year payback, I have to pay you 100% of revenues for 10 straight years in dividends. That assumes I can get that by my shareholders. That assumes I have zero cost of goods sold, which is very hard for a computer company. That assumes zero expenses, which is really hard with 39,000 employees. That assumes I pay no taxes, which is very hard. And that assumes you pay no taxes on your dividends, which is kind of illegal. And that assumes with zero R&D for the next 10 years, I can maintain the current revenue run rate. Now, having done that, would any of you like to buy my stock at $64? Do you realize how ridiculous those basic assumptions are? You don’t need any transparency. You don’t need any footnotes. What were you thinking?
More recently Kevin Muir of TheMacroTourist (whose work I greatly admire and highly recommend) referenced this same quote on twitter writing, “I hate to say it, but whenever you are feeling like today’s market is stupid-bat-s$hit-crazy expensive, take a gander at this gem from Scott McNealy about the DotCon bubble….” implying that stocks today aren’t nearly as expensive as they were back then. And I think most people currently believe this.
The truth, however, is that, according to the standard Mr. McNeely referenced, the stock market is exactly as “stupid-bat-s$hit-crazy expensive” as it was back then. In fact, according to Kevin’s data, fully 332 of the Russell 3000 components currently trade above 10x Revenues, 52 more than the 280 total seen in March of 2000, the month the Nasdaq put in its top.

As noted in my last piece, Sun Microsystems saw its stock price fall from a peak of $64 to a low of just $5 in only a couple years’ time. So who will be the Sun Micro of the current cycle? Your guess is as good as mine but below is the list of the 30 stocks in the S&P 500 trading at more than 10x revenues. Let’s call it the short list of candidates to eventually inspire investors to ask themselves, ‘what was I thinking?’

4 notes
·
View notes
Text
The Fundamental Case For Owning Gold Today

This post first appeared at TheFelderReport.com.
Recently my friend Ben Hunt pointed out that gold is really more a hedge against a central bank mistake than a hedge against geopolitical upheaval. I agree but I believe gold is an effective hedge against a fiscal mistake, as well. In other words, when the government gets very aggressive in a budgetary sense it can be positive for gold. And I guess these two points are related.
Many times a central bank mistake forces the fiscal authorities to step in and get aggressive with the budget. Just think of the financial crisis. The Fed engineered a real estate bubble that, when it burst, forced the Treasury to step in and backstop the financial system to the tune of hundreds of billions of dollars. The federal government was also forced to implement significant fiscal stimulus during the recession that followed. This led to a record budget deficit of over a trillion dollars and the gold price soared.
Whether gold soared at that time due to the central bank mistake or to the fiscal authorities response is certainly debatable. That gold initially declined into the crisis and then soared alongside the federal deficit until well after the crisis had been apparently averted, though, is a fact.
Since then the budget deficit has narrowed and gold prices have fallen. However, the CBO estimates that, as a result of the recent tax cuts, the deficit will again surpass a trillion dollars by 2020. In this case, we have the fiscal authorities getting aggressive outside of recession or a central bank mistake. In my view, this provides a positive backdrop for gold prices all by itself.
Furthermore, if we get a recession over the next few years, (perhaps precipitated by a central bank mistake?) we could actually see a $2 trillion deficit by 2021. And it’s hard to see how that wouldn’t be very bullish for the yellow metal that everyone seems so keen to condemn currently.

3 notes
·
View notes
Text
The Heroic Assumptions Behind Today’s Unprecedented Equity Valuations

The following is an excerpt of a recent market comment that first appeared at The Felder Report Premium.
What is the opposite of a margin of safety? That is a question this market has had me asking myself for some time now. A margin of safety is a discount to intrinsic value that provides a safety net in the result of an error in analysis or unforeseen negative developments. The opposite of a margin of safety then is a premium to intrinsic value than can vanish even if your analysis is correct or things go unexpectedly in your favor. There are times when a security reaches a valuation such that even if everything goes right you’re unlikely to profit. The price has already discounted a perfect outcome. This “priced for perfection” scenario is the opposite of a margin of safety and this is currently where the stock market finds itself today.
So what exactly is this perfection that is currently built into stock market valuations? First, equity valuations have risen in recent years to their record heights at present as a result of investors making a classic mistake. Whether consciously or unconsciously, they have essentially lowered the discount rate in their valuation models without also lowering the assumed growth rate of earnings. As Cliff Asness demonstrated years ago in his paper “Fight The Fed Model,” this is clearly irrational behavior. Because interest rates and earnings growth are so highly correlated one cannot be modified without the other in a discounted cash flow model. In other words, falling interest rates do no justify higher equity valuations. This doesn’t, however, stop investors from believing this very thing.
Furthermore, for this decision to pay higher prices as a result of lower interest rates to avoid a very painful outcome it requires that interest rates remain low indefinitely and that investors continue to make this error in judgement. In essence then it is a bet on interest rates and a “greater fool” trade in one. This is the perfect scenario embedded in the stock market today and it’s already discounted, meaning that even if it comes to pass investors stand to benefit very little if at all. However, should either fail to materialize the downside to equity valuations is significant. But this is not all that is required for today’s equity investor to come out unscathed.
Price-insensitive buying on the part of passive investors, central banks and corporations themselves have been the primary demand drivers of equities in recent years. For equity valuations to avoid reverting closer to a historical average these will be required to at least maintain their current pace of buying. Most importantly, record corporate stock buyback activity will be required to continue to make up for the demographic headwind to equity valuations.
The question of, “Who will baby boomers have to sell to?” is about more than just real estate. It’s also about equities. The Fed has estimated that over the coming years demographic trends could mean the stock market reverts to a price-to-earnings ratio of 8 versus 24 today. Without record stock buyback activity or radical central bank intervention this outcome becomes a near certainty. Thus there is another perfect scenario embedded in today’s equity valuations, that the current price-insensitive demand will continue indefinitely.
Finally, there is a third embedded assumption in today’s stock prices that may present the most poignant risk at present. This is the assumption that record corporate profit margins, enabled by record low labor share, will also be maintained indefinitely. What most investors don’t understand today is that the price-to-earnings ratios they use to value any stock in the market at all are entirely reliant on sustaining margins at levels that have been historically unsustainable. Again, this assumption has already been discounted by the market.
Think of it this way: As mentioned above, the current price-to-earnings ratio of the S&P 500 is roughly 24 versus a historical average of about 15. However, should profit margins revert to a more normal historical level that valuation could soar to 35 or 50 times earnings as the denominator falls. In this scenario there is not only the potential risk of a reversion in valuations but also a reversion in profit margins at the same time, a scenario that would be doubly painful for equity investors paying current prices. Thus the premium embedded into today’s stock market also assumes profit margins will avoid reverting to historical averages.
I have written that the single greatest mistake investors make is extrapolating recent history out indefinitely into the future. Today, they may be extrapolating more than ever before. It would be something if the current equity market was discounting just one of the current extremes mentioned above being perpetuated indefinitely. I believe there is a case to be made that it is discounting all of them. And if that’s true investors stand to profit very little from them actually coming to pass in the years ahead. At the same time, if any one of these fail to materialize the downside risk to equity prices, just like current valuations, may be unprecedented, as well.
2 notes
·
View notes
Text
Why It Might Be A Good Time To Revisit Ray Dalio’s 1937 Analog

This post first appeared at TheFelderReport.com.
It was over three years ago that Ray Dalio first proposed his 1937 analog. After the presidential election, he refreshed it in the context of growing global populism so that it looks like this:
Debt Limits Reached at Bubble Top, Causing the Economy and Markets to Peak (1929 & 2007)
Interest Rates Hit Zero amid Depression (1932 & 2008)
Money Printing Starts, Kicking off a Beautiful Deleveraging (1933 & 2009)
The Stock Market and “Risky Assets” Rally (1933-1936 & 2009-2017)
The Economy Improves during a Cyclical Recovery (1933-1936 & 2009-2017)
The Central Bank Tightens a Bit, Resulting in a Self-Reinforcing Downturn (1937)
And if these fundamental parallels weren’t enough, we now have a rather interesting price parallel to consider. The correlation between the S&P 500 over the past four years (black and white candles in the chart below) and the four years leading up to the 1937 top (blue candles) is roughly 94%. As I have suggested in the past, price analogs are not very valuable on their own but when the fundamentals also parallel closely they become far more interesting.

In this case, the fundamental parallels are only getting tighter as time passes. Despite the yield curve currently sending a clear red flag, the markets are now pricing in better than even odds of two more rate hikes this year. It seems ‘central bank tightening into a self-reinforcing downturn’ is becoming a more distinct possibility as the economic cycle ages and inflation pressures grow. In other words, “the policy stakes are now very high,” and history provides a clear road map for markets.
1 note
·
View note
Text
What’s Behind The Rapid Plunge In The ‘Smart Money Index’?

This post first appeared at TheFelderReport.com.
Much has been made of the plunge in the Smart Money Index this year and for good reason. In the past, major downturns in the index like we are witnessing today have proved to be prelude to major downturns in stock prices. Many have wondered about the underlying dynamics for the decline in the index of late and I think it may be fairly easy to explain. The index simply represents the difference between the first 30 minutes of trading and the last hour. The idea here is that novice traders trade the open and more experienced traders trade the close. The difference reflects the net trading of these ‘smarter’ traders.
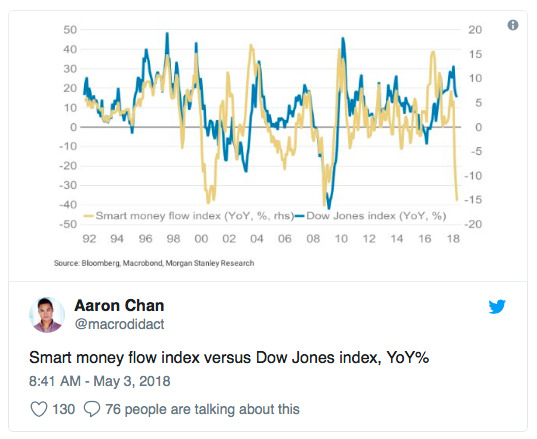
However, the truth is that with the dramatic rise in the popularity of ETFs the markets have changed a great deal in the past decade. The vast majority of trading volume is not performed by individual traders but by algorithms. In addition, the vast majority of trade volume also now occurs during the last half hour of trading as passive and other systematic vehicles perform their daily balancing acts needed to match their benchmarks.
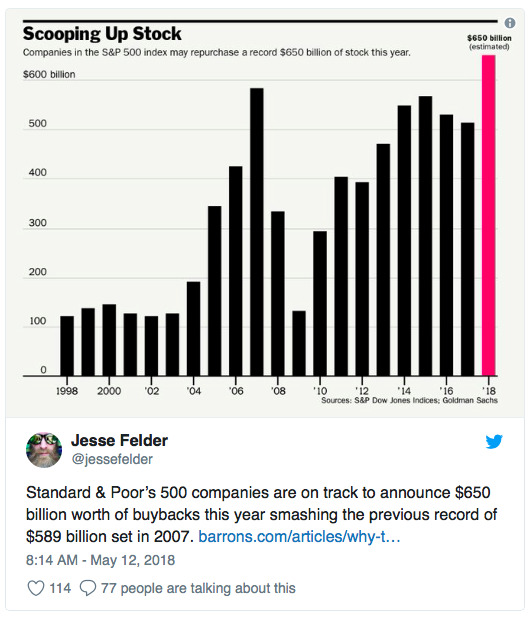
Another major change in the markets in recent years is that, more than ever before stock buybacks dominate overall demand for equities. So far this year, they have surged to a record pace. Considering the fact that buybacks are prohibited during the final half hour of trading it could be that the smart money index simply reflects the difference between corporate demand for equities (early in the day) and the natural investor demand for equities (largely reflected at the close).
And while corporations are buying hand over fist, individual investors have turned net sellers of equities over the past year. This would seem to confirm the idea that the plunge in the smart money index of late is simply a product of surging corporate demand amid waning retail demand for equities.
Still, even if this does explain the rapid decline in the smart money index it probably doesn’t do much to ameliorate its dark message. There is reason to believe that waning demand on the part of investors could be, at least in part, the product of a major demographic shift. This leaves the stock market entirely at the mercy of corporations which are notoriously bad at market timing. In fact, looking at the chart above that tracks stock buybacks you might say they are the dumbest investors in the market, pouring record amounts into equities at the highs and dramatically paring their buying at the lows. For this reason, the smart money index may live up to its moniker once again, even if the underlying dynamics have changed so dramatically since the indicator was first introduced.
1 note
·
View note
Text
Warren Buffett Thinks Bonds Are A ‘Terrible Investment’ But, According To His Own Methods, Stocks Look Even Worse

This post first appeared at TheFelderReport.com.
A couple of weeks ago Berkshire Hathaway held its annual shareholders meeting known to many as the “Woodstock for Capitalists.” I have never attended (I don’t like crowds) but I’m always curious to know what Warren Buffett and Charlie Munger have to say at the event. The two tweets below struck me as especially poignant right now.

Apparently, the Oracle of Omaha was quoted as saying, “long-term bonds are a terrible investment at anything close to current rates.” I can’t say that I disagree. The real yield on the long bond is essentially zero right now and if inflation picks up over the next three decades, as Buffett expects it to, it will quickly go negative.

But there’s another pair of observations Mr. Buffett has made in the past that should also be considered here. The first concerns comparing the value of bonds to that offered by the stock market: “Though the value equation has usually shown equities to be cheaper than bonds, that result is not inevitable: When bonds are calculated to be the more attractive investment, they should be bought.” -Warren Buffett, 1992 Berkshire Hathaway Chairman’s Letter
Bonds offer a static yield so their forward return, at least in nominal terms, is known but how do we determine what stocks offer over a specific period? Here is where his second observation comes in. A while back Buffett suggested the ratio of the total value of equities relative to the size of the economy as, “the single measure of where valuations stand at any given moment.”

What makes this measure most valuable is the fact that it is so highly (negatively) correlated with future 10-year returns in the stock market. There is no better visual representation of my favorite Buffett quote of all: “the price you pay determines your rate of return.” Pay a low price, get a high return and vice versa. Investors today are paying very close to the highest prices in history thus will inevitably receive some of the lowest returns on record.

How low? According to the Buffett yardstick, stocks are currently priced to deliver an annualized return of -3% over the next decade including dividends. Compare this to the 3% yield on the 10-year Treasury note and you’re looking at a -6% differential.

Look at that chart above and you’ll immediately see what Buffett meant when he said, “Though the value equation has usually shown equities to be cheaper than bonds, that result is not inevitable.” For the 30 years prior to his writing this in 1992 stocks consistently were priced to deliver higher returns than bonds.
Today, that’s clearly not the case. In fact, since then it’s been more common than not to see the relative value equation lean towards bonds. Even considering this change stocks are now priced such that they are extraordinarily unattractive relative to bonds. In other words, if bonds are a “terrible investment” stocks are at least as bad at today’s prices.
And inflation is, indeed going to make a comeback, as Buffett suggests, investors will want to make sure they limit their exposure to both kinds of financial assets. Additionally, they will want to ensure that they have adequate exposure to other asset classes, most importantly real ones.
3 notes
·
View notes
Text
BANG: Why The Gold Miners Could Soon Make FANG Look Tame

This post first appeared at TheFelderReport.com.
I’ve written recently about the FANG stocks and another popular group I call MCBM. Both trade at valuations that look extreme relative to their history. There’s another group, though, that I have been watching that appears to be trading at a significant discount to its normal range over the past couple of decades.
This latter group I call BANG (Barrick Gold, Agnico Eagle, Nemont Mining and Goldcorp) and I like the acronym not just because of the allusion to and juxtaposition with FANG but also due to the fact that rising gold prices could make for explosive gains in these stocks if their valuations begin to normalize at all.
The chart below plots the median enterprise value-to-revenues for the four stocks over the past 20 years. The thing that really jumps out at me is that BANG is currently cheaper today than it was in the early 2000’s at the end of the last major gold bear market when the price of the precious metal was fully $1,000 per ounce cheaper than it is today.

Some have argued that these stocks may deserve to trade at lower valuations today because the gold price has lost a third of its value over the past several years hurting profits. However, it looks as if the profitability of these companies is significantly better today than it was at the nadir of the last major bear market for gold roughly 15 years ago.

Furthermore, the median 3-year revenue growth for this group has just turned positive again as it did at the start of the last major bull market for gold and the miners.

All in all, it looks as if Mr. Market is currently pricing in a much more dire situation than the companies actually face at present. In other words, this is what a margin of safety looks like. A normalization of the valuations for this group would yield a 50% gain for the stocks even without any upside in the gold price. And if the precious metal is set to embark on another bull market, as I believe it is, the upside for these stocks could make FANG’s performance over the past few years look tame in comparison.
0 notes
Text
How The Flattening Yield Curve Could Lead To A Bear Market For Stocks

This post first appeared at TheFelderReport.com.
It seems everyone is talking about the yield curve right now. It also seems most economists and investors are quick to dismiss what would typically signal a clear economic warning as nothing worth worrying about. But from where I sit it looks like this could be a red flag worth paying close attention to.
The reason is that the yield curve, or the spread between the yield on the 10-year treasury and the 2-year treasury, appears to lead corporate spreads by about 30 months. In the chart below you’ll notice the close relationship which suggests rising risk aversion among corporate bond investors lags a flattening of the yield curve fairly consistently.

This could simply be due to the fact that a flattening curve is typically the product of rising short term interest rates which put pressure on corporate balance sheets. Investors possibly respond to this pressure with a lag only after it becomes readily apparent in their financial statements. It also could simply be the product of rising risk-free rates creating greater competition for risk assets.
Either way, a flattening yield curve, especially when it comes by way of rapidly rising short term interest rates as it does now, creates a one-two punch for risk assets. This should be of concern not only to corporate bond investors but equity investors, as well, as there is a close relationship between risk appetites for both. Widening corporate spreads, especially over the past decade, have regularly been met with falling stock prices.

Because the degree of the recent flatting in the yield curve is the greatest we have seen since the financial crisis, it is reasonable to assume that over the next 30 months there is a risk for corporate spreads to widen to their greatest degree over that span, as well. If so, it’s hard to imagine it not coinciding with continued turbulence in the stock market if not a full-fledged bear market.
2 notes
·
View notes
Text
Why We May Be Headed For Another ‘Minsky Moment’

This post first appeared at TheFelderReport.com.
I recently ran across a terrific chart in Grant’s Interest Rate Observer that got me thinking about Hyman Minsky and The Financial Instability Hypothesis. After remaining relatively unknown during the course of his lifetime, Minsky really came to fame in the immediate aftermath of the financial crisis as his hypothesis helped to explain what left most economists baffled: the fundamental cause of the crisis. Clearly, though, he has been forgotten just as quickly because, considering where we stand today, it’s obvious the economists with the greatest power to prevent another crisis have still not adopted his insights into their frameworks.
To begin to understand the current situation in Minsky terms we must first understand the hypothesis:
The first theorem of the financial instability hypothesis is that the economy has financing regimes under which it is stable, and financing regimes in which it is unstable. The second theorem of the financial instability hypothesis is that over periods of prolonged prosperity, the economy transits from financial relations that make for a stable system to financial relations that make for an unstable system. In particular, over a protracted period of good times, capitalist economies tend to move from a financial structure dominated by hedge finance units to a structure in which there is large weight to units engaged in speculative and Ponzi finance.
Next we need to understand what these financing units are:
Hedge financing units are those which can fulfill all oftheir contractual payment obligations by their cash flows… Speculative finance units are units that can meet their payment commitments on “income account” on their liabilities, even as they cannot repay the principle out of income cash flows… For Ponzi units, the cash flows from operations are not sufficient to fulfill either the repayment of principle or the interest due on outstanding debts by their cash flows from operations.
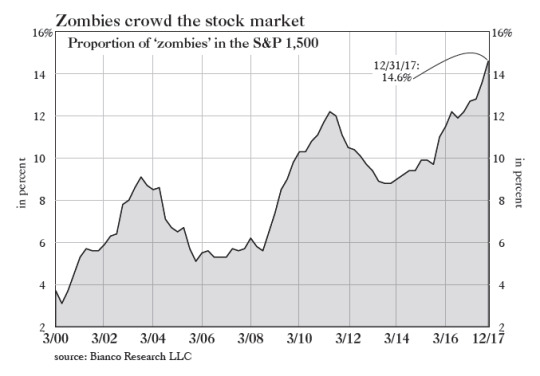
And this is what reminded me of Minsky when I read the recent article in Grant’s with the accompanying chart below. It shows the percent of companies in the S&P 500 that would fall into Minsky’s “Ponzi unit” category. Specifically, Bianco Research defines these “zombies” as companies whose interest expense is greater than their 3-year average EBIT (earnings before interest and taxes). Currently, we face the greatest percentage of “Ponzi units” in at least 20 years.
This should be worrisome to investors and even more so to those managing monetary policy because it suggests that financial instability within the economy may be greater than any other time over the past couple of decades. Minsky again:
It can be shown that if hedge financing dominates, then the economy may well be an equilibrium seeking and containing system. In contrast, the greater the weight of speculative and Ponzi finance, the greater the likelihood that the economy is a deviation amplifying system.
Those last three words are critical. “A deviation amplifying system,” simply means an economy built on a virtuous cycle that risks evolving into a vicious one. So long as interest rates remain low and investor risk appetites remain strong zombies will thrive and the economy will, as well, relatively speaking of course. However, should interest rates rise and risk appetites reverse course the risk of a self-reinforcing downturn grows. Minsky explains:
In particular… if an economy with a sizeable body of speculative financial units is in an inflationary state, and the authorities attempt to exorcise inflation by monetary constraint, then speculative units will become Ponzi units and the net worth of previously Ponzi units will quickly evaporate. Consequently, units with cash flow shortfalls will be forced to try to make position by selling out position. This is likely to lead to a collapse of asset values.
Interest rates have been rising for nearly two years now and the Fed seems to have turned its attention from cultivating a wealth effect in the economy by supporting asset prices via quantitative easing to reining in inflation by unwinding those policies and raising the Fed Funds rate. In the process, by way of the Minsky Hypothesis, they may end up undoing everything they strived so hard to achieve over the better part of the past decade.
It’s not hard to imagine just how vulnerable these zombies might be to rising interest rates and waning risk appetites. Should they be forced into liquidation a resulting collapse in asset values could present a major problems for the economy as there are plenty of reasons to believe the wealth effect may be even more powerful to the downside than it was to the upside. Either way, the threat to the economy posed by the greatest corporate zombie army in history is surely enough to make Minsky roll over in his grave.
2 notes
·
View notes
Text
Is FANG Cheap?

This post first appeared at TheFelderReport.com.
After an incredible run higher over the past couple of years and an especially remarkable ramp to kick off 2018, the FANG (Facebook, Amazon, Netflix and Alphabet, aka Google) stocks have recently come under some selling pressure leaving many investors to wonder whether this presents a unique buying opportunity in the group.
While it may be true the group is now oversold on a short-term technical basis, looking at the valuation history suggests these stocks as a group are anything but cheap. In fact, they still trade at their highest median valuation since Facebook came public back in 2012 – actually triple that level of roughly five years ago.

And while everyone is focused on tech, I’m also paying attention to that other fantastic four I first profiled a couple of months ago: MCBM (McDonald’s, Caterpillar, Boeing and 3M). Believe it or not, this group of old-school blue chips actually outperformed FANG for a lengthy period of time until very recently when they have come under at least as much selling pressure.
Here the valuation history is even more dramatic. Even after the bout of selling we have seen over the past couple of months these stocks currently trade more than 50% higher than their peak valuation at any point during the past several decades. Even at their 1987 peak just prior to the infamous crash, this group traded at a 65% discount to its current valuation.

The point is that while investor euphoria, as measured by valuations, appears to be just as extreme today it has not been confined to just one handful of stocks or even one sector as it was during the dotcom mania. It’s much broader and thus the potential risk to the overall stock market presented by a reversion in valuations to a more normal historical level is even more extreme. If the weakness in stocks to start this year is the beginning of that process it has much farther to go before it’s all said and done.
3 notes
·
View notes
Text
The Stock Market’s Most Popular ETF Puts In A Long-Term ‘Spinning Top’

This post first appeared at TheFelderReport.com.
I have been calculating DeMark Sequential signals by hand for over a decade now. It’s one tool in my technical toolbox that I have found to be very helpful in identifying major trend changes. Last year I noticed we were approaching a long-term DeMark Sequential sell signal on the SPY ETF. That quarterly 9-13-9 sell signal triggered during the fourth quarter and to paraphrase Tom DeMark, ‘the 9-13-9 is one of the most powerful signals there is.’
Stocks obviously continued higher for a bit afterwards nearly touching the 1.618 Fibonacci Extension target noted in the chart below. They reversed, however, in February and by quarter end the ETF had completed a “spinning top” candlestick. To quote StockCharts.com, “After a long advance or long white candlestick [in this case both are applicable], a spinning top indicates weakness among the bulls and a potential change or interruption in trend.”
Taken all together, the technicals appear to have lined up suggesting there is a good probability we are already in the midst of a major reversal at this point. In fact, it’s nearly the exact opposite of the bullish technical setup we saw back in 2009 (see this and this).

1 note
·
View note
Text
The ‘Index Of The Volume Of Speculation’ Hits A New Record High

This is an excerpt of a post that first appeared in The Felder Report Premium.
“Even the most circumspect friend of the market would concede that the volume of brokers’ loans—of loans collateraled by the securities purchased on margin—is a good index of the volume of speculation.” -John Kenneth Galbraith, The Great Crash 1929
When it comes to stock market sentiment, I like to give more weight to measures that track investor positioning rather than sentiment surveys. I want to know what investors are actually doing rather than what they say they’re doing. To me, the level of margin debt shows the potential supply and demand for risk assets. When margin debt is low there is plenty of potential demand and when it’s high there is plenty of potential supply. Nominal margin debt recently surpassed $600 billion dollars for the first time on record, roughly twice the amount seen at the peak of the dotcom mania.

Even when you normalize it by comparing margin debt to the overall size of the economy, margin debt has recently broken out to new highs. Notice in the chart below that for a long period of time, several decades in fact, investors were content to speculate in a leveraged manner to a very minimal degree. Even the 1987 margin debt peak in the chart below is just a ripple compared to the surge seen during the dotcom mania. There may be no better representation of the moral hazard created by interventionist monetary policy than the chart below. Ever since the “Greenspan put” came into existence just after the 1987 crash investors have embraced risk taking like never before and today’s it’s reached a new extreme.

An interesting feature of margin debt relative to GDP is that since leveraged speculation has grown so much in relation to the economy, starting in the mid-1990’s or so, there has arisen an interesting negative correlation between the ratio and forward 3-year returns in stocks. For a long period of time, when margin debt was minimal in relation to the size of the economy, there was really no relationship between the two. But since the dotcom mania when margin debt has surged to represent roughly 3% of GDP it has regularly led to 50% drawdowns over the next several years. Margin debt reached this level in 2015 and, while it looked like stocks might embark on another major drawdown in early-2016, they reversed and relationship has yet to be reasserted. Still, the idea that the amount of forced liquidation can be a factor in the magnitude of a bear market makes intuitive sense and, at least over the past half century, we have never seen what this amount of margin debt, being unwound, is capable of producing in terms of downside risk.

Looking back further in time, margin debt reached roughly 6% of GDP just prior to The Great Crash of 1929. We are just above half that level today but these current numbers also don’t include asset-backed loans which have become very popular at the major brokerage houses. Additionally, in 1929, corporations were lending money in the call markets expanding the availability of credit for the purposes of speculation. Today, cash-rich companies like Apple are lending money into the corporate bond market instead, enabling companies to leverage up their balance sheets and buy back their own shares. Obviously, this also doesn’t show up in margin debt figures. There are other similarities between today and that earlier period and, of course, many differences. The only safe conclusion to draw from this “index of the volume of speculation” hitting new record highs is that downside risk, due to the prospect of forced liquidations, is as high as it has been in at least 89 years.
0 notes