#AutoScalingGroups
Explore tagged Tumblr posts
Visit Tumblr Blog
Explore Tumblr blogs with no restrictions, modern design and the best experience.
Last Seen Tumblr Blogs


Fun Fact
Total funding amounts to $125.3M.
Text
youtube
AWS | Episode 54 | Hands-On AWS Auto Scaling | Working with Auto Scaling Group Fixed Capacity |
1 note
·
View note
Text
AWS Scale Out2 Fix — Your One‑Shot Cure for AWS Ghost Instances
AWS Scale Out2 Fix is the quickest way to wipe out ghost instances, end API throttling, and slash surprise EC2 bills. If you’ve ever watched your Auto Scaling Group spiral out of control, you need this AWS Scale Out2 Fix playbook—right now.
Full deep‑dive → AWS Scale Out2 Fix: Ghost Instances & Throttling
🚨 Why AWS Ghost Instances Happen
Stuck lifecycle hooks keep nodes in Pending.
Health‑check mismatches fool Auto Scaling.
API throttling hides real‑time capacity. The answer? AWS Scale Out2 Fix.
⚡ 3‑Step AWS Scale Out2 Fix Quick Remedy
Suspend scaling. aws autoscaling suspend-processes --auto-scaling-group-name <asg>
Terminate orphans. Script hunts Pending nodes → terminates.
Resume & monitor. resume-processes and watch CloudWatch settle.
Ghosts gone, costs cut. That’s AWS Scale Out2 Fix magic.
🔧 Harden with AWS Scale Out2 Fix Best Practices
Align ELB grace periods.
Lift DescribeAutoScalingGroups rate limits.
Auto‑finish lifecycle hooks via Lambda.
Adopt target‑tracking policies.
Keep repeating AWS Scale Out2 Fix in your ops checklist until it’s second nature.
📝 Copy‑Paste AWS Scale Out2 Fix Script
#!/usr/bin/env bash asg="$1" aws autoscaling suspend-processes --auto-scaling-group-name "$asg" aws autoscaling describe-auto-scaling-groups \ --auto-scaling-group-names "$asg" \ --query 'AutoScalingGroups[0].Instances[?LifecycleState==`Pending`].InstanceId' \ --output text | \ xargs -r aws ec2 terminate-instances --instance-ids aws autoscaling resume-processes --auto-scaling-group-name "$asg" echo "✅ AWS Scale Out2 Fix applied"
Run it, sip coffee, and let AWS Scale Out2 Fix save the day.
📚 Learn More
All the gritty details—Terraform snippets, cost charts, and troubleshooting—live here: 👉 AWS Scale Out2 Fix: Ghost Instances & Throttling
0 notes
Photo

Auto Scalingからインスタンスをデタッチ・アタッチ https://ift.tt/32xcvre
1. 概要
Auto Scalingグループ内のインスタンスをメンテナンスする — 2.1. 手順 — 2.2. 作業準備 — 2.3. インスタンスをデタッチする — 2.4. インスタンスのタイプを変更する — 2.5. インスタンスをアタッチする — 2.6. 起動テンプレートのインスタンスタイプを変更する
概要
今回は、EC2 Auto Scaling 利用時のAuto Scalingグループからインスタンスをデタッチ、アタッチする方法をご紹介します! メンテナンスやテスト等の目的で、���でに動作しているAuto Scaling グループからインスタンスを削除や追加が可能です。
Auto Scalingグループ内のインスタンスをメンテナンスする
手順
今回のシチュエーションは、Auto Scalingグループからインスタンスをデタッチして、インスタンスタイプを変更、再度アタッチする流れの作業をご紹介します。なお、Auto Scalingグループのインスタンスは起動テンプレートから起動しているため、最終的に起動テンプレートの更新も行います。
作業は、ダウンタイムを回避するため、下記の流れとなります。
Auto Scalingグループから1台目のインスタンスをデタッチ
1台目のインスタンスタイプを変更
1台目のインスタンスをAuto Scalingグループにアタッチ
Auto Scalingグループから2台目のインスタンスをデタッチ
2台目のインスタンスタイプを変更
2台目のインスタンスをAuto Scalingグループにアタッチ
起動テンプレートのインスタンスタイプを変更
上記手順以外に、あらかじめ起動テンプレートのインスタンスタイプを更新して、4台までスケールアウトし、2台にスケールインする方法もあります。状況に合わせて、作業手順を計画しましょう。
作業準備
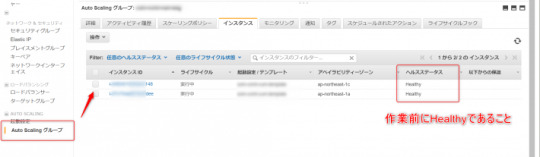
現在、対象のインスタンスは2台あり、タイプはc5.largeとなります。
作業前に、Auto Scalingグループに登録されているインスタンスのヘルスステータスがhealthy であることを確認します。unhealthy の場合は、原因を調査・対処して、正常な状態から作業を開始しましょう。
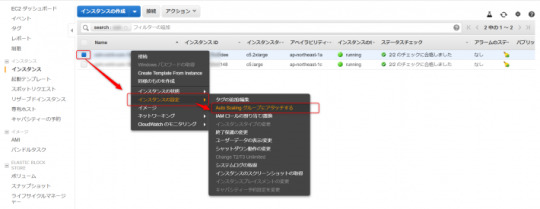
インスタンスをデタッチする
続けて、Auto Scalingグループのインスタンスより、一方のインスタンスを選択して、デタッチを行います。

インスタンスのデタッチ時に下記の確認が表示されます。インスタンスのデタッチ時に代替のインスタンスを追加する(Auto Scalingグループの希望数を維持する)場合はチェックを付けます。チェックを付けない場合、インスタンスのデタッチに合わせて、Auto Scalingグループの希望数が減ります。

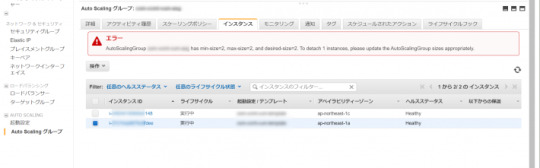
インスタンスの最小数(min-size)が2であったため、下記のエラーが表示されました。
「AutoScalingGroup XXXXXXXXXX has min-size=2, max-size=2, and desired-size=2. To detach 1 instances, please update the AutoScalingGroup sizes appropriately.」
Auto Scalingグループの最小数を”1″ に変更して、再度デタッチを行います。
インスタンスがデタッチ中となりました。希望数が”2″から”1″ に変わったことが分かります。インスタンスはELBの登録から解除され、Auto Scalingグループから切り離されます。
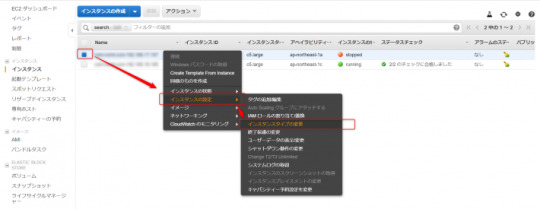
インスタンスのタイプを変更する
デタッチしたインスタンスを停止し、インスタンスのタイプを変更します。今回は、c5.2xlargeに変更します。
インスタンスをアタッチする
インスタンスを起動し、インスタンスをアタッチします。
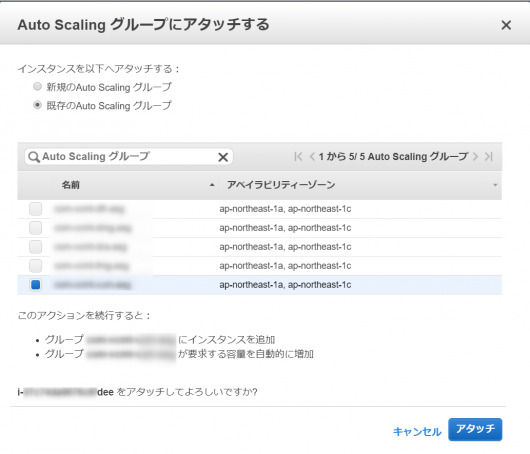
インスタンスのアタッチ時に下記の確認が表示されます。「既存のAuto Scalingグループ」を選択し、元のグループ名を選びます。アタッチを押すと、Auto Scalingグループへの追加とELBの登録が行われます。
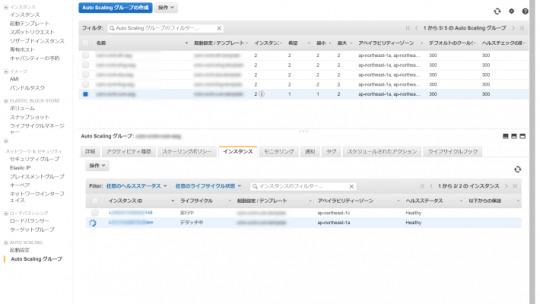
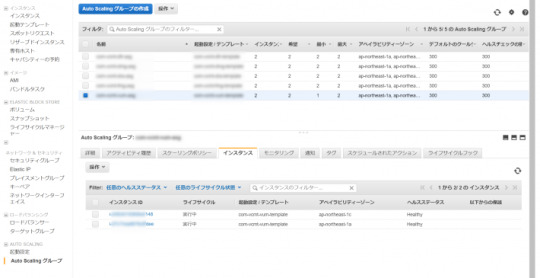
Auto Scalingグループへのアタッチが完了しました。

インスタンスがアタッチされると、Auto Scalingグループの希望数が”1″から”2″ に戻っていることが分かります。
上記手順と同様に、Auto Scalingグループの他方のインスタンスをデタッチ、インスタンスタイプを変更、再度アタッチします。
インスタンスの作業が2台とも完了したら、忘れずにAuto Scalingグループの最小数を”2″ に戻します。
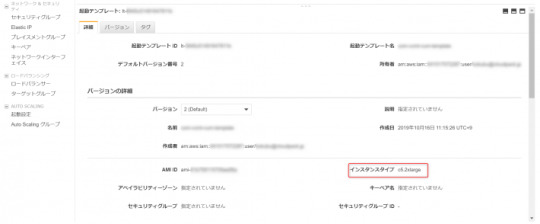
起動テンプレートのインスタンスタイプを変更する
今回は、起動テンプレートを使ってAuto Scalingを行っているため、起動テンプレートのインスタンスタイプも変更します。これで、次から新たに起動するインスタンスは、変更後のタイプで起動されます。
いかがでしたか? 今回は、Auto Scalingグループからインスタンスをデタッチ・アタッチしてインスタンスをメンテナンスする方法をご紹介しました。この方法はメンテナンス以外にテスト目的で、インスタンスを 1台切り離すといったことにも利用できますね。
また、他の方法として、一時的なインスタンス数の増加が許容できれば、あらかじめ起動テンプレートのインスタンスタイプを更新して、4台までスケールアウトし、2台にスケールインする方法もあります。ご活用ください。
元記事はこちら
「Auto Scalingからインスタンスをデタッチ・アタッチ」
November 11, 2019 at 02:00PM
0 notes
Text
Original Post from Amazon Security Author: Vesselin Tzvetkov
Controlling outbound communication from your Amazon Virtual Private Cloud (Amazon VPC) to the internet is an important part of your overall preventive security controls. By limiting outbound traffic to certain trusted domains (called “whitelisting”) you help prevent instances from downloading malware, communicating with bot networks, or attacking internet hosts. It’s not practical to prevent all outbound web traffic, though. Often, you want to allow access to certain well-known domains (for example, to communicate with partners, to download software updates, or to communicate with AWS API endpoints). In this post, I’ll show you how to limit outbound web connections from your VPC to the internet, using a web proxy with custom domain whitelists or DNS content filtering services. The solution is scalable, highly available, and deploys in a fully automated way.
Solution benefits and deliverables
This solution is based on the open source HTTP proxy Squid. The proxy can be used for all workloads running in the VPC, like Amazon Elastic Compute Cloud (EC2) and AWS Fargate. The solution provides you with the following benefits:
An outbound proxy that permit connections to whitelisted domains that you define, while presenting customizable error messages when connections are attempted to unapproved domains.
Optional domain content filtering based on DNS, delivered by external services like OpenDNS, Quad9, CleanBrowsing, Yandex.DNS or others. For this option, you do need to be a customer of these external services.
Transparent encryption handling, due to the extraction of the domain information from the Server Name Indication (SNI) extension in TLS. Encryption in transit is preserved and end-to-end encryption is maintained.
An auto-scaling group with Elastic Load Balancing (ELB) Network Load Balancers that spread over several of your existing subnets (and Availability Zones) and scale based on CPU load.
One Elastic IP address per proxy instance for internet communication. Sometimes the web sites that you’re communicating want to know your IP address so they can accept traffic from you. Giving the proxies’ elastic IP addresses allows you to know what IP addresses your web connections will come from.
Proxy access logs delivered to CloudWatch Logs.
Proxy metrics, available in CloudWatch Metrics.
Automated solution deployment via AWS CloudFormation.
Out of scope
This solution does not serve applications that aren’t proxy capable. Deep packet inspection is also out of scope.
TLS encryption is kept end-to-end, and only the SNI extension is examined. For unencrypted traffic (HTTP), only the host header is analyzed.
DNS content filtering must be delivered by an external provider; this solution only integrates with it.
Services used, cost, and performance
The solution uses the following services:
AWS Network Load Balancers. See Elastic Load Balancing pricing.
Four AWS Elastic IP addresses, which are charged if not used, as described in the Elastic_IP_Addresses pricing page.
AWS Secrets Manager, which is used to store the domain list. See AWS Secrets Manager Pricing.
Squid, an open source proxy that is free of charge.
Amazon EC2 on-demand instances, on which the Squid proxies will run. See Amazon EC2 Pricing.
Amazon Linux 2 and AutoScalingGroup, which are both free of charge.
Cloud Watch Logs, which will be used to store the Squid access log. See Cloud Watch pricing.
In total, the solution costs a few dollars per day depending on the region and the bandwidth usage. If you are using a DNS filtering service, you may also be charged by the service provider.
Note: An existing VPC and internet gateway are prerequisites to this solution, and aren’t included in the pricing calculations.
Solution architecture
Figure 1: Solution overview
As shown in Figure 1:
The solution is deployed automatically via an AWS CloudFormation template.
CloudWatch Logs stores the Squid access log so that you can search and analyze it.
The list of allowed (whitelisted) domains is stored in AWS Secrets Manager. The Amazon EC2 instance retrieves the domain list every 5 minutes via cronjob and updates the proxy configuration if the list has changed. The values in Secrets Manager are provisioned by CloudFormation and can be read only by the proxy EC2 instances.
The client running on the EC2 instance must have proxy settings pointing toward the Network Load Balancer. The load balancer will forward the request to the fleet of proxies in the target group.
Prerequisites
You need an already deployed VPC, with public and private subnets spreading over several Availability Zones (AZs). You can find a description of how to set up your VPC environment at Default VPC Setup.
You must have an internet gateway, with routing set up so that only traffic from a public subnet can reach the internet.
You don’t need to have a NAT (network translation address) gateway deployed since this function will be provided by the outbound proxy.
Integration with content filtering DNS services
If you require content filtering from an external company, like OpenDNS or Yandex.DNS, you must register and become a customer of that service. Many have free services, in addition to paid plans if you need advanced statistics and custom categories. This is your responsibility as the customer. (Learn more about the shared responsibility between AWS and the customer.)
Your DNS service provider will assign you a list of DNS IP addresses. You’ll need to enter the IP addresses when you provision (see Installation below).
If the DNS provider requires it, you may give them the source IPs of the proxies. There are four reserved IPs that you can find in the stack output (see Output parameters below).
Installation (one-time setup)
Select the Launch Stack button to launch the CloudFormation template:
Note: You must sign in your AWS Account in order to launch the stack in the required region. The stack content can also be downloaded here.
Provide the following proxy parameters, as shown in Figure 2:
Allowed domains: Enter your whitelisted domains. Use a leading dot (“.”) to indicate subdomains.
Custom DNS servers (optional): List any DNS servers that will be used by the proxy. Leave the default value to use the default Amazon DNS server.
Proxy Port: Enter the listener port of the proxy.
Instance Type: Enter the EC2 instance type that you want to use for the proxies. Instance type will affect vertical scaling capabilities and solution cost. For more information, see Amazon EC2 Instance Types.
AMI ID to be used: This field is prepopulated with the Amazon Machine Image (AMI) ID found in AWS Systems Manager Parameter Store. By default, it will point toward the latest Amazon Linux 2 image. You do not need to adjust this value.
SSH Key name (optional): Enter the name of the SSH key for your proxy EC2 instances. This is relevant only for debugging, or if you need to log in on the proxy servers. Consider using AWS Systems Manager Session Manager instead of SSH.
Next, provide the following network parameters, as shown in Figure 2:
VPC ID: The VPC where the solution will be deployed.
Public subnets: The subnets where the proxies will be deployed. Select between 2 and 3 subnets.
Private subnets: The subnets where the Network Load Balancer will be deployed. Select between 2 and 3 subnets.
Allowed client CIDR: The value you enter here will be added to the proxy security group. By default, the private IP range 172.31.0.0/16 is allowed. The allowed block size is between a /32 netmask and an /8 netmask. This prevents you from using an open IP range like 0.0.0.0/0. If you were to set an open IP range, your proxies would accept traffic from anywhere on the internet, which is a bad practice.
Figure 2: Launching the CloudFormation template
When you’ve entered all your proxy and network parameters, select Next. On the following wizard screens, you can keep the default values and select Next and Create Stack.
Find the output parameters
After the stack status has changed to “deployed,” you’ll need to note down the output parameters to configure your clients. Look for the following parameters in the Outputs tab of the stack:
The domain name of the proxy that should be configured on the client
The port of the proxy that should be configured on the client
4 Elastic IP addresses for the proxy’s instances. These are used for outbound connections to Internet.
The CloudWatch Log Group, for access logs.
The Security Group that is attached to the proxies.
The Linux command to set the proxy. You can copy and paste this to your shell.
Figure 3: Stack output parameters
Use the proxy
Proxy setting parameters are specific to every application. Most Linux application use the environment variables http_proxy and https_proxy.
Log in on the Linux EC2 instance that’s allowed to use the proxy.
To set the shell parameter temporarily (only for the current shell session), execute the following export commands:
[ec2-user@ip-10-0-1-18 ~]$ export http_proxy=http://: [ec2-user@ip-10-0-1-18 ~]$ export https_proxy=$http_proxy
Replace with the domain of the load balancer, which you can find in the stack output parameter.
Replace with the port of your proxy, which is also listed in the stack output parameter.
Next, you can use cURL (for example) to test the connection. Replace with one of your whitelisted URLs:
[ec2-user@ip-10-0-1-18 ~]$ curl -k -k …
You can add the proxy parameter permanently to interactive and non-interactive shells. If you do this, you won’t need to set them again after reloading. Execute the following commands in your application shell:
[ec2-user@ip-10-0-1-18 ~]$ echo 'export http_proxy=http://:' >> ~/.bashrc [ec2-user@ip-10-0-1-18 ~]$ echo 'export https_proxy=$http_proxy' >> ~/.bashrc [ec2-user@ip-10-0-5-18 ~]$ echo 'export http_proxy=http://:' >> ~/.bash_profile [ec2-user@ip-10-0-5-18 ~]$ echo 'export https_proxy=$http_proxy' >> ~/.bash_profile
Replace with the domain of the load balancer.
Replace with the port of your proxy.
Customize the access denied page
An error page will display when a user’s access is blocked or if there’s an internal error. You can adjust the look and feel of this page (HTML or styles) according to the Squid error directory tag.
Use the proxy access log
The proxy access log is an important tool for troubleshooting. It contains the client IP address, the destination domain, the port, and errors with timestamps. The access logs from Squid are uploaded to CloudWatch. You can find them from the CloudWatch console under Log Groups, with the prefix Proxy, as shown in the figure below.
Figure 4: CloudWatch log with access group
You can use CloudWatch Insight to analyze and visualize your queries. See the following figure for an example of denied connections visualized on a timeline:
Figure 5: Access logs analysis with CloudWatch Insight
Monitor your metrics with CloudWatch
The main proxy metrics are upload every five minutes to CloudWatch Metrics in the proxy namespace:
client_http.errors /sec – errors in processing client requests per second
client_http.hits /sec – cache hits per second
client_http.kbytes_in /sec – client uploaded data per second
client_http.kbytes_out /sec – client downloaded data per second
client_http.requests /sec – number of requests per second
server.all.errors /sec – proxy server errors per second
server.all.kbytes_in /sec – proxy server uploaded data per second
server.all.kbytes_out /sec – proxy downloaded data per second
server.all.requests /sec – all requests sent by proxy server per second
In the figure below, you can see an example of metrics. For more information on metric use, see the Squid project information.
Figure 6: Example of CloudWatch metrics
Manage the proxy configuration
From time to time, you may want to add or remove domains from the whitelist. To change your whitelisted domains, you must update the input values in the CloudFormation stack. This will cause the values stored in Secrets Manager to update as well. Every five minutes, the proxies will pull the list from Secrets Manager and update as needed. This means it can take up to five minutes for your change to propagate. The change will be propagated to all instances without terminating or deploying them.
Note that when the whitelist is updated, the Squid proxy processes are restarted, which will interrupt ALL connections passing through them at that time. This can be disruptive, so be careful about when you choose to adjust the whitelist.
If you want to change other CloudFormation parameters, like DNS or Security Group settings, you can again update the CloudFormation stack with new values. The CloudFormation stack will launch a new instance and terminate legacy instances (a rolling update).
You can change the proxy Squid configuration by editing the CloudFormation template (section AWS::CloudFormation::Init) and updating the stack. However, you should not do this unless you have advanced AWS and Squid experience.
Update the instances
To update your AMI, you can update the stack. If the AMI has been updated with a newer version, then a rolling update will redeploy the EC2 instances and Squid software. This automates the process of patching managed instances with both security-related and other updates. If the AMI has not changed, no update will be performed.
Alternately, you can terminate the instance, and the auto scaling group will launch a new instance with the latest updates for Squid and the OS, starting from scratch. This approach may lead to a short service interruption for the clients served on this instance, during the time in which the load balancer is switching to an active instance.
Troubleshooting
I’ve summarized a few common problems and solutions below.
Problem Solutions I receive timeout at client application.
Check that you’ve configured the client application to use the proxy. (See Using a proxy, above.)
Check that the Security Group allows access from the client instance.
Verify that your NACL and routing table allow communication to and from the Network Load Balancer.
I receive an error page that access was blocked by the administrator. Check the stack input parameter for allowed domains. The domains must be comma separated. Included subdomains must start with dot. For example:
To include http://www.amazon.com, specify http://www.amazon.com
To include all subdomains of amazon.com as part of a list, specify .amazon.com
I received a 500 error page from the proxy.
Make sure that the proxy EC2 instance has internet access. The public subnets must have an Internet Gateway connected and set as the default route.
Check the DNS input parameter in the CloudFormation stack, if you use an external DNS service. Make sure the DNS provider has the correct proxy IPs (if you were required to provide them
The webpage doesn’t look as expected. There are fragments or styles missing. Many pages download content from multiple domains. You need to whitelist all of these domains. Use the access logs in CloudWatch Log to determine which domains are blocked, then update the stack. On the proxy error page, I receive “unknown certificate issuer.” During the setup, a self-signed certificate for the squid error page is generated. If you need to add your own certificate, you can adapt the CloudFormation template. This requires moderate knowledge of Unix/Linux and AWS CloudFormation.
Conclusion
In this blog post, I showed you how you can configure an outbound proxy for controlling the internet communication from a VPC. If you need Squid support, you can find various offerings on the Squid Support page. AWS forums provides support for Amazon Elastic Compute Cloud (EC2). When you need AWS experts to help you plan, build, or optimise your infrastructure, consider engaging AWS Professional Services.
Want more AWS Security how-to content, news, and feature announcements? Follow us on Twitter.
Vesselin Tzvetkov
Vesselin is senior security consultant at AWS Professional Services and is passionate about security architecture and engineering innovative solutions. Outside of technology, he likes classical music, philosophy, and sports. He holds a Ph.D. in security from TU-Darmstadt and a M.S. in electrical engineering from Bochum University in Germany.
#gallery-0-5 { margin: auto; } #gallery-0-5 .gallery-item { float: left; margin-top: 10px; text-align: center; width: 33%; } #gallery-0-5 img { border: 2px solid #cfcfcf; } #gallery-0-5 .gallery-caption { margin-left: 0; } /* see gallery_shortcode() in wp-includes/media.php */
Go to Source Author: Vesselin Tzvetkov How to set up an outbound VPC proxy with domain whitelisting and content filtering Original Post from Amazon Security Author: Vesselin Tzvetkov Controlling outbound communication from your Amazon Virtual Private Cloud…
0 notes
Link
0 notes
Text
Avoiding Chef-Suck with Auto Scaling Groups
I have been instrumental in helping implement a cloud solution for a large client that is interested in hosting their new applications in AWS rather than data center. The client was already using Chef for all of their data center deployments. It is only natural to leverage the same technology in AWS. We shared the same Chef server for both AWS and data center infrastructure. All of the AWS nodes are inside VPC with a VPN tunnel back to the data center. This was done so we don’t have the overhead of managing another Chef server just for the AWS infrastructure. Also all of the software packages reside behind the firewall.
Below are some of the issues we encountered using Chef with the AWS setup:
Failed first Chef run
Failed Chef runs are inevitable. However, the first Chef run is the most important since it registers the node with the Chef server so it can be managed for future Chef runs. If, for whatever reason, the first Chef run fails, you are screwed. Manual intervention will be required to join the node (I’ll give an example below).
In the data center, this is less of an issue. Since all the nodes are effectively “static”, you know when the first Chef run will happen (adding new machines, provisioning new OS). It is much easier to monitor for failed Chef runs. However, in AWS auto scale will kick in whenever it needs to so it’s much harder to monitor. Since new nodes are being provisioned all the time (auto scale), the likelihood of failing first Chef runs are much higher.
I know what you guys are thinking, if the cookbooks are written properly Chef run wouldn’t fail. This is mostly true. In AWS, IP addresses are recycled. We were running inside VPC so the subnet IP range is much smaller. IP collisions happen all the time. When a node is terminated by ASG, Chef server doesn’t know about it. Next time that same IP address appears again, Chef server will reject it. To combat this issue, we had to create additional tooling to make sure all of the IP addresses are cleaned in the Chef server.
Provision time
Chef client isn’t the fastest program in the world, but that’s not really the true issue. To provision new nodes we are running all the recipes and transferring all the necessary packages from our data center to the cloud. This can take some time, since provision from top to bottom is very common for us. You can tolerate this in the data center since it only really happens once. This can take up to 25 mins for the first Chef run to complete. In the meantime, our cluster is getting killed. There might be ways to optimize the provision time, but the bottom line is that this will always take more time than we would have liked.
False auto scale trigger
ASG can be triggered a variety of ways. For some of the applications, we use average CPU. Since Chef run happens at some predictive interval (default 30 mins). It is using up enough resources to trigger ASG when the server load is near the threshold. This is an issue because after the Chef run, the load goes back down, now ASG will terminate that newly provisioned node. We can tweak our ASG, but this became a hassle since every application has a different ASG profile.
So, what did we end up doing?
In order to combat the above issues, we ended up creating a simple tool for developers to create (bake) an Amazon Machine Image (AMI) on demand, a la Netflix style. It runs Chef-solo behind the scene, since we already have all the recipes. Actually, most of the applications are Java, we just created a common recipe. In many cases, the person deploying does not need to be technical or require any Chef work. It’s just one button push away. The important takeaway is that we version our image (AMI in this case) with the software. In general, we run one service per box and each service can be clustered (horizontal scalability). The name of the image correlates to the service version baked in. In order to release a new version of the service, a new image has to be baked, then we rotate it into the cluster. If there are no issues with the new service, the old cluster is taken down. The really nice thing about this approach is that we have all the previous versions “frozen” in the exact state. If anyone needs to hunt down a bug, it will be very easy to replicate with the exact production environment. Since everything is in an ASG, all the nodes will be launched in a predictable fashion and as fast as possible since provision isn’t happening just in time. We no longer have to worry about failures during provisioning time.
An important thing to note is that when we build a new image, we do not build it from the previous version. It starts from some known clean base, usually it is pretty bare. This way, there’s no cruft being accumulated over time.
WAIT, what about configuration management?
I know what you guys are thinking. How do you manage the configurations? How do you do service discovery? These two things are previously managed by Chef runs. We no longer run Chef client on your boxes. In order to archive this, we moved both into the application tier. This is not done solely for the sake of removing Chef to build the AMI.
Very often we want to change our application configurations as fast as possible without waiting for some predetermined period. We introduced a REST configuration service that the application will call out before starting. If for some reason that service is down, it will bootstrap itself using some known configuration, typically injected by userdata during launch time.
Service discovery1 is also moved to the application tier because everything is inside an ASG. Nodes in the cluster are always appearing or disappearing. One service needs to know where another service is. A REST service2 is provided for nodes to discover each other. When the node gets launched, it registers itself (unregister during termination). It will communicate to the discovery service periodically. Otherwise, it will be marked as unavailable. Before the service is launched it will retrieve necessary info via discovery service. Discovery service is a critical component. It runs in a cluster with replication to avoid single point of failure. Also Chef run will not save us here since it doesn’t know the cluster will be resized.
It takes a decent amount of work to get here, but it’s possible to take an incremental chiropractic approach to evolve over time. We evolved the infrastructure while we were running in production. This approach results in your application being more robust, resilient and predictable. Currently this system is doing billions of requests per day and has drastically sped up deployment and reduced deployment related issues greatly.
I am interested in hearing about your experiences, if you use Auto Scaling Groups, Chef or are experiencing pain in the cloud I'd love to hear from you: [email protected].
1 Service discovery is when a service (application) is dependent on another service to perform an operation. For example, you might have an aggregation service that needs to call out to multiple sources (services) in order to complete its task. This is very typical in an SOA environment where a discrete function has been broken up into separate services in order to leverage isolation and horizontal scalability. The simplest way to archive this is to hard code the dependent services into a configuration file. This approach will not work when the services can appear dynamically.
2 We are using Eureka from Netflix for our service discovery, but there are a number of solutions out there which I will discuss in a future post (Zookeeper, HA Proxy etc). Eureka offers a REST interface and client SDK (if you are Java) for easy consumption. The bottom line is that this is the most resilient solution we have found so far.
Written by Aaron Feng
Aaron Feng is the founder of forty9ten LLC. He is a passionate Software Engineer with a special interest in cloud based infrastructure and DevOps. He has organized various tech groups since 2007, but is most well known for Philly Lambda. He is currently organizing DockerATL. Twitter: @aaronfeng Email: [email protected]
1 note
·
View note
Text
Immutable AWS Deployment Pipeline
For the impatient readers, there’s a diagram below that shows the whole deployment pipeline. I would still suggest that you read the post for a deeper understanding.
Many organizations make the mistake of not leveraging the Amazon Machine Image (AMI) for AWS deployment. The most common deployment strategy is to provision new nodes from top to bottom as the nodes are being launched. Provision just-in-time can lead to slow and brittle deployment cycles. Running system updates, downloading packages and setup configurations can take a very long time. What’s worse is that this time is wasted for every machine you provision in AWS. I have seen machines that have taken more than 30 minutes to become useful. If anything goes wrong during provision, the machine will not function as expected, which leads to brittle deploys. One way to solve these problems is to deploy via AMI.
AMI deployment strategy has been perceived as an unmanageable manual process. The bigger issue is how to update the running system. All those things are true, but it doesn’t have to be that way. Bundling software into an Amazon Machine Image (AMI) is by far the most reliable and fastest way to deploy applications on Amazon Web Services (AWS). The unmanageable manual process can be eliminated with automation. If the system needs to be updated, new AMI can be built then deployed side-by-side with the old nodes but will receive only a portion of the traffic. Once the new nodes have been proven to function correctly, old nodes will be decommissioned. This is what is typically referred to as a Canary Deployment, which also removes the need to have any downtime during deployments.
The AMI is considered immutable because once it is built, the configuration will not be changed (from human intervention perspective). In order to release the next version of the software, a new AMI is built from a clean base, not from the previous version. In this post, I will provide a high level description of all the necessary components to build an “Immutable AMI Deployment Pipeline”. Below is a description of one way to build this deployment pipeline, but there are probably many ways to achieve the same outcome.
The Setup:
Source Control
In the the context of deployment pipeline source control provides a way for developers to transmit code to a known location so the software can be built by packager (the next step). The most important decision here is to figure out which branch of the software the deployment pipeline will be built from.
Packager
This step will pull the bits from source control and package up all of the software in an automatic fashion. The easiest way is to inject a custom tool at the end of your Continuous Integration (CI) runs. I would recommend to use your distribution's package type to package up the software. I usually like to use fpm (https://github.com/jordansissel/fpm) to build my packages. It is very flexible in terms of what it can build and is easy to get started. All the hard lifting of getting the application running should be done at this step. For example, if the application requires an upstart file, this tool should be able to construct one on the fly. Dependencies management is another common step. If the app requires nginx it should be able to "include" it. It can be as easy as depend on another package, or it can more complicated as in running a Chef script. The most important part of this step is that it needs to be able to version the package properly so it is clear what has been deployed. Depending on the complexity of the software, it might need some kind of metadata configuration file in order for this step to glue it all together. I typically will use a yaml file that is versioned with the software to provide the hint.
Artifact Repository
Once the artifact has been built, it needs to be stored in a location where it can be retrieved for installation. It also serves as a catalog of all the software that has been built and released. If you are using RPM as your package type, it makes sense to store in a yum repository. However, it can be as simple as a file server.
AMI Provisioner
AMI provisioner is a tool that will provision an instance and install the necessary software, then create an AMI at the end of the run. I typically use Chef solo (or the like) to provision the instance to a point where the target software package can be installed on top of it. For example, if you are running a Java application, Java will be installed via Chef before the target package. Once all the software has been installed, an AMI needs to be created. This can be done by using the AWS SDK. It is also possible to use open source AMI creation tool such as Aminator (https://github.com/Netflix/aminator) if you chose not to roll your own. At the end of the run, it should have created an AMI with proper naming and version to clearly define what software it contains and the version.
This tool should create the AMI in the development AWS account then grant it to the production account. I will talk more about this in the next step.
AWS EC2 Environments
Before the software can be released to production it should be tested. A separate AWS account is recommended in order to provide isolation from production nodes. The previous step should have built an AMI that is available to two AWS accounts (production and development). Depending on the organization structure, the developers might only have access to the development AWS account since you might not want everyone to be able to mess around in production. This typically applies to larger organizations with a separate team for production environment. Regardless of your organization structure, two AWS accounts should be utilized for complete isolation. This way, developers have complete freedom to experiment in the development account.
Deployment Orchestrator
We need a tool to launch the AMI in development and production account. I also recommend launching all your services inside an Auto Scaling Group (ASG) even if you don’t plan to scale up and down. There are many cases nodes might be terminated undesirably. Using an ASG ensure any terminated instances get replenished automatically.
Hopefully your software is designed to be able to distribute the load across multiple nodes. Once the AMI has been deployed inside an ASG, it can be easily scaled up and the old software can be scaled down. This will be another tool that will interface with the AWS SDK to create ASG in an automated fashion. The tool will also properly name and tag the ASG so it is clear what software has been deployed. If CloudWatch (or some other alerting system) is used, you should setup the proper alerting at this step.
It is also common to inject some environment specific configurations in this step. AWS provides an easy way to run arbitrary scripts when an instance is being booted up called userdata. If you have a lot of environments or need to change the configurations during runtime, this might not be the best option. It is better for the application to have a way to retrieve configurations dynamically. This can be done by calling some external service before the application is fully booted. The application will monitor the external service in order to realize new configuration values. The configuration service is most likely not required to get the deployment pipeline going.
If you do not wish to build something custom, Asgard (https://github.com/Netflix/asgard) may be used at this step. Asgard may be too opinionated since it was designed to deploy Netflix services, but it is worth checking out as a possible solution.
The Complete Pipeline
Once all the pieces are in place and glued together you have a complete pipeline. Any developer (or anyone, if you have fancy UI) should be able to deploy a version of the software to production with minimal effort and risk. In order for new software to get out of the door, new nodes must be provisioned. This provides an easy way to roll back to the previous version and avoid any manual cruft that might have accumulated over time. Any manual manipulation of the nodes will be wiped out in the following release. The only real way for those changes to stick is to include it as part of the pipeline. This is a high level overview of how a deployment pipeline can be constructed. Some level of engineering is required, but it will enable you to deliver value to your end users quickly and in a robust fashion.
If you have any suggestion or questions, feel free to drop me an email: [email protected]
If you are interested in building a deployment pipeline like this for your organization please email: [email protected]. We can help.
Written by Aaron Feng
Aaron Feng is the founder of forty9ten LLC. He is a passionate Software Engineer with a special interest in cloud based infrastructure and DevOps. He has organized various tech groups since 2007, but is most well known for Philly Lambda. He is currently organizing DockerATL. Twitter: @aaronfeng Email: [email protected]
0 notes