#Candlestick pattern
Explore tagged Tumblr posts
Visit Tumblr Blog
Explore Tumblr blogs with no restrictions, modern design and the best experience.
Last Seen Tumblr Blogs


Fun Fact
Tumblr’s website traffic is steadily declining.
Text
Candlestick Patterns: Mastering Market Moves with Accurate and Profitable Setups
In technical analysis, Candlestick Patterns are among the most powerful tools traders use to predict price movements. These patterns, originating from Japanese rice traders in the 18th century, provide visual cues about market sentiment, momentum, and potential reversals.
While there are dozens of candlestick formations, not all are equally reliable or easy to use. In this guide, we will focus on the most accurate and easy-to-understand candlestick patterns that offer strong profit potential, especially for swing traders and intraday traders.

What Are Candlestick Patterns?
A candlestick represents the price movement of an asset within a specific timeframe (e.g., 5-minute, daily, weekly). Each candlestick shows four key prices:
Open
High
Low
Close
The body (thick part) shows the range between the open and close. The wicks (or shadows) show the highs and lows. A green (or white) body shows a bullish candle, while a red (or black) one shows a bearish candle.
When grouped, Candlestick Patterns reveal momentum, reversals, or continuation of trends—making them highly valuable for timing trades.
1. Bullish Engulfing Pattern – Strong Buy Signal
Structure: A small red candle followed by a larger green candle that completely engulfs the previous day’s red candle.
Meaning: It indicates a strong reversal from bearish to bullish sentiment.
Best Used In: Downtrends or near support zones.
✅ Why It Works: It shows buyers stepping in with strong conviction, overpowering the previous day’s sellers.
2. Bearish Engulfing Pattern – Strong Sell Signal
Structure: A small green candle followed by a larger red candle that engulfs the previous green one.
Meaning: Suggests a reversal from bullish to bearish sentiment.
Best Used In: Uptrends, especially after a rally.
✅ Why It Works: It often signals that buyers are exhausted and sellers are gaining control.
3. Hammer – Bullish Reversal Pattern
Structure: Small body with a long lower wick, usually forming after a downtrend.
Meaning: Buyers rejected lower prices, showing potential for reversal.
Best Used In: Downtrends or oversold markets.
✅ Why It Works: Signals exhaustion of selling pressure and potential entry of buyers.
4. Shooting Star – Bearish Reversal Pattern
Structure: Small body with a long upper wick after an uptrend.
Meaning: Price attempted to rise but failed, indicating weakness.
Best Used In: Uptrends or near resistance.
✅ Why It Works: It highlights a failed rally, often followed by price correction.
5. Doji – Indecision, But Powerful with Confirmation
Structure: Very small body with long wicks, showing close is near the open.
Meaning: Market is undecided—watch for what happens next.
Best Used In: At the top or bottom of trends.
✅ Why It Works: Dojis often precede reversals, especially when followed by strong confirmation candles.
6. Morning Star – Bullish Reversal
Structure: A three-candle pattern: a long red candle, followed by a small body (Doji or Spinning Top), and a strong green candle.
Meaning: Shift from bearish to bullish momentum.
Best Used In: Downtrends or after corrections.
✅ Why It Works: Indicates transition from selling pressure to strong buying.
7. Evening Star – Bearish Reversal
Structure: Long green candle, followed by a small-bodied candle, then a long red candle.
Meaning: Sign of exhaustion in an uptrend, often preceding a downtrend.
Best Used In: Uptrends or after a bullish rally.
✅ Why It Works: Shows that buyers are losing steam and sellers are gaining control.
How to Maximize Profits with Candlestick Patterns
🔎 1. Combine with Support and Resistance
Candlestick patterns are more effective when they occur at key technical levels. For example, a Bullish Engulfing pattern at strong support offers a higher probability of success.
⚙️ 2. Use in Conjunction with Indicators
Pair candlestick patterns with tools like Relative Strength Index (RSI) or Moving Averages to confirm trend reversals or continuations.
⏱️ 3. Focus on Volume Confirmation
High volume on the reversal candle adds credibility to the signal. Volume confirms the participation of institutional players.
📈 4. Time Your Entry and Exit
Don’t trade on the pattern alone. Wait for confirmation candles or enter on the next candle’s break of the reversal level. Set clear stop-losses below/above the pattern for safety.
Final Thoughts
Candlestick Patterns are essential for anyone looking to understand price action and predict market behavior. When used correctly, patterns like the Bullish Engulfing, Hammer, and Morning Star can offer high-probability entry points for profitable trades.
What separates successful traders from the rest is not just identifying patterns but using them in the right context—with support, volume, and indicators backing them up. Simplicity, accuracy, and discipline are the keys to making candlestick patterns a reliable part of your trading strategy.
0 notes
Text
In stock market, traders rely on various share market techniques and tools to make informed decision based on the movements of price. One of the important techniques in technical trading is the Candlestick Pattern. Candlestick indicates the price movement of an asset over a specified period of time. The body of each candlestick is constructed from wicks (also known as shadows) at both ends, shows the open, high, low, and close for that particular time period. In order to help technical traders make predictions about the future movements and price patterns of the underlying asset, candlestick patterns evaluate one or more candlesticks. Before utilizing more complex patterns, it’s necessary that you understand the fundamentals of candlestick charts. Our team of experienced traders can offer valuable insights into different trading techniques. By utilizing our module for Candlestick Charts for Intraday Trading, Traders Platform can provide you a competitive advantage and educate you while you trade. Enroll in our trading course, designed for both beginners and expert traders, to learn more about technical trading and stock market strategies.
0 notes
Text
#risk management#market capitalization#india#bullish reversal#market trends#chart pattern#candlestick pattern
0 notes
Text
Unlock the Secrets of Trading with Top Chart Patterns! Explore the world of chart patterns with Funded Traders Global. From understanding the basics of technical analysis to recognizing common chart patterns like head and shoulders, double tops, and flags, our blog equips you with the knowledge to enhance your trading skills. Discover advanced patterns like pennants, wedges, and harmonic patterns, and gain practical tips for effective trading. Improve your risk management, pinpoint entry and exit points, and combine chart patterns with technical indicators. Start your journey towards trading success today with Funded Traders Global!
#Advanced Chart Pattern#and Descending Triangles#and mini trading#Ascending#Basics of Technical Analysis#Benefits of Recognizing in Chart Pattern#Bullish and Bearish Flags Pattern#candlestick#candlestick Pattern#career in forex trading#chart patterns#classic reversal pattern#common chart patterns#cup and handle pattern#Double top and double bottom patterns#drawdown#financial markets#Forex trading financial freedom#FTG#ftg prop firm#ftg trading#Funded Traders Global#Gaps#Harmonic Patterns#Head and Shoulders Pattern#how to scale into a forex trade#Macro#Master the Market with These Top Chart Patterns for Trading#mastering Forex trading#micro
0 notes
Text
10 Advanced Candlestick Patterns PDF Download
If you’re an avid trader or investor looking to sharpen your skills and gain a competitive edge, understanding and utilizing advanced candlestick patterns can be incredibly beneficial. In this article, we will explore some of the most powerful candlestick patterns that can help predict future price movements more accurately.But why should you care about candlestick patterns? Well, these…
View On WordPress
#Advanced Candlestick Patterns#Candlestick pattern#Chart pattern#FYI#IOS#Island reversal#Market sentiment#PDF#Support and resistance#Technical analysis#Three black crows#Three white soldiers#Your Arsenal
0 notes
Text


Spoonflower shop update! These designs are newly available to buy, as are a bunch of others, plus some new colour & scale variations... Take a look? spoonflower.com/profiles/rowanclair
#illustration#surface pattern design#victorian wallpaper#rose#candlesticks#chess#dragonfruit#snails#bees
49 notes
·
View notes
Text
Bullish Marubozu: An Important Signal for Uptrend
Among candlestick patterns in market analysis, the Bullish Marubozu candlestick is a bullish indicator that is simple to understand and very effective. Unlike other candlesticks, which may show shadows or wicks, the Bullish Marubozu is unique in its simplicity—it has no shadows.
What Is the Bullish Marubozu?
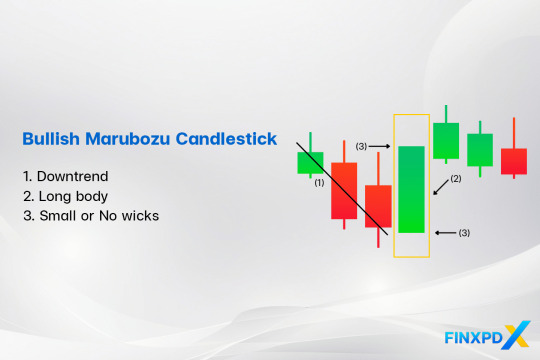
The Bullish Marubozu candlestick is a bullish candlestick pattern that shows strong buying pressure throughout the trading session. It has a long white or green body with no shadows or wicks, meaning the price opened at its lowest and closed at its highest point.
The name “White Marubozu” is another name for a Bullish Marubozu candlestick that combines its appearance and Japanese origins. “White” refers to the bullish candle color, and “Marubozu,” meaning “bald” in Japanese, describes its lack of wicks.
Characteristics of the Bullish Marubozu Candlestick
Bullish Marubozu: Features a long, solid green body with little to no wicks.
Full Bullish Marubozu: No wicks at all, showing the strongest bullish control throughout the session.
Open Bullish Marubozu: No lower wick but a small upper wick, indicating a strong upward move with slight selling pressure at the end.
Close Bullish Marubozu: A small lower wick but no upper wick, reflecting strong buying with a slightly higher open.
Read more: FinxpdX
Download PDF: 35 Powerful Candlestick Patterns
#investing#finance#investment#financial#stocks#forex#forextrading#forex market#candlestick#candlestick patterns#Marubozu#bullish#forex indicators
4 notes
·
View notes
Text
The Japanese Candlestick Charting Technique
The Japanese candlestick charting technique second edition book was written by Steve Nison. He wrote the book to understand the candlestick patterns and analyze the market.
Steve Nison structures the book from basics to advanced strategies
This Second Edition book contains:
More about intraday markets
More focus on active trading for swing, and day traders
New tactics for getting maximum use from intraday charts
New Western techniques in combination with candles
A greater focus on capital preservation.
4 notes
·
View notes
Text
Candlestick Charting: A Tale of Tradition and Innovation from Japan
Candlestick charting's rich origins in Japan reveal timeless insights into market sentiment. Embrace the past's wisdom as we navigate today's markets, confident that understanding emotions will illuminate brighter trading paths! 🚀📈 #FinancialWisdom
Candlestick charting, a vital tool for traders globally, originated in 18th-century Japan amid a feudal society and a thriving rice market. Developed by legendary trader Munehisa Homma, it visualised price movements using candlesticks, revealing market psychology and predicting trends. Steve Nison’s introduction of candlestick charting to the West in the 1980s revolutionised technical analysis.…

View On WordPress
#Bullish and Bearish Patterns#Candlestick Patterns#Feudal Japan#Financial Education#Japan#Market Psychology#Modern Trading#Price Action#Risk management#Technical Analysis
4 notes
·
View notes
Text
Unraveling the Island Reversal: A Comprehensive Guide to a Pivotal Technical Analysis Pattern
Technical analysis is a powerful tool employed by traders and investors to make informed decisions in the dynamic world of financial markets. Among the myriad of chart patterns that technicians use to predict market trends, the Island Reversal stands out as a fascinating and potentially lucrative phenomenon. In this blog post, we’ll delve into the intricacies of the Island Reversal pattern,…

View On WordPress
#Bearish Reversal#Bullish Reversal#candlestick pattern#Consolidation range#Decision-making#Financial Markets#island reversal#Market Conditions#Market Sentiment#Moving Average Convergence Divergence (MACD)#moving averages#Price gap#Relative Strength Index (RSI)#Risk Management#technical analysis#Time Frame Analysis#trading signals#Trading Strategy#Trend Reversal#Volume confirmation
0 notes
Video
youtube
Shooting StarTrading Strategy | Free Candlestick Patterns Guide | #shoo...
#youtube#Shooting StarTrading Strategy#Free Candlestick Patterns Guide#Shooting Star#how trading 2#durgesh kumar singh#durgesh singh#Candlestick Pattern#free guide#new year trading strategy#trading strategy#option trading#shooting star candlestick pattern guide
0 notes
Text
How to Spot the Bullish Belt Hold Pattern in Forex
The Bullish Belt Hold pattern is a significant bullish reversal signal in Forex trading. It consists of a single long bullish candle with no upper shadow, indicating that buyers have full control over the market. This pattern suggests a shift from a downtrend to an uptrend, presenting an opportunity to enter long positions. Recognizing the Bullish Belt Hold pattern can help traders time their entries more effectively, improving trading strategies and increasing success in the Forex market.
0 notes
Text
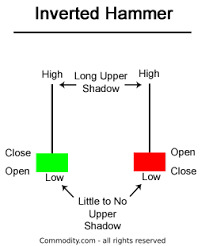
Understanding the Inverted Hammer Candlestick Pattern: A Trader's Guide
Title: Understanding the Inverted Hammer Candlestick Pattern: A Trader’s Guide Introduction: Candlestick patterns are powerful tools that traders use to analyze price movements in financial markets. One such pattern that often signals potential reversals is the inverted hammer. In this blog post, we will delve into what an inverted hammer is, how it works, and how traders can use it to make…
View On WordPress
#bullish reversal#candlestick pattern#Inverted Hammer#Risk Management#technical analysis#Trend Reversal
0 notes
Text

Types Of Candlestick Patterns And Their Meaning
Learn about types of candlestick patterns, all types of candlesticks, and their meaning to improve your stock market trading strategies
https://quanttrix.io/types-of-candlestick-patterns-and-their-meaning/
0 notes
Text
Nifty Forecast Tomorrow: Expert Predictions and Market Trends You Should Know
If you're looking for the most accurate Nifty forecast for tomorrow, you're not alone. Every day, thousands of traders and investors closely follow the Nifty 50 index, aiming to anticipate the next market move and get a step ahead of the volatility. In this post, we break down key technical levels, current sentiment, and expert-backed strategies to help you prepare for the trading session ahead.
📊 What Is the Nifty 50 and Why Its Forecast Matters
The Nifty 50 is India’s flagship stock market index, representing 50 of the largest and most liquid companies listed on the National Stock Exchange (NSE). It's a key barometer for market trends and investor confidence.
A well-researched forecast for Nifty 50 movement tomorrow can be highly valuable for:
Intraday traders planning entry and exit points.
Swing traders timing short-term opportunities.
Investors staying aligned with macroeconomic trends.
🔍 Nifty 50 Technical Analysis for Tomorrow
1. Key Support and Resistance Levels
Based on today’s market close and recent trading patterns:
Support zones: 22,300 and 22,180
Resistance zones: 22,500 and 22,640
If the index breaks above 22,500 with momentum, it may push higher. A drop below 22,180 could shift sentiment toward bearish.
2. Moving Averages
Nifty is trading above both 20-day and 50-day EMAs, suggesting the trend remains positive.
The Relative Strength Index (RSI) is around 58–60, reflecting healthy momentum without overbought conditions.
3. Candlestick Pattern
Today’s session showed indecision, forming a neutral candle. A breakout candle or a bullish engulfing pattern tomorrow would be a strong confirmation of upward momentum.
🗣️ Market Sentiment & Global Cues
Sentiment in the market remains cautiously optimistic. Some of the key global and domestic factors influencing the Nifty forecast tomorrow include:
U.S. Federal Reserve commentary on interest rates
Movement in crude oil prices
INR/USD exchange rate fluctuations
Institutional investor activity (FII/DII inflow/outflow)
FIIs were net buyers today, a signal that global appetite for Indian equities remains intact — at least for now.
📈 Expert Outlook: Nifty Forecast for Tomorrow
Analysts are leaning towards a mild bullish trend continuing into tomorrow’s session, assuming no sudden negative cues overnight. That said, volatility is likely to spike during the first hour of trade.
Here are some smart trading reminders:
Don’t chase early price gaps.
Stick to well-defined stop losses.
Wait for volume confirmation, especially near breakout zones.
💡 Tip: A breakout above 22,500 on strong volume could provide a high-probability setup for short-term trades.
🛠️ Action Plan for Traders
Intraday Traders
Observe the first 15–30 minute range for market direction.
Indicators like MACD, RSI, and volume spikes are crucial for timing entries.
Use a trailing stop-loss strategy once in profit.
Positional Traders
Consider adding long positions above 22,500 with upside targets around 22,800.
If Nifty dips below 22,180, reassess and wait for a base to form before entering.
🔗 Live Updates and Tools
Want more granular data? For real-time charts, key levels, and analyst videos, check out the full Nifty 50 forecast and live analysis page.
📬 Final Thoughts
A well-informed Nifty prediction for tomorrow helps traders cut through the noise and take calculated risks. No forecast is 100% guaranteed, but combining technical signals, market sentiment, and global cues can give you an edge.
Trade smart. Stay disciplined. And always have a plan.
#nifty forecast tomorrow#nifty 50 prediction#nifty 50 forecast#nifty technical analysis#nifty trend tomorrow#share market forecast#stock market prediction#nifty outlook#nifty analysis#nifty trading strategy#nifty support and resistance#nifty levels tomorrow#intraday trading tips#stock market india#nifty market trend#nifty tomorrow analysis#nifty movement prediction#NSE forecast#indian stock market forecast#market trend analysis#technical analysis nifty 50#nifty 50 chart#fii dii data analysis#stock market update today#trading view nifty#nifty live updates#nifty chart pattern#nifty stock tips#nifty breakout strategy#nifty candlestick analysis
0 notes
Text
0 notes