#Configuring Mapbox
Explore tagged Tumblr posts
Visit Tumblr Blog
Explore Tumblr blogs with no restrictions, modern design and the best experience.
Last Seen Tumblr Blogs


Fun Fact
The most popular pages on Tumblr are about Minecraft, GIFs, and David J. Peterson.
Text
What is the Best API for Address Autocomplete?
Address autocomplete APIs have become crucial tools for enhancing user experience and accuracy in applications involving address input. These APIs provide real-time suggestions and auto-completion of addresses based on user input, streamlining the checkout process, form filling, and location searches. Choosing the best API for address autocomplete depends on various factors such as accuracy, coverage, ease of integration, and cost. Here's a detailed look at some of the top contenders in this space:
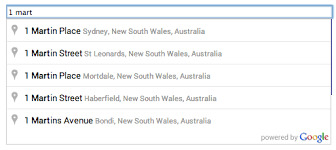
1. Google Places Autocomplete API
Key Features: Google's API offers comprehensive address predictions based on a user's input. It covers a wide range of countries and supports various address formats.
Pros: High accuracy, extensive coverage, and detailed place information.
Cons: Usage costs can escalate with large volumes, and there are usage limits for free tiers.
2. Algolia Places API
Key Features: Algolia's API provides fast and relevant address autocomplete results. It's easy to integrate and offers customizable search features.
Pros: Fast response times, straightforward integration, and generous free tier.
Cons: May require additional configuration for certain advanced features.
3. Mapbox Geocoding API
Key Features: Mapbox offers a geocoding API that includes address autocomplete functionality. It's known for its mapping capabilities and spatial data services.
Pros: Detailed geospatial data, customizable mapping solutions.
Cons: May be more complex to set up compared to dedicated autocomplete APIs.
4. SmartyStreets API
Key Features: SmartyStreets specializes in address verification and validation. Their API provides accurate suggestions for US-based addresses.
Pros: Focus on address accuracy and validation.
Cons: Limited international coverage compared to global APIs like Google's.
5. Here Geocoding & Search API
Key Features: Here offers a powerful geocoding and search API that includes address autocomplete functionality. It covers a wide range of countries and supports various languages.
Pros: Detailed mapping data, good international coverage.
Cons: Pricing can be higher for large-scale usage.
Choosing the Right API
Selecting the best address autocomplete API depends on your project's specific requirements. Factors to consider include:
Accuracy: How well does the API predict and validate addresses?
Coverage: Does the API support the countries and regions relevant to your application?
Cost: Consider the pricing structure, including free usage tiers and potential scaling costs.
Ease of Integration: Evaluate how straightforward it is to integrate and customize the API within your application.
In conclusion, the "best" API for address autocomplete varies based on your project's needs. Google Places Autocomplete API is a popular choice due to its extensive coverage and reliability, but alternatives like Algolia, Mapbox, SmartyStreets, and Here offer compelling features tailored to different use cases and regions.
youtube
SITES WE SUPPORT
API To Verify Addresses – Wix
0 notes
Text
Store Locator Software Market is Booming – Gaining Revolution in Eyes of Global Exposure | Bold Commerce, Leadformance, Bullseye Locations, Blipstar
Latest Study on Industrial Growth of Store Locator Software Market 2023-2028. A detailed study accumulated to offer Latest insights about acute features of the Store Locator Software market. The report contains different market predictions related to revenue size, production, CAGR, Consumption, gross margin, price, and other substantial factors. While emphasizing the key driving and restraining forces for this market, the report also offers a complete study of the future trends and developments of the market. It also examines the role of the leading market players involved in the industry including their corporate overview, financial summary and SWOT analysis.
Get Free Exclusive PDF Sample Copy of This Research @ https://www.advancemarketanalytics.com/sample-report/22674-global-store-locator-software-market-1?utm_source=OpenPR&utm_medium=Vinay
Major players profiled in the study are:
Leadformance (France), Bold Commerce (United States), Bullseye Locations (United States), MetaLocator (United States), Blipstar (United Kingdom), IQServices.com (United States), Ayrea (United States), Moz, Inc. (United States), Vendasta (United States), Mapbox (United States),
Scope of the Report of Store Locator Software
The global Store Locator Software is expected to witness high demand in the forecasted period due to attractive market and promotional strategies. The store locator software allows customers to geolocate their location or manually search for the nearest location. Add filters, such as product or service categories, to allow customers to find the best location that will suit their needs. Configure the results based on settings including radius and store type.
The Global Store Locator Software Market segments and Market Data Break Down are illuminated below:
by Deployment Mode (Cloud-based, On-premises), Enterprise Size (Small and Medium Enterprises (SMEs), Large Enterprises), Platform (Mobile, Tablet, Desktop), Features (Simplify location searching, Be discoverable on all channels, Track user behavior, Others)
Market Opportunities:
The Rising Demand due to Cloud Solutions
Technological Advancement associated with Class Registration Software
Market Drivers:
The Growing Number of Reatilers across the Globe
Increasing Popularity From the Developing Countries
Market Trend:
Increasing Penetration of Internet and Smartphones
The Growing Demand due to the Avalibility of Customize Solutions
What can be explored with the Store Locator Software Market Study?
Gain Market Understanding
Identify Growth Opportunities
Analyze and Measure the Global Store Locator Software Market by Identifying Investment across various Industry Verticals
Understand the Trends that will drive Future Changes in Store Locator Software
Understand the Competitive Scenarios
Track Right Markets
Identify the Right Verticals
Region Included are: North America, Europe, Asia Pacific, Oceania, South America, Middle East & Africa
Country Level Break-Up: United States, Canada, Mexico, Brazil, Argentina, Colombia, Chile, South Africa, Nigeria, Tunisia, Morocco, Germany, United Kingdom (UK), the Netherlands, Spain, Italy, Belgium, Austria, Turkey, Russia, France, Poland, Israel, United Arab Emirates, Qatar, Saudi Arabia, China, Japan, Taiwan, South Korea, Singapore, India, Australia and New Zealand etc.
Have Any Questions Regarding Global Store Locator Software Market Report, Ask Our Experts@ https://www.advancemarketanalytics.com/enquiry-before-buy/22674-global-store-locator-software-market-1?utm_source=OpenPR&utm_medium=Vinay
Table of Contents
Global Store Locator Software Market Research Report
Chapter 1 Global Store Locator Software Market Overview
Chapter 2 Global Economic Impact on Industry
Chapter 3 Global Market Competition by Manufacturers
Chapter 4 Global Productions, Revenue (Value) by Region
Chapter 5 Global Supplies (Production), Consumption, Export, Import by Regions
Chapter 6 Global Productions, Revenue (Value), Price Trend by Type
Chapter 7 Global Market Analysis by Application
Chapter 8 Manufacturing Cost Analysis
Chapter 9 Industrial Chain, Sourcing Strategy and Downstream Buyers
Chapter 10 Marketing Strategy Analysis, Distributors/Traders
Chapter 11 Market Effect Factors Analysis
Chapter 12 Global Store Locator Software Market Forecast
Finally, Store Locator Software Market is a valuable source of guidance for individuals and companies.
Read Detailed Index of full Research Study at @ https://www.advancemarketanalytics.com/buy-now?format=1&report=22674?utm_source=OpenPR&utm_medium=Vinay
Thanks for reading this article; you can also get individual chapter wise section or region wise report version like North America, Middle East, Africa, Europe or LATAM, Southeast Asia.
About Author:
Advance Market Analytics is Global leaders of Market Research Industry provides the quantified B2B research to Fortune 500 companies on high growth emerging opportunities which will impact more than 80% of worldwide companies' revenues.
Our Analyst is tracking high growth study with detailed statistical and in-depth analysis of market trends & dynamics that provide a complete overview of the industry. We follow an extensive research methodology coupled with critical insights related industry factors and market forces to generate the best value for our clients. We Provides reliable primary and secondary data sources, our analysts and consultants derive informative and usable data suited for our clients business needs. The research study enables clients to meet varied market objectives a from global footprint expansion to supply chain optimization and from competitor profiling to M&As.
Contact Us:
Craig Francis (PR & Marketing Manager)
AMA Research & Media LLP
Unit No. 429, Parsonage Road Edison, NJ
New Jersey USA – 08837
0 notes
Text
Six smart steps to configure Mapbox with ReactJS
Mapbox provides custom maps, search and navigation. It supports many platforms. The tool is powered by programmers as well as millions of devices providing Location Data. It provides developers a platform and a toolset to build customized applications where location-based data can be used to meet a variety of business requirements.
A typical scenario where Mapbox is used:
A service provider uses Mapbox to track locations of their assets or employees in order to provide real-time information to customers or for operational monitoring. This could be a restaurant delivery service, an international transport company or even a fleet operator in a city.
Customizing Mapbox
One of our clients provides data services to monitor the health of agricultural farms. They wished to offer compelling data visualization of agricultural farm images along with other details. We customized mapbox to render this information on the web and mobile devices. There are SDKs available for the Web, iOS and Android.
In this article, we share how we configured mapbox in React JS using custom style to add new fonts, custom icons and publish these styles.
Following are the steps to configure mapbox in React JS using custom style to add new fonts, custom icons and publish these styles –
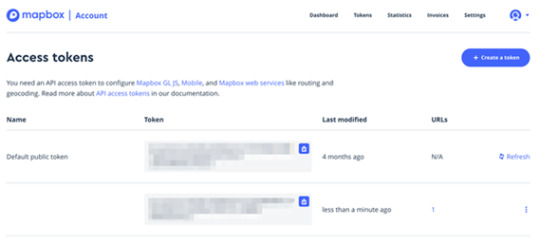
1. Steps to generate the token number and style in Mapbox
a. Create an account on https://account.mapbox.com
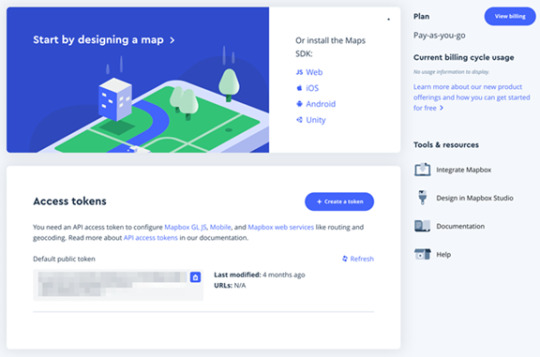
b. Log in to your account
c. On the Dashboard look for the Default public token. This Token number can be used for configuration in the Web App. You need to remember that this token number is public and easily accessible from the developer tab.
d. To get the private Token click on the button 'Create a Token' you will get a form. Enter the 'Token name' and select the desired 'Public Scope' and the 'Secret Scopes’.
e. Note: - This token will only be accessible from the specific URLs that we add while generating the Token.
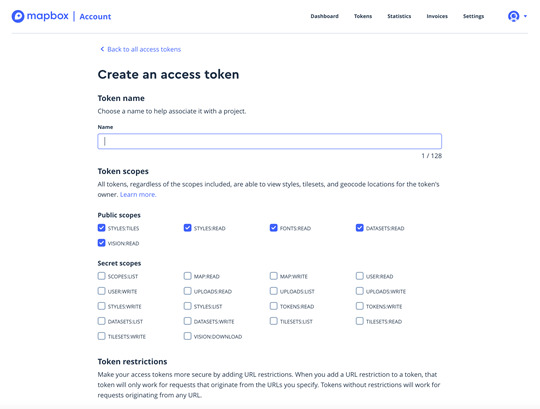
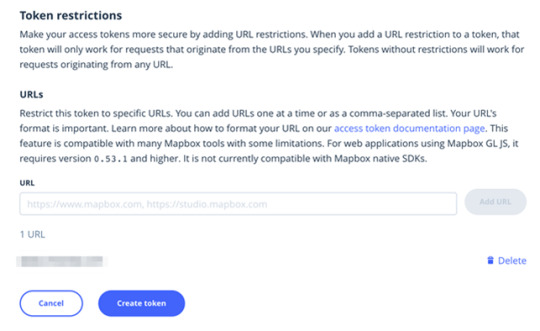
f. Now add the list of comma-separated URLs into the URL field and click on the 'Create Token’. Next you will be asked to confirm with your account password.
g. You will find the private token at the bottom of the Token list.
2. Steps to configure React JS app with Mapbox
a. There are two different methods available for using the Mapbox on the web App.We describe the steps using the 'npm' module bundler for installing Mapbox GL JS.
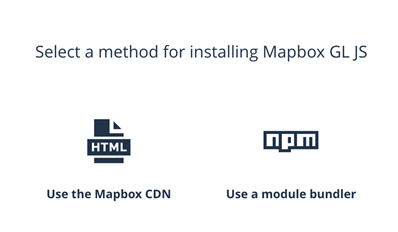
b. Install the 'npm' package --> 'npm install mapbox-gl --save'
c. Include the GL JS CSS file
d. Include the CSS file in the <head> of your HTML file
i. <link href='https://api.mapbox.com/mapbox-gl-js/v1.3.1/mapbox-gl.css' rel='stylesheet' />
e. Add the map to your Web App.
i. var mapboxgl = require(‘mapbox-gl/dist/mapbox-gl.js');
ii. mapboxgl.accessToken = 'Your Token number’;
iii. var map = new mapboxgl.Map({
iv. container: 'YOUR_CONTAINER_ELEMENT_ID',
v. style: 'mapbox://styles/mapbox/streets-v11' // Default style link
vi. });
f. Now you are done with the configuration.
3. Steps to create the custom style of Mapbox
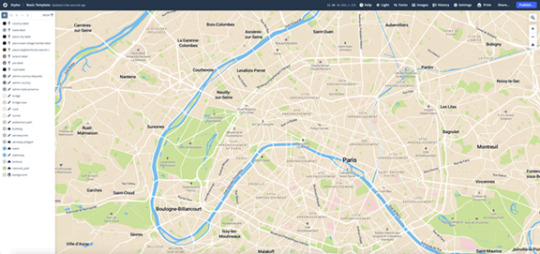
a. To create our custom style for the map, we need to open the Mapbox Studio,
b. To open the Mapbox studio, you can to go to the Dashboard and then click on the 'Design in Mapbox Studio' on the right side of the Dashboard or Just click on the link here https://studio.mapbox.com/
c. After opening the Mapbox studio, you can see the predefined styles you can use directly or you may choose to create a new style.
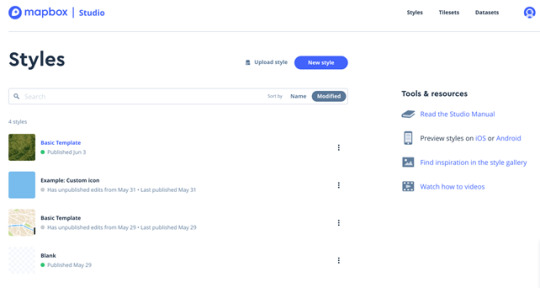
d. To create a new style, click on the 'New style' button on top of the page.
e. Select the desired template from the list and can change the style of the map from bottom of the dialog and then click on the customize button.
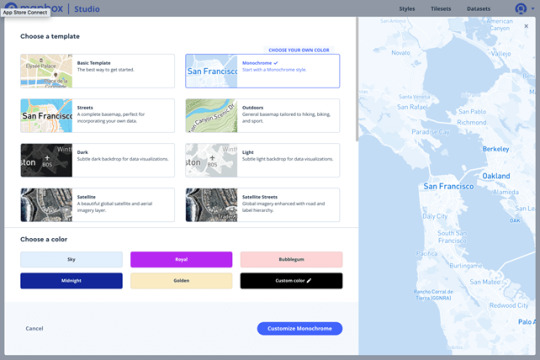
f. You can see a dashboard with different settings.
g. You can update the style of the country label, background, road, buildings and many more

4. Steps to add a new font to the map and then publish for production
a. Click on the Fonts tab on the top-right corner then you can find a dialog to upload the new fonts.
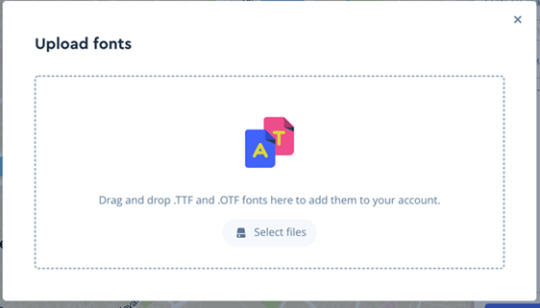
b. Clicking on the Upload new font, you can see a new dialog with the title 'Upload fonts' here you can drag new fonts with extension '.TTF' and ‘.OTF’.
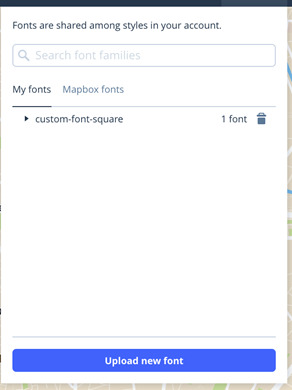
c. Once Font family is added, it can be then used in the map.

5. Steps to add a custom icon or an image and publish
a. The image we upload here will be available as an icon on the map for example Image as a custom marker.
b. Click on the 'Images' tab in the header you can see a dialog to upload the SVG image.
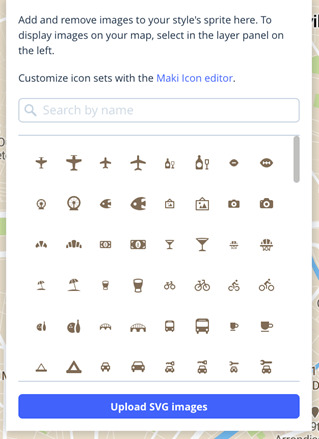
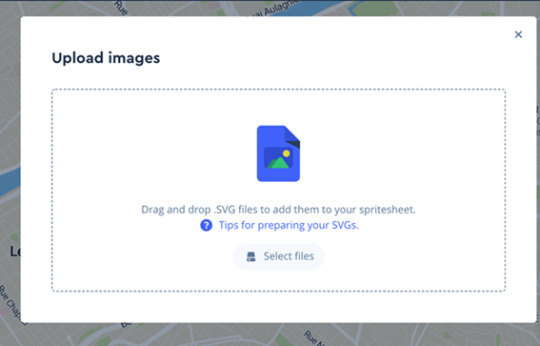
c. To upload the SVG image, click on the 'Upload SVG Icon' button, now you can see a new dialog where you can drag your SVG image.
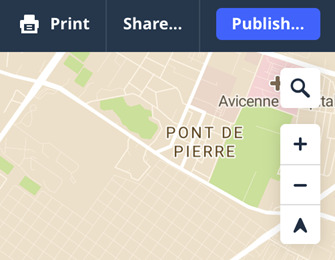
d. Once you update any style, you have to publish the style to see the changes on the map.
e. Note: - It may take some time to get published and to reflect on the map.
f. It is very easy to publish the changes; you just have to click on the 'Publish' button on the top-right corner of the map box studio.
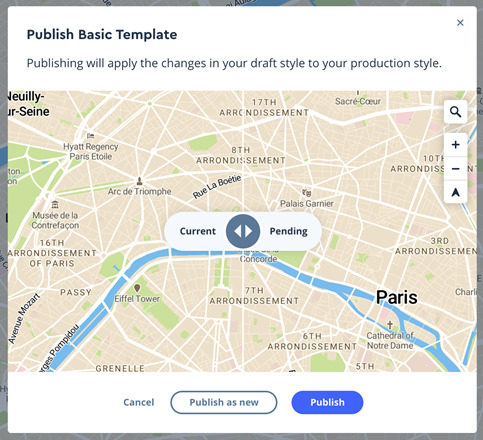
g. Now you can see a dialog with a slider where you can see the styles you added.
h. Here you can either ‘Publish as new’ which will replace all the styles, or, use the ‘Publish’ button to add the styles you added in your draft.
6. Steps to add the updated style to our map
a. Once the style is published,click on the 'Share' tab on the top-right corner of the Mapbox Studio. Here you can see a dialog where you can find your 'Your style Url' and 'Your access token’.
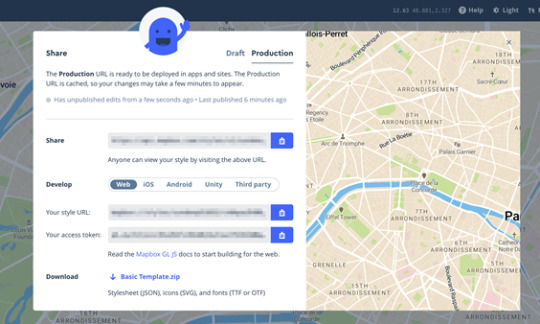
b. Now update your style URL of the map.
i. var map = new mapboxgl.Map({
ii. style: 'Add your style URL Here'
iii. });
c. Example:
i. const feature: feature<FeatureGeometry> = {
ii. id: 123,
iii. type: 'Feature',
iv. geometry: feature.geometry,
v. properties: {
1. meta: feature.meta,
2. icon: 'square-stroke'
3. // Custom Icon name which is added to the style in Mapbox Studio
vi. }
vii. }
For more information on our React projects please visit https://www.metasyssoftware.com/case-study-react
#Configuring Mapbox#mapbox#react#react native#reactjs#custommap#customizing Mapbox#mapbox studio#react customapp#react developers#reactjs app#reactjs example#reactjs web development company
0 notes
Text
Best Classified WordPress Theme in usa!

Classifieds has over 16 pre-defined homepage layouts for you to choose from for your WordPress classifieds website.
Now on version new, the latest Classifieds announcement gives you a completely new set of website choices to work with. Once you’ve browsed the various site demos, you can introduce your favourite design in just some clicks. With so several different choices available, regardless of what kind of listings and classifieds website you’re building, you should be able to find a proper design here. This is the Best Classified WordPress Theme in use.
Next, you’ve imported the demo content; the next step is to configure how your Classifieds website will work. Appreciations to the Classifieds settings and choices, you should be able to define precisely how your site and its adverts and listings are designed. Whether you need to let your guests bid on your promotion slots, support multiple currencies, or use the messaging method, it’s entirely up to you with Classifieds.
Through the WooCommerce combination, you can also fix up your site to receive payments directly from users. Other useful points you can make use of with this theme combine the radius research tool, which assists your visitors to find the listings closest to them. You also have the choice of enabling social logins to make it lightly for your visitors to sign up using their Facebook and Google accounts.
If you are watching for a feature-rich classifieds WordPress theme with lots of various designs to pick from, be sure to hold out Best Classified WordPress Theme in use.
If you're wondering how the classified functionality of Classifieds is delivered, this theme includes the Best plugin and the Options. Among these tools to hand, you should hold everything you require to launch your new classified Website.
Buy Here: https://designinvento.net/classified-wordpress-theme/
Best Option :
Country Based Restriction
Multi Directory
Woocomerce Payment
Advanced Search
Custom Search Filters
Ajax Search
Directory-Based Search
Location Search
Radius Search
Google Map Integration
MapBox Integration
Listing On Map
Custom Map Markers
Unlimited Map Styles
Country Based Restriction
Address Auto-Complete
Location Icons
Category Icons
Unlimited Pricing Plans
Sticky Ads
Featured Ads
Raise up/bump up Ads
Upgrade listing
Set expiry for each plan
Map setting for each plan
And Many more other option !!!
#best #classified #WordPress #theme #in #usa
Information: https://designinvento.net/classified-wordpress-theme/
1 note
·
View note
Text
An Overview of New-age Location-based Apps and their Development Procedure!

Location-Based Services (LBS) are one of the most trending services nowadays. These services are utilized in countless applications like on-demand apps, travel and transportation-related apps, banking apps, social media apps, event planning apps, etc. to name a few. From Instagram to Uber, from Runtastic to Tinder, these apps have impacted millions of peoples’ lives positively. They have eased out several tasks of day-to-day life and made the customer experiences more comfortable.
Here are some top predictions about the location-based services and their applications.
· The LBS market is expected to cross $39.2 Billion by the year 2025, as projected by MarketsandMarkets!
· Another report by Fortune Business Insights forecasts that by 2026, the LBS market size will cross $66.61 Billion.
It is evident from these stunning reports that the LBS and the location-based apps are high in demand. These are being leveraged by several entrepreneurs, start-ups, and business enterprises across the globe at a fast pace.
Top Functions of the Location-Based Tracking Apps
· Communication: Businesses can register their address or any related places on maps. People can add reviews, leave feedback, and also refer to these reviews. Businesses can even link certain content on the map.
· Marketing: Geo-location technologies are used in incentive marketing campaigns for creating interaction mechanics with end-users.
· Information: Customers can get real-time information about the location of a person, place or a bus/train, etc.
Major Types of Location-Based Apps using Geolocation Technologies
On-demand Apps like Uber, Zomato, etc.
Social Networking Apps Facebook, WhatsApp, etc.
Location Tracking Apps like Google Maps, Waze, etc.
Dating Apps like OkCupid, Tinder, etc.
eCommerce Apps like Amazon, eBay, etc.
Travel and Tourism Apps like TripAdvisor, Expedia, Booking, etc.
Health and Fitness Apps like MyFitnessPal, Nike Running Club, etc.
Photo Location Finder Apps like Explorest, Google Photos, etc.
Weather Apps like Weather by Apple, Yahoo Weather, etc.
Some of the examples of the location-based apps developed by us are as below:
1. MastR: This is an eCommerce app that enables customers to do virtual shopping. The product categories displayed are based on the location of the product. It also enables scheduled pickups and deliveries.
2. BeachCaddy: This app enables end users to request assistance from beach caddies to help them carry beach items. Travel of caddies is tracked through the application.
3. Otego: It is restaurant management and a food delivery app. Orders placed by the customers can be tracked on the map.
After looking at these live examples of location-based applications, we are now going to discuss the mobile app development process used for creating apps using geo-location technologies. So let’s commence.
How to Create a New-age Location-based App?

Step 1: Thorough Market Research and Finding a Reliable Tech Partner
You should first decide which type of location-based app you want to build by studying its scope in the market. Market research is mandatory to get the answers to questions like-
What is my target audience?
How my app idea will benefit them?
Who are my competitors?
What innovation can I offer to my target audience?
Should I develop an MVP or a full-fledged mobile app?
How to go about the location-based app development process?
Which are the top mobile app development companies and whom can I partner with?
Step 2: Deciding the Apt Geolocation Features
It is essential to integrate some core geolocation features and functionalities in your app to make it highly beneficial to the users. These functionalities include Map view, GPS coordinates, user location detection, location history, route mapping, location-based notifications, etc.
Step 3: Selecting the Right Technology Stack
Selecting the right tech stack for geolocation app development is a necessity. Find below the list of a few set of tools required for location-based apps to choose from:
Web:
HTML5 geolocation API
iOS:
Google Places API
Google Maps API
Google Maps SDK
Core Location API
Apple MapKit
Android:
android.location package
Google Maps API
Mapbox
Google Location Services API
Google Maps Directions API
Google Distance Matrix API
Yandex Maps
MapView class
Open Street Map
Step 4: Wire-framing, Designing the UI, and Developing the App
The next step is creating several visual prototypes of the app that match your app idea/concept. After wire-framing, design a user-friendly and responsive app UI. Now begin with the development of a feature-rich location-based application. Pay attention to detail, and get your app developed by an experienced team.
Step 5: Applying Safety and Security Measures
Ensuring data safety is of paramount importance, especially because location-based apps carry sensitive data. So, consider all the existing legal regulations of different countries you are going to target and strictly adhere to their safety regulations.
Follow the below-given practices too for making your app secure:
Using multi-factor authentication
Using an SSL certificate
Encrypting communications
Using App Transport Security for iOS or Network Security Configuration for Android
Not storing high-importance data on user devices
Encrypting sensitive information with algorithms like RSA or AES-256
Step 6: Final Testing of Complete App
The last step is to carry out rigorous testing of the app. Make sure that the app meets all the code requirements. Test-driven development (TDD) is another effective approach. These will help you reduce the potential bugs, and enhance the app quality.
Final Thoughts
Needless to say, location-based apps are enjoying extreme popularity across diverse industries. Owing to their vast benefits, almost every mobile app development company in the market is utilizing this functionality in some of their apps.
So, do you have a great idea for developing a location-based application? Or do you want to enhance your existing app with this amazing functionality? Reach out to the world-class location-based app development company in Texas, USA, for further assistance.
To know more about our core technologies, refer to links below:
https://www.biz4solutions.com/angularjs-development-company/
https://www.biz4solutions.com/react-native-app-development-company/
https://www.biz4solutions.com/ror-app-development-services/
0 notes
Text
Lattice Semiconductor Launches New FPGA For Cyber-Resilient Systems
New Post has been published on https://perfectirishgifts.com/lattice-semiconductor-launches-new-fpga-for-cyber-resilient-systems/
Lattice Semiconductor Launches New FPGA For Cyber-Resilient Systems
Earlier this week, Lattice Semiconductor announced its newest product built on the Lattice Nexus FPGA platform, the Mach-NX. The Mach-NX FPGA product family addresses the growing threat of firmware hacking attempts on systems, leading to the loss of customer IP. Moor Insights & Strategy have written a lot about this growing threat, funded by nation-states with “as a service” business models.
As bad actors continue to attack firmware, companies like Lattice Semiconductor need to constantly be upping its games to enable their customers to create cyber-resilient systems. Enter a new FPGA from Lattice. The Mach-NX is a high performance, low power FPGA product family aimed at dynamic, real-time, and end-to-end platform protection. This launch is the next logical step for Lattice on its low power FPGA journey and marks the third Nexus launch in a year. The company is uniquely positioning itself as a leader, if not the leader in low power FPGA security solutions, and this launch helps reinforce that.
Lattice has been delivering new security-focused FPGAs at a faster cadence than we are used to. Since FPGAs are incredibly flexible, it also gives Lattice the ability to expand its presence into different markets that need programmable security solutions. In recent memory, Lattice launched CrossLink-NX in late 2019, Certus-NX this past summer, and now Mach-NX. You can read my full write up on the Certus-NX launch here. Lattice was ambitious when it promised to speed up its launch cadence by 3x, and it has done just that in 2020. The company seems hyper focused on low power FPGA dominance as 2020 comes to an end, and its future seems bright.
Lattice Semiconductor Mach NX
As hackers continue to attack firmware vulnerabilities with nation-state budgets and “as a service” models, companies need a flexible, secure solution that can adapt and serve different industries and applications. That problem is the exact reason that Lattice developed its new security-focused FPGA, Mach-NX. The new Mach-NX FPGA family will build on the previous product, the Lattice MachXO3D family. The new Mach-NX product family will address future server platforms, computing, communications, industrial, and automotive systems. Like other Lattice Nexus products, the new Mach-NX FPGA will utilize the same 28 nm FD-SOI fab process. While not a bleeding edge geometry, the specialized FD-SOI process technology allows Lattice to deliver extremely energy-efficient solutions without sacrificing performance. I also believe this solution is much smaller than competing solutions. High performance while maintaining low power matters a lot when you consider that traditionally high-density FPGAs trade power for size. I’ve talked enough about application and product introduction; let’s get into the nuts and bolts of the Mach-NX.
I listed the new features verbatim for the Mach-NX FPGA products from Lattice’s announcement.
Up to 8.4K LC of user logic, 2669kbits of user flash memory, and dual boot flash feature.
Up to 379 programmable I/O supporting 1.2/1.5/1.8/2.5/3.3 I/O voltages.
Secure enclave supports 384-bit cryptography, including SHA, HMAC, and ECC.
Lattice Semiconductor Mach-NX
The first goal of a security solution is establishing a Hardware Root of Trust upon boot, which the Mach-NX does. The Mach-NX FPGAs also give users real-time performance against security risks with real-time SPI monitoring. According to Lattice, the Mach-NX FPGAs can again recover firmware within microseconds, where other FPGAs can take 100s of milliseconds or even minutes to recover firmware.
The 384-bit encryption is a significant security upgrade from the 256-bit encryption we saw with the last generation products. This security level becomes essential, especially when considering the longevity of end products that would adopt the Mach-NX, which could be up to 10 years. As the number of attack vectors and cyber-attacks is increasing rapidly, security solutions need to adapt and become harder to hack. Another value that customers get from implementing Mach-NX FPGAs is customizing solutions specifically for their applications and use. Customers will be able to configure their FPGAs’ security using RISC-V and Lattice’s Propel Design Environment. I admire the way Lattice is positioning its Mach-NX solution as a first on, last-off, real-time, fully customizable solution for the customer’s unique needs. When you pair these solutions with Lattice’s security service, SupplyGuard, a customer’s system can be protected throughout the product life cycle’s duration.
Lattice Semiconductor Mach-NX
Wrapping up
All in all, Lattice’s new Mach-NX looks to deliver on its core value proposition and extends the capabilities of Lattice’s previous generation of secure control FPGAs. Attack vectors and hackers will continually evolve their attack methods, and as those change, I believe s Lattice’s solutions will volve to address those methods.
Since this time last year, Lattice has launched three FPGA product families built on its Lattice Nexus FPGA platform with no signs of slowing down. If you recall, since CEO Jim Anderson took the helm Lattice looks to have generated a tremendous amount of momentum with Lattice Nexus, as further reinforced by the launch of Mach-NX. Add to that the work the company has put in to round out its offerings with application-focused solutions stacks and software design tools, and it’s clear they are laser-focused on delivering on the promise of low power programmable leadership.
Note: Moor Insights & Strategy writers and editors may have contributed to this article.
Moor Insights & Strategy, like all research and analyst firms, provides or has provided paid research, analysis, advising, or consulting to many high-tech companies in the industry, including 8×8, Advanced Micro Devices, Amazon, Applied Micro, ARM, Aruba Networks, AT&T, AWS, A-10 Strategies, Bitfusion, Blaize, Box, Broadcom, Calix, Cisco Systems, Clear Software, Cloudera, Clumio, Cognitive Systems, CompuCom, Dell, Dell EMC, Dell Technologies, Diablo Technologies, Digital Optics, Dreamchain, Echelon, Ericsson, Extreme Networks, Flex, Foxconn, Frame (now VMware), Fujitsu, Gen Z Consortium, Glue Networks, GlobalFoundries, Google (Nest-Revolve), Google Cloud, HP Inc., Hewlett Packard Enterprise, Honeywell, Huawei Technologies, IBM, Ion VR, Inseego, Infosys, Intel, Interdigital, Jabil Circuit, Konica Minolta, Lattice Semiconductor, Lenovo, Linux Foundation, MapBox, Marvell, Mavenir, Marseille Inc, Mayfair Equity, Meraki (Cisco), Mesophere, Microsoft, Mojo Networks, National Instruments, NetApp, Nightwatch, NOKIA (Alcatel-Lucent), Nortek, Novumind, NVIDIA, Nuvia, ON Semiconductor, ONUG, OpenStack Foundation, Oracle, Poly, Panasas, Peraso, Pexip, Pixelworks, Plume Design, Poly, Portworx, Pure Storage, Qualcomm, Rackspace, Rambus, Rayvolt E-Bikes, Red Hat, Residio, Samsung Electronics, SAP, SAS, Scale Computing, Schneider Electric, Silver Peak, SONY, Springpath, Spirent, Splunk, Sprint, Stratus Technologies, Symantec, Synaptics, Syniverse, Synopsys, Tanium, TE Connectivity, TensTorrent, Tobii Technology, T-Mobile, Twitter, Unity Technologies, UiPath, Verizon Communications, Vidyo, VMware, Wave Computing, Wellsmith, Xilinx, Zebra, Zededa, and Zoho which may be cited in blogs and research.
From Cloud in Perfectirishgifts
0 notes
Text
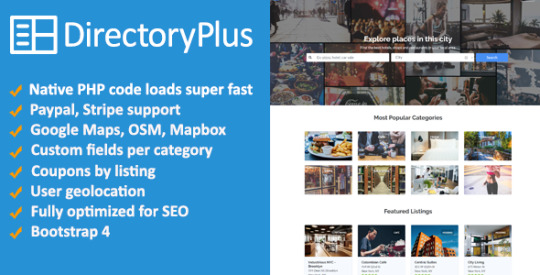
Directory Plus
New Post has been published on https://intramate.com/php-scripts/directory-plus/
Directory Plus
LIVE PREVIEWGet it now for only $45
DirectoryPlus is an all-in-one solution for creating a Business Directory website. DirectoryPlus is a standalone PHP script that doesn’t require other platforms to function and allows you to create a directory website with only a few clicks. It also works well as a Store Locator script.
Directory Features Overview
All native PHP code with a simple structural framework, any person with even a basic PHP knowledge is able to quickly understand what’s going on and make modifications
Extremely fast page load times (< 500ms average)
Can handle hundreds of thousands of listings with speed
Works fine on cheap shared hosts even with thousands of listings
Super easy install, get up and running in 5 minutes
Possible to define your permalink structure
Templating system based on Bootstrap 4
Configurable billing plans (free, paid, one time payment, monthly, annual, featured listing)
Google Maps, Mapbox, OpenStreetMap, HERE, CartoDB, Stamen, TomTom, Wikimedia Maps compatible
Geolocation support (HTML 5 API)
Embed video (Youtube, Vimeo)
Coupons: business owners can create coupons to show on their listing pages
Payment Gateways: Paypal, Stripe, subscription possible
Sitemaps XML generation and automated submission
Custom fields (category based or global custom fields)
Search by custom field (range select, range input, text, number, drop down, checkbox, radio input)
Easy to update (usually 1 min to update the script when a new version is out)
Claim listings so you can populate your site with listings then let business owners claim and pay for the listing
Contact owner form for each listing
Whatsapp click to chat integration
Create static pages and blog posts using TinyMCE
Rating system
Child theme support – Don’t lose your customizations when updating
User reviews and comments
Login with Facebook, Twitter and email account
Multiple currencies support
Responsive design looks good on mobile and desktop
SEO optmized, friendly URLs, user-defined meta descriptions
Translations files in plain text format (editable in notepad or similar) including the admin area, very easy to translate
Intuitive and simplified files and folders structure, no complicated nested folders makes it easy to edit
Built-in contact page (contact site owner) with form to email
Multi-language support
GDPR compliance tools
Maintenance mode (503 HTTP headers)
Translated to ES, PT, DE, FR (including admin area)
Fast support
Setup in less than five minutes
DirectoryPlus comes with a one click installer that will get you up and running in no time. Just upload the files, edit the config file and hit the install page and click “Install”.
Bootstrap based design
DirectoryPlus uses Bootstrap 4’s layout grid, components and utilities extensively and it has a very neutral theme that can easily adapt to several business types. This also makes it easy for third party designers to make layout modifications because they only need to be familiar with the Bootstrap framework.
Custom Fields
DirectoryPlus allows you to create “Custom Fields” on the category level or create global custom fields. For example, you can create a “Delivery (yes/no)” field and it shows up only for listings in the “Food” category. Or you can create a “Free Wi-fi” field to let users search for listings that offer free wi-fi. Custom fields can be required/optional and also searchable.

Monetize Your Directory
Flexible pricing plans allows you to create one time payments as well as monthly and annual recurring subscriptions. Current payment gateways supported are:
Paypal
Stripe
Claim Listings
With this feature you can kickstart your directory by creating listings and let business owners claim and pay for the listings so that they can edit, correct and add additional information.
Speed is a Feature. Fast Loading Times
According to Google engineers, pages must load within 1000ms.
This means that the users’ browsing experience deteriorate and switch mental context if the pages don’t completely load in much less than 1000ms (1 second).
Directory Plus has been designed with page loading speed as a feature. All pages load fast and takes about 400ms to 800ms to load completely.
You can test Page Load Times on Pingdom: https://tools.pingdom.com/
Please note that the only important metric is the Load Time in miliseconds.
Create Pages
DirectoryPlus comes with a CMS system that allows you to create blog posts and pages and uses the popular TinyMCE wysiwyg editor. You can define whether to show a post in the feed, if not, it will be a stand alone page.
Map Providers
DirectoryPlus supports multiple map providers: Mapbox, HERE, TomTom, Wikimedia, OpenStreetMap and Google Maps. You can choose one or multiple ones. If you select multiple map providers DirectoryPlus will randomly select one on every page load. Useful if you want to take advantage of the free usage quotas of multiple map providers.
Coupons
Allow business owners to create coupons for deals and discounts. Users can browse all coupons available on the site.
Business Logos
Each business can upload its own logo to show up as their main image on the directory. Logos will show in the results pages (search, categories, cities, etc) and on the business page as the main image next to the business name.
Fully Brandable
DirectoryPlus is a standalone PHP script that doesn’t require any other CMS platform. If you are building a directory for your client, it will not show that you are using another platform such as WordPress.
Use Cases
You can use DirectoryPlus to build niche directories, here are some examples:
Restaurants and bars directory
Health care directory
Automotive listings (dealers, repair, parts and supplies, tires, etc)
Church listings
Local area directory
Night life directory
Pets directory
and much more
But if you are looking for a classified ad, also check out my other script: Classifieds Plus
Demo
Login here Username: [email protected] Password: 1234
User Guide
Please access the user guide at: http://x-php.pro/docs/DirectoryPlus/
Requirements
PHP 5.5+ or Newer
MySQL 5.6.*+ (Requires FULLTEXT search in InnoDB)
Fully functional demo
You can see a fully functional demo, where you are able to register an account, confirm it, sign in, see the user area and even submit listings.
https://x-php.pro/demo/directoryplus
Tags
business directory, php directory, store locator script, business listings, directory theme, geolocation directory, listings template HTML, restaurant reviews, yellow pages, yelp, clone, google places
LIVE PREVIEWGet it now for only $45
0 notes
Text
Houzez - Real Estate WordPress Theme
New Post has been published on https://babesgobananas.com/houzez-real-estate-wordpress-theme/
Houzez - Real Estate WordPress Theme

Welcome to Houzez! The worldwide popular WordPress theme for real estate agents and companies. Houzez is a super flexible starting point for professional designers to create top-notch designs. It has features that your client – a real estate agent or company – might not even have dreamt about.
Translated in 20 Languages Arabic, Chinese (simplified), Dutch, French, German, Hebrew, Hindi, Indonesian, Italian, Japanese, Korean, Polish, Portuguese, Russian, Spanish, Thai, Turkish, Ukrainian, Urdu, Vietnamese.
Check OpenStreetMap and Mapbox demo: https://houzez02.favethemes.com/listing-with-google-map/


General Features
Easy to Get Started Do you like the demo? Import the provided sample content in a few clicks and start editing it right away.
Fully Responsive We have tested our code on a multitude of phones and tablets to ensure smooth user experience on all platforms
Retina Ready All of the graphics in our theme are of high resolution to ensure that your website looks crisp on modern displays
Visual Composer Not experienced in web design? Get instant visual feedback by dragging and dropping elements to build pages
Revolution Slider This slider plugin allows you to build advanced layered sliders with a myriad of options for style and effects
Contact Forms Create advanced contact forms and implement them on any page you like with MailChimp and Contact Form 7
Powerful Admin Panel Provide your agents and clients with an easy way to manage their profile, properties for sale and other settings
Parallax Backgrounds Appeal to the trendier segment of your market by using visually-impressive parallax backgrounds on your site
Video Backgrounds Impress your audience even further by placing stunning videos as your header backgrounds. Houzez makes it easy
Header Options Grab your visitors’ attention with an attractive header. Choose between a slider, video, image or Google maps
Unlimited Templates Nothing is set in stone: you can structure your pages exactly how you want without having to write any code
Blog Layouts Choose between Default or Masonry blog layouts and make your blog pages beautiful and functional
Google Map Give your visitors an option to browse through properties with a map, so they can search within places they like
Custom Colors Choose from one of our predefined color schemes or set up a custom one to maintain a unique brand identity
Custom Modules Choose from a number of pre-designed Visual Composer modules and lay out your pages in mere minutes
Multiple Sidbars Create and configure as many sidebars as you like and display the right sidebar(s) on the right page
Typography Options Choose from any of the Google fonts and style your type to match your brand identity without compromise
WPML Support Our theme fully supports the WPML plugin in case you want to display your content in multiple languages
Google Geolocation Now you have the ability to see the geographic location of your website’s visitors
Radius Search Search properties by their proximity to you in kilometers or miles on all search pages
Geo Autocomplete Options Control the autocomplete for geo locations by optionally drop-down results to a specific country
Similar Properties Keep visitors on your site by showing properties similar to the one they’re viewing
User Roles Control the capabilities of each individual user by choosing from the Buyer and Agent roles
Real Estate Agencies Display real estate companies profiles on your site by using a dedicated custom post type
Nearby Places Make property information more complete by showing what’s around them powered by Yelp
Property Features
Choice of Listing Templates Choose from 8 different listing templates and lay them out as lists or grids, full-width, video or parallax
Property Templates Choose between 3 listing layouts that let your visitors assess your offers and easily get in touch with your agent
Agent Details Template Provide your sales agents with attractive profile pages where they can display their contact info and listings
Property Settings Create property listings with all the features you’d expect: area size, price range, amenities and more
Advanced Search Help your visitors find the right property by letting them set various search criteria such as size and price range
Powerful Filters Our advanced filters allow your clients to fine-tune their search results and focus on the details that matter the most
Houzez Lightbox Make it easy for your visitors to contact your agent and view property photos with our custom lightbox
Property PDF Allow your visitors to print paper-friendly versions of property pages so they can refer to them later offline
Floor Plans Use the theme’s built-in functionality to display floor plans and give your visitors a complete picture of your properties
Agent Contact Forms Help your agents make more sales by placing an easy-to-use contact form in the header of each listing
Favorite Properties Help your visitors stay organized by letting them favorite the properties they like or want to book a visit for
Attachments Include a downloadable brochure with your listings so that your visitors can print the information they need
Currency Switcher Allow your clients to switch to different currencies and get property prices converted in real time
Mortgage Calculator Quickly calculate mortgage payments for properties with our easy-to-use Mortgage Calculator widget
Property Stats Display the stats of your property page views by using one of the provided chart layouts
Agent’s Sticky Sidebar Glue your agents’ contact form to a fixed spot on the screen making it permanently visible while scrolling up and down
360° Virtual Tour Create interactive virtual tours and simulations for your properties and show off as much as possible before a real-life viewing
Print Properties Export your property detail pages in a well organized and easy to read PDF file that is ready to be printed or shared
Walkscore Provide your users with extensive walkability data within your property pages (powered by the Walkscore API)
Property Layout Manager Sort, enable and disable property page sections as you see fit with a simple drag-and-drop panel
Compare Properties Let your users compare different properties based on their features and parameters
Gallery Images Promote your properties with image galleries that are easy to create, nice to look at and a breeze to scroll through
Property Video Make your property pages even more informative by including a video that will work on all modern browsers
Social Sharing Add an extra kick to your marketing efforts by letting anyone share your properties on social media outlets
Membership Features
Membership System Offer your agents custom subscription levels by varying the number of featured and regular listings
Paid or Free Memberships Charge per listing submission, offer monthly packages or don’t charge anything at all – the choice is yours
Payment Gateways Integration Receive payments with PayPal, Stripe or bank transfer – the theme fully supports popular payment solutions.
PayPal Integration Connect to your PayPal account (with just a few clicks) and you are ready to receive money with no hassle
Stripe Integration Start accepting payments with Stripe and start processing credit and debit cards professionally
Front-end Property Submission Both you and your agents are able to login and submit property listings from the front of your website
Front-end Property Submission Both you and your agents are able to login and submit property listings from the front of your website
Invoices and Billing Issue invoices, bill your members, track all the necessary financial data and be at ease with bookkeeping
Email Alerts for Saved Searches Let your visitors configure their searches with a range of criteria and automatically notify them of new matches
Social Login Allow your members to use their social media accounts so they can subscribe and login to your website fast
Built-in Monetization System No need to install additional plugins to handle money. Send and receive payments straight out of the box
Your Own Marketplace Create a professional-grade realty marketplace and manage it from the backend of your website with ease
About IDX Systems
IDX integration mean theme work good with third party IDX plugins and will not crash or stop these plugins functionality if someone will use it. Furthermore, the use of an IDX system is optional and it is not necessary for the functioning of the theme.
About user interface: It’s impossible to have the same UI for IDX plugins as Houzez default because IDX plugins providers use an iframe which not allow changing any HMTL or CSS code, also impossible to overwrite their HTML to make same GUI like Houzez default.
About searches. Theme default searches never work with IDX nor it is possible because theme searched search data from the WordPress database, it is not possible to search and get data from third party IDX provider database.
Using an IDX system is not free and required a monthly subscription with an IDX provider.

Source
0 notes
Text
How to Make a Heatmap with Mapbox GL JS
Editor's Note: This article originally appeared on mapbox.com and is being republished with permission from the provider. Readers going through this tutorial are assumed to have some familiarity with front-end development concepts.
In this guide, you will learn how to make a heatmap using Mapbox GL JS. Heatmaps can be used to display large amounts of points in a way that is visually engaging and encourages your audience to explore your map.
Getting started
A Mapbox account and access token. Sign up for an account at mapbox.com/signup. You can find your access tokens on your Account page.
Mapbox GL JS. The Mapbox JavaScript API for building web maps.
Data. In this tutorial, you'll be using a geojson file of street trees in the city of Pittsburgh from the Western Pennsylvania Regional Data Center.
↓ Download GeoJSON
What is the purpose of a heatmap?
The term "heatmap" can refer to a few different kinds of cartographic visualizations. You may see it applied to presidential election maps, population density maps, or even meteorological maps.
Among maps you'll find on the web, there are two common categories of heatmaps: those that encourage the user to explore dense point data, and those that interpolate discrete values over a continuous surface, creating a smooth gradient between those points. The latter is less common and most frequently used in scientific publications or when a phenomenon is distributed over an area in a predictable way. For example, your town may only have a few weather stations, but your favorite weather app displays a smooth gradient of temperatures across the entire area of your town. For your local weather service, it is reasonable to assume that, if two adjacent stations report different temperatures, the temperature between them will transition gradually from one to the next.
For the purposes of this tutorial, we are referring to a different kind of visualization that is more useful for showing the density of points over an area. This type of heatmap does not visualize density by aggregating features within a set of boundaries in the way a choropleth map does, but instead displays a continuous gradient between points.
Heatmaps aren't only useful for visualizing point density, however. They can also help visualize relative differences between those points. You can assign each point a higher or lower importance based on the value of a particular property within the dataset. In this tutorial, you will weight your map by the dbh property in your data. dbh stands for "diameter at breast height" and is a standard way of measuring a tree's diameter at 4.5 feet above the ground. In general, it is safe to assume that a tree with a higher DBH is older and larger. When you give these larger trees a higher weight compared to smaller saplings, your visualization can be an effective approximation of the area that is shaded by trees' leaves.
Heatmap paint properties
To add a heatmap layer to your map, you will need to configure a few properties. Understanding what these properties mean is key to creating a heatmap that accurately represents your data and strikes the right balance between too much detail and being a single, generalized blob.
heatmap-weight: Measures how much each individual point contributes to the appearace of your heatmap. Heatmap layers have a weight of one by default, which means that all points are weighted equally. Increasing the heatmap-weight property to five has the same effect as placing five points in the same location. You can use a stop function to set the weight of your points based on a specified property.
heatmap-intensity: A multiplier on top of heatmap-weight that is primarily used as a convenient way to adjust the appearance of the heatmap based on zoom level.
heatmap-color: Defines the heatmap's color gradient, from miniumum value to maximum value. The color displayed is dependent on the heatmap-density value of each pixel (ranging from 0.0 to 1.0). The value of this property should be written as an expression that uses heatmap-density as the input. For inspiration on color choices for your heatmap, check out Color Brewer.
heatmap-radius: Sets the radius for each point in pixels. The bigger the radius, the smoother the heatmap and the less amount of detail.
heatmap-opacity: Controls the global opacity of the heatmap layer.
Create your map using Mapbox GL JS
Now that you understand the purpose of heatmaps and the paint properties you will be working with, it's time to set up your map. For this example, you will be using the Mapbox Dark template style. You can find the Style URLs for each of the template styles in our API documentation.
In your text editor, create a new index.html file, then copy and paste the below code into it. Make sure to replace <your-access-token> with an access token that is associated with your account. Once you add this code and save your index.html file, you can preview the file in your browser to make sure you see the map.
Note: Be sure to save and store the GeoJSON file in the same directory as your project. You will also need to run this application from a local web server, otherwise you will receive a Cross-origin Resource Sharing (CORS) error. Python's SimpleHTTPServer is included on many computers and is a good choice if this is your first time running a local server.
<!DOCTYPE html> <html> <head> <meta charset='utf-8' /> <title></title> <meta name='viewport' content='initial-scale=1,maximum-scale=1,user-scalable=no' /> <script src='https://api.tiles.mapbox.com/mapbox-gl-js/v0.50.0/mapbox-gl.js'></script> <link href='https://api.tiles.mapbox.com/mapbox-gl-js/v0.50.0/mapbox-gl.css' rel='stylesheet' /> <style> body { margin: 0; padding: 0; } #map { position: absolute; top: 0; bottom: 0; width: 100%; } </style> </head> <body> <div id='map'></div> <script> mapboxgl.accessToken = '<your-access-token>'; var map = new mapboxgl.Map({ container: 'map', style: 'mapbox://styles/mapbox/dark-v9', center: [-79.999732, 40.4374], zoom: 11 }); // we will add more code here in the next steps </script> </body> </html>
Add your data
You will first need to add the the geojson you downloaded at the beginning of this guide as the source for your heatmap. You can do this by using the addSource method. This source will be used to create not only a heatmap layer but also a circle layer. The heatmap layer will fade out while the circle layer fades in to show individual data points at higher zoom levels. Add the following code after the map you initialized in the previous step.
map.on('load', function() { map.addSource('trees', { type: 'geojson', data: './trees.geojson' }); // add heatmap layer here // add circle layer here });
Add the heatmap layer
Next, use the addLayer method to create a new layer for your heatmap. Once you've created this layer, you will make use of the heatmap properties discussed earlier to fine-tune your heatmap's appearance.
For heatmap-weight, specify a range that reflects your data (the dbh property ranges from 1-62 in the geojson source). Because larger trees have a high dbh, give them more weight in your heatmap by creating a stop function that increases heatmap-weight as dbh increases.
Since heatmap-intensity is a multiplier on top of heatmap-weight, heatmap-intensity can be increased as the map zooms in to preserve a similar appearance throughout the zoom range. The images below demonstrate the impact of heatmap-intensity on your map's appearance. The image on the left shows heatmap-intensity that increases with zoom level and the one on the right shows heatmap-intensity that uses the default of 1.


For heatmap-color, add an interpolate expression that defines a linear relationship between heatmap-density and heatmap-color using a set of input-output pairs. If you are interested in learning more about Mapbox GL JS Expressions, check out our Get Started with Mapbox GL JS expressions guide and relevant documentation.
Finish configuring your heatmap layer by setting values for heatmap-radius and heatmap-opacity. heatmap-radius should increase with zoom level to preserve the smoothness of the heatmap as the points become more dispersed. heatmap-opacity should be decreased from 1 to 0 in between zoom levels 14 and 15 to provide a smooth transition as your circle layer fades in to replace the heatmap layer. Add the following code within the 'load' event handler after the addSource method.
map.addLayer({ id: 'trees-heat', type: 'heatmap', source: 'trees', maxzoom: 15, paint: { // increase weight as diameter breast height increases 'heatmap-weight': { property: 'dbh', type: 'exponential', stops: [ [1, 0], [62, 1] ] }, // increase intensity as zoom level increases 'heatmap-intensity': { stops: [ [11, 1], [15, 3] ] }, // assign color values be applied to points depending on their density 'heatmap-color': [ 'interpolate', ['linear'], ['heatmap-density'], 0, 'rgba(236,222,239,0)', 0.2, 'rgb(208,209,230)', 0.4, 'rgb(166,189,219)', 0.6, 'rgb(103,169,207)', 0.8, 'rgb(28,144,153)' ], // increase radius as zoom increases 'heatmap-radius': { stops: [ [11, 15], [15, 20] ] }, // decrease opacity to transition into the circle layer 'heatmap-opacity': { default: 1, stops: [ [14, 1], [15, 0] ] }, } }, 'waterway-label');
Add the circle layer
Next, add a circle layer. As you zoom in to your heatmap, the points stop overlapping visually and it is no longer necessary to show their distribution and density. At this point, you can show the points themselves and allow viewers to explore the data interactively.
Remember how you used a stop function in the previous step to fade the heatmap layer out between zoom level 14 and 15? You'll need to replace that layer by fading your circle layer in, using a zoom function to increase its circle-opacity between zooms 14 and 15. For circle-radius, use a zoom-and-property function to increase the radius by zoom level and property (as demonstrated below). Add the following code after the heatmap layer you added in the last step.
map.addLayer({ id: 'trees-point', type: 'circle', source: 'trees', minzoom: 14, paint: { // increase the radius of the circle as the zoom level and dbh value increases 'circle-radius': { property: 'dbh', type: 'exponential', stops: [ [{ zoom: 15, value: 1 }, 5], [{ zoom: 15, value: 62 }, 10], [{ zoom: 22, value: 1 }, 20], [{ zoom: 22, value: 62 }, 50], ] }, 'circle-color': { property: 'dbh', type: 'exponential', stops: [ [0, 'rgba(236,222,239,0)'], [10, 'rgb(236,222,239)'], [20, 'rgb(208,209,230)'], [30, 'rgb(166,189,219)'], [40, 'rgb(103,169,207)'], [50, 'rgb(28,144,153)'], [60, 'rgb(1,108,89)'] ] }, 'circle-stroke-color': 'white', 'circle-stroke-width': 1, 'circle-opacity': { stops: [ [14, 0], [15, 1] ] } } }, 'waterway-label');
Add some additional interactivity
The following code adds interactivity to your map by allowing your viewers to to click on your circle layer to view a popup containing the tree's DBH value. Include the code below after your circle layer.
0 notes
Text
Notes from Root Conf Day 2 - 2017
On day 2, I spent a considerable amount of time networking and attend only four sessions.
Spotswap: running production APIs on Spot instance
Amazon EC2 spot instances are cheaper than on-demand server costs. Spot instances run when the bid price is greater than market/spot instance price.
Mapbox API server uses spot instances which are part of auto-scaling server
Auto scaling group is configured with min, desired, max parameters.
Latency should be low and cost effective
EC2 has three types of instances: On demand, reserved and spot. The spot instance comes from unused space and unstable pricing.
Spot market starts with bid price and market price.
In winter 2015 traffic increased and price also increased increased
To spin up a new machine with code takes almost two minutes
Our machine fleet encompasses of spot and on-demand instances
When one spot machine from the fleet goes down, and auto scaling group spins up an on-demand machine.
Race condition: several instances go down at same time.
Aggressive spin up in on-demand machines when market is volatile.
Tag EC2 machines going down and then spin up AWS lambda. When spot instance returns shit down a lambda or on-demand instance. Auto Scaling group can take care of this.
Savings 50% to 80%
Source code: https://github.com/mapbox/spotswap
No latency because over-provisioned
Set bid price as on-demand price.
Didn't try to increase spot instance before going on-demand
Cfconfig to deploy and Cloud formation template from AWS
Adventures with Postgres
Speaker: I’m an Accidental DBA
The talk is a story of a Postgres debugging.
Our services include Real-time monitoring, on demand business reporting to e-commerce players. 4000 stores and 10 million events per day. Thousands of customers in a single database.
Postgres 9.4, M4.xlarge,16GB, 750 GB disk space with Extensive monitoring
Reads don't block writes, Multi-Version Concurrency Model.
Two Clients A, B read X value as 3. When B updates the value X to 4, A reads the X value and gets back as 3. A reads the X value as 4 when B’s transaction succeeds.
Every transaction has a unique ID - XID.
XID - 32 bit, max transaction id is 4 billion.
After 2 billion no transaction happens.
All writes stop and server shutdown. Restarts in single user mode,
Read replicas work without any issue.
Our server reached 1 billion ids. 600k transaction per hour, so in 40 days transaction id will hit the maximum limit.
How to prevent?
Promote standby to master? But XID is also replicated.
Estimate the damage - txid_current - Current Transaction ID
Every insert and update is wrapped inside a transaction
Now add begin and commit for a group of statements, this bought some time.
With current rate, 60 days is left to hit max transaction limit.
TOAST - The Oversized Attribute Storage Technique
Aggressive maintenance. Config tweaks: autovacuum_workers, maintenance_work_mem, autovaccum_nap_time - knife to gun fight. Didn’t help
rds_superuser prevented from modifying pg system tables
Never thought about rds_superuser can be an issue.
VACUUM -- garbage-collect and optionally analyze a database
vacuum freeze (*) worked. Yay!
What may have caused issues - DB had a large number of tables. Thousands of tables
Better shard per customer
Understand the schema better
Configuration tweaks - max_workers, nap_time, cost_limit, maintenance_work_mem
Keep an eye out XID; Long-lived transactions are problem
Parallel vacuum introduced in 9.5
pg_visibility improvements in 9.6
Similar problem faced other companies like GetSentry
MySQL troubleshooting
Step 1 - Define the problem, know what is normal, read the manual
Step 2: collect diagnostics data (OS, MySQL). pt_stalk tool to collect diagnostics error
Lookup MySQL error log when DB misbehaves.
Check OOM killer
General performance issues - show global variables, show global status, show indexes, profile the query
Table corruption InnoDB, system can't startup. Worst strategy force recovery and start from backup.
Log message for table corruption is marked as crashed
Replication issues - show master status, my.cnf/my.ini, show global variables, show slave status
OTR Session - Micro Service
OTR - Off The Record session is a group discussion. Few folks come together and moderate the session. Ramya, Venkat, Ankit and Anand C where key in answering and moderating the session.
What is service and micro service? Micro is independent, self-contained and owned by the single team. Growing code base is unmanageable, and the number of deploys increases. So break them at small scale. Ease of coupling with other teams. No clear boundary
Advantages of Microservices - team size, easy to understand, scale it. Security aspects. Two pizza team, eight-member team. Able to pick up right tools for the job, and change the data store to experiment, fix perf issues.
How to verify your app needs micro service?
Functional boundary, behavior which is clear. Check out and Delivery
PDF/Document parsing is a good candidate for Micro Service, and parsing is CPU intensive. Don't create nano-service :-)
Failure is inevitable. Have logic for handling failures on another service. Say when MS 1 fails MS2 code base should handle gracefully.
Message queue Vs Simple REST service architecture. Sync Vs Async.The choice depends on the needs and functionality.
Service discovery? Service registry and discover from them.
Use swagger for API
Overwhelming tooling - you can start simple and add as per requirements
Good have to think from beginnings - how you deploy, build pipelines.
Auth for internal services - internal auth say Service level auth and user token for certain services. Convert monolithic to modular and then micro level.
API gateway to maintain different versions and rate limiting When to use role-based access and where does scope originate? Hard and no correct way. Experiment with one and move on.
Debugging in monolithic and micro service is different.
When you use vendor-specific software use mock service to test them. Also, use someone else micro service. Integration test for microservices are hard.
Use continuous delivery and don't make large number of service deployment in one release.
The discussion went on far for 2 hours! I moved out after an hour. Very exhaustive discussion on the topic.
1 note
·
View note
Text
How to add a custom Mapbox map style to your React Leaflet App
Learn how to add a custom Mapbox map style to your React Leaflet app. We’ll walk through how to create a new map using Mapbox Studio, configure the endpoint with your new style and API key, and add that map as a tilelayer in a React Leaflet and Gatsby Starter Leaflet app. How to add a custom Mapbox map style to React Leaflet and Gatsby Starter Leaflet
#reactjs #gatsby #javascript #webdevelopment…
View On WordPress
0 notes
Quote
What are we going to build? We’re going to walk through creating a new basic Mapbox style in our Mapbox account. Once created, we’re going to use their Map API to add a custom basemap to our React Leaflet app. Gatsby Starter Leaflet with Mapbox basemapFor our map, we’re going to use this Leaflet Gatsby Starter I created that will allow you to easily spin up a new mapping app. Before we spin that up though, I’ll walk you through how to add it using only React Leaflet components. A mapping app? Yup! Maps are used all around the world to study datasets for geographic locations. They're important tools for scientists and others that are trying to help the world. Coronavirus (COVID-19) custom mapIf you want to learn more about building a map and adding data to it, you can check out some of my other articles first such as creating a Coronavirus (COVID-19) map or a Summer Road Trip map as well as a little bit of inspiration about why Anyone Can Map. What is Mapbox? Mapbox is a mapping platform that allows its customers to create custom mapping solutions. They also leverage a variety of APIs that provide powerful capabilities for building map features. mapbox.comFor our purposes, we’re going to utilize their Map API, specifically their Static Tiles API, to serve a custom map style that we create. Part 1: Creating a custom Mapbox style To get the look and feel that we want for our map, it’s important to have a basemap that helps make our data present itself without distractions. Plus, sometimes it’s fun to have a custom map. Mapbox account The first thing we’ll need to set up our custom Mapbox style is to have an account. I'm not going to walk you through that process, but you can head over to Mapbox’s website where you can sign up for free: mapbox.com Creating a new custom style Creating a new style in Mapbox isn’t as hard as it sounds. While it can get really complex if you want something unique, we can copy one of Mapbox’s default styles to get started. First, head over to Mapbox’s Studio dashboard by clicking your account link in the top right corner when logged in. Mapbox StudioOnce we’re on our Studio dashboard, we want to select the New Style button. Create a new style in Mapbox StudioAfter clicking the button, a modal will pop up allowing you to choose a template. You can choose whatever you want here, but I’m going to choose Monochrome with a variation of Dark. And after you’ve selected your template, click the Customize button. Select and customize a template for a new style in Mapbox StudioAnd now we’re dropped into our customization UI. Mapbox customize style UIFrom here, you can really do what you’d like. There are a ton of options to customize your map. It’s a little complex to try to dig in here, but Mapbox provides some resources to try to help you get productive. Generating a Mapbox token Once you’re happy with your new style and everything’s published, we want to generate a token that we’ll use for providing access to our Map. Head on over to the Account section of the Mapbox dashboard. Creating a new token in MapboxMapbox provides you with a “default” token that you can use in your applications. You're free to use this, but I recommend creating a new token that you can provide a unique name, that way if you ever blow past the free tier of Mapbox, you’ll be able to track your usage. Additionally, it’s best to keep a separate token for each application, that way you can easily rotate an individual key, without having to update every application using it. Once you click Create a token, you can set up the key how you’d like, with the scopes and permissions you choose, but for our purposes, you can leave all of the Public scopes checked for our map, which they do by default. Create a new access token in Mapbox Configuring our custom endpoint For this tutorial, we’re going to use Mapbox’s Static Tiles service. Mapbox Static Tiles Maps APIOur endpoint will look like the following: https://api.mapbox.com/styles/v1/{username}/{style_id}/tiles/256/{z}/{x}/{y}@2x?access_token={access_token} There are a few parameters here we need to understand: username: this will be your Mapbox account’s username style_id: this will be the ID of the style you created before z, x, y: these are parameters that Leaflet programmatically swaps out, so we want to leave them as is access_token: this is the Mapbox key you created above To find your username and style ID, we can use the Style URL for our new Mapbox style to get those values. Finding the Style URL in Mapbox StudioIn my example, my Style URL looks like: mapbox://styles/colbyfayock/ck8lryjfq0jdo1ip9ctmuhc6p colbyfayock is my username and ck8lryjfq0jdo1ip9ctmuhc6p is my style ID. And once I update my endpoint parameters, the final tilepoint URL will look like: https://api.mapbox.com/styles/v1/colbyfayock/ck8lryjfq0jdo1ip9ctmuhc6p/tiles/256/{z}/{x}/{y}@2x?access_token=MYACCESSTOKEN Part 2: Adding a custom TileLayer to React Leaflet When building a map with React Leaflet, your main component will be a that wraps the entirety of the app. This is what sets up your Map instance for Leaflet. For our purposes here, we’re going to use the example on the React Leaflet homepage as our starting point. React Leaflet TileLayer Component Inside of your component you include a component, which defines the imagery of the world that you base your map upon. The example on the React Leaflet homepage uses a public version of OpenStreetMap as their TileLayer, which is an open source map project created and updated by people all around the world. This gives you a basic map, but we want to swap in Mapbox so we can set up a custom look and feel for our map. Custom Mapbox TileLayer To add our custom style, we’ll want to update the url and attribution props of the TileLayer component. For URL, it will simply be the custom style endpoint we created earlier, so in my example, it looks like: https://api.mapbox.com/styles/v1/colbyfayock/ck8lryjfq0jdo1ip9ctmuhc6p/tiles/256/{z}/{x}/{y}@2x?access_token=MYACCESSTOKEN For attribution, we want to credit Mapbox as the service, so we want to set our attribution as: Map data © OpenStreetMap contributors, CC-BY-SA, Imagery © Mapbox When plugged in to our TileLayer, our code should now look like this: And once we open up our map, we should see our new basemap! React Leaflet with a Mapbox basemap See the code! If you want to see how I did it, check out the diff commit by commit. The only caveat there is I created an .env.development.local file in the root of my project in which I stored a new environment variable called REACT_APP_MAPBOX_KEY to store my Mapbox key. Part 3: Adding a custom basemap to Gatsby Starter Leaflet I’ve written a few other articles on how to get started with my Leaflet Gatsby Starter, but for this part, we’ll want to have a basic app spun up that we can use to change our TileLayer endpoint. Setting up our React Leaflet Gatsby app To get started, check out the instructions on the Starter github: https://github.com/colbyfayock/gatsby-starter-leaflet Once you’re ready, you should have a basic mapping app ready to go! New Leaflet Gatsby app in the browser Configuring our Mapbox service The first thing we’ll want to do is add Mapbox as a service in our src/data/map-services.js file. Taking our custom endpoint URL that we created in Part 1, let’s set up a new object with a name of Mapbox, and with a url and attribution similar to what we did in Part 2. export const mapServices = [ { name: ‘OpenStreetMap’, attribution: '©
http://damianfallon.blogspot.com/2020/04/how-to-set-up-custom-mapbox-basemap.html
0 notes
Text
MapBox Games

The Mapbox Maps SDK for Unity provides a starting point for location-based games. There are two location-based game example scenes inside of the SDK: Location-based game and Astronaut game.
Both make use of the LocationProvider which will automatically use the device GPS to position the game map.
You can use the LocationProvider by dropping the LocationBasedGame prefab game object into a scene. It comes configured with the LocationProvider, Map, and Player objects by default.
I had a look into using MapBox for games as I wanted to see how people use it in their games. I think MapBox is quite complicated for what I want to do, but I think I will use the base of maps for my app.
https://docs.mapbox.com/unity/maps/overview/location-based-games/
0 notes
Text
January 10, 2020 at 10:00PM - The 2019 Game Dev & Design Mega Mastery Bundle (98% discount) Ashraf
The 2019 Game Dev & Design Mega Mastery Bundle (98% discount) Hurry Offer Only Last For HoursSometime. Don't ever forget to share this post on Your Social media to be the first to tell your firends. This is not a fake stuff its real.
Why spend thousands of dollars on a formal video game development degree? Avoid a lifetime of loan payments, and get practical experience you can instantly use to develop your own games. In this course, you’ll walk through the basics of using the 3ds Max game development software to create real life projects. You’ll explore video game art, animation, 2D and 3D modeling, layout, and much more as you fast track your way to becoming a professional video game artist.
Access 87 hours of instruction 24/7
Explore a wide array of game design topics, like basic traditional drawing, training to be a professional video game artist & more
Learn the basics of 3ds Max & use it to create real-life projects
Understand 2D & 3D drawing techniques
Fully master game layout & design principles
Get a primer on video game art, animation, 2D & 3D modeling, layout, and design
Note: Software not included.
Strengthen your grasp of Python by exploring game development through way of creating a real, working clone of the viral hit Flappy Bird. From creating menus to crafting levels of increasing difficulty, you’ll learn the programming skills you need to build games for any platform or operating system well after this course ends.
Access 20 lectures & 4 hours of content 24/7
Learn game development by creating a clone of Flappy Bird
Create input controls, boundaries, crash events & menus
Use polygons to build obstacles
Add graphics & customize their display
Configure the logic of your game
Set up a score display
Add levels to your game
Consolidate skills you can use to build games for any platform or OS
Note: Software not included.
If you want to kickstart a career creating games, you’ll need to get familiar with Unity 3D, the increasingly popular and widely-adopted game engine used to create today’s gaming hits. This course offers a deep dive into Unity 5 and its most powerful features, such as the Standard Shader, PhysX 3.3 technology, Global Illumination, and Audio Mixer.
Access 9 lectures & 2 hours of content 24/7
Leverage the development potential of the new UI
Use the new animation tools to create visually dynamic games
Utilize the new Standard Shader to ensure your materials look consistent in any lighting environment & across all platforms
Effectively light your games with new global illumination & lighting tools
Note: Software not included
Intuitive, versatile, and most importantly free, Blender is the incredibly popular 3D modeling software developers use to bring their games to life. Covering Blender’s fundamental modeling tools, this course will show you how to create and texture 3D models. You’ll walk through giving your models, materials, and textures a professional look, with extra detail and color to make then look complete and professionally done.
Access 20 lectures & 2 hours of content 24/7
Explore the fundamental tools for modeling in Blender
Learn how to create models, materials & textures w/ professional look
Access additional Blender learning resources & project files to continue learning and practicing
Note: Software not included
Build your first fully-functional game in only 60 minutes with this Unity 5 crash course! An amazingly popular game engine used to create and develop 2D and 3D games, Unity is quickly becoming a standard in the gaming industry, and this course will get you up to speed as you use it complete three different game projects. Across 12 hours of training, this course will teach you all about using Unity 5 for scripting, level creation, adding audio, building scenes, and much more.
Access 12.5 hours of content 24/7
Create a trivia game to learn basic programming & how to navigate the Unity UI
Build a 2D platforming game & learn how to design levels, insert backgrounds and more
Create a first person shooter game to implement visual effects & AI
Integrate art assets & write code using C#
Note: Software not included.
It doesn’t take much to create a single-level game, but designing one that’s actually fun to play is a different story. Using Blender and Unity 3D, this course will walk you through the concepts and best practices of level design, so you can ultimately create your own complete, professional game level. You’ll take on each aspect of level design in detail, covering floors, ceilings, walls, focal points, props and more, all the while filling in your level as you learn. From there, you’ll bring these elements to life by adding textures and eventually create a polished, finished product.
Access 6 hours of content 24/7
Explore game level design in both conceptual & practical terms
Learn how to design 3D models for game levels w/ Blender
Use Photoshop to create textures for your project
Learn how to construct & operate a full game level w/ Unity 3D
Note: Software not included.
Master the world’s most popular programming language and create your first game with this Java course. By having you create a clone of the viral game Flappy Bird, this course will get you savvy with the essentials of Java game development. You’ll explore key programming concepts, like creating effective game loops, loading resources, creating and customizing windows and interfaces and much more. Complete the course, and you’ll emerge with your first game clone and a solid framework to apply to other projects.
Access 2 hours of content 24/7
Master the fundamentals of Java game development by creating a Flappy Bird clone
Deepen your understanding of customizing windows, interfaces, game engines & more
Create your first game clone using Java
Note: Software not included
The best way to learn is by doing, which is why this course is the perfect starting point for any aspiring game developers. Using Unity 3D and C#, this course takes you through the fundamentals of game development as you create your own Blackjack game. You’ll explore Unity 3D’s user interface and leverage its unique features to create your project. And, you’ll also get up to speed with the C# language and start writing scripts to bring your project to life.
Access 3 hours of content 24/7
Get an introduction to Unity 3D’s user interface & tools
Learn how to write scripts w/ the C# programming language
Create a fully-functional Blackjack game to prove your game dev skills
Learn how to properly adjust & align UI graphics like text and buttons
Note: Software not included.
Peek inside any game dev’s toolbox, and chances are you’ll find Unity, the amazingly popular game development engine responsible for many of today’s biggest gaming hits. Packing a whopping 35 hours of training, this course will show you the Unity ropes as you go from newbie to bona fide game dev pro. You’ll start by learning how to code with C#. Then, you’ll dive into your first game project and learn about physics and scripting with Unity. From there, you’ll take on building 3D environments, creating character animations, and more.
Access 115 lectures & 35 hours of training 24/7
Learn how to code w/ C# & build games w/ Unity 3D
Familiarize yourself w/ scripting, physics & AI in games
Learn how to build 3D environments & create character animations
Get hands-on training working with several game projects
Familiarize yourself w/ developing for multiplayer games
Note: Software not included.
Merging gaming and reality together, games like Pokémon GO and Ingress took the world by storm with their location-based gameplay; and you can too with Mapbox. Bringing the power of location to your gaming projects, Mapbox is the live location platform that empowers you to create amazingly immersive games. Jump into this course, and you’ll discover Mapbox’s potential as you create several games that use the power of location and maps.
Access 51 lectures & 10 hours of training 24/7
Learn how to create immersive, location-based games w/ Mapbox
Build a mobile droid-catching game based on real-time location data
Learn how to create a map in Unity & customize one in Mapbox Studio
Discover how to generate buildings & obstacles in your games w/ Mapbox’s Terrain Vector Tile system and curated Points of Interest
Note: Software not included.
from Active Sales – SharewareOnSale https://ift.tt/306cT2w https://ift.tt/eA8V8J via Blogger https://ift.tt/2uwJDns #blogger #bloggingtips #bloggerlife #bloggersgetsocial #ontheblog #writersofinstagram #writingprompt #instapoetry #writerscommunity #writersofig #writersblock #writerlife #writtenword #instawriters #spilledink #wordgasm #creativewriting #poetsofinstagram #blackoutpoetry #poetsofig
0 notes
Link
Most of the applications and sites we use today are bound to show location and various data on maps. Maps are used everywhere: from food delivery sites to online stores and complex applications for logistics companies. Maps are used very widely in web design, and when presenting data, we usually expect them to be interactive. It can be the branches of an international company, statistics about countries or just destinations to visualize. Maps that are pre-arranged help people find your business without having to spend time looking for your physical location manually. One way or another, while developing another application you will definitely face the questions of working with maps. What tools should you use? Paid or open-source? Standalone or web-based? Many different plugins and libraries that you will find on our list are built specifically to make it easy for people to find your business. But Google Maps isn’t the only solution. Firstly, it does not provide too many customization options, such as custom marking and adding extra widgets to make your maps more interactive. Other than that, you might need maps specifically for contests, exploration, traveling, hiking, and much more. That’s why you may need open-source solutions. In this article-comparison we will talk about different types of javascript tools for working with maps. We’ll look at the types of tools you can choose from, as well as the comparison options. Classification of javascript solution for maps Due to a large number of different tools for working with maps, it would be good to categorize them to give a definition of each category. In this article, the categories for Web mapping clients have been extracted from the projects’ descriptions. Thus, there are libraries, wrappers, toolkits, frameworks, and clients. Libraries: Expose classes and functions allowing to build applications at a higher level of programming;Wrappers: act as an interface between its caller and the wrapped code;Toolkits: more modular and easily integrated into a custom application;Frameworks: A reusable software template, or skeleton, from which key enabling and supporting services can be selected, configured and integrated with application code;Clients: ready-to-use Web mapping applications.This way of categorizing Web mapping clients provides a first approach for distinguishing them, so you could select more easily. The comparison The comparison is presented in three parts to facilitate the reading: General description: Gives an introduction to each project.Technical features: Presents some technical data on each project.Links of interest: Includes a screenshot showing how the client looks like as well as links to useful pages and live demos.How to choose the right solution? So, which mapping framework should you choose? It depends on what features you need and how much you want to customize your map. In this section, we will take 2 products as a base for questions on how to choose a tool for work with maps. These are Google Maps and Leaflet – the most popular tools that reflect the 2 types of solutions to the question of choosing a tool for working with maps.Most users will be well served by simply choosing one of these two. First of all, you need to start with a question – Do I Even Need A Mapping Framework? If you need something set up quickly, have no custom data and default map themes are OK for you – simply use an embedded map like the Bing one to the left. Google, Bing and others offer options to embed a map. Either of these choices (embedding or using a plugin) will meet only the most basic of mapping needs. If your use case fits within what they offer, then I encourage you to use them. When your mapping needs get more complex, you will need to switch to using an actual mapping framework. When you choose the tool for maps apart of the technical classification, you will have to choose from Paid or Open-source solutions. Both paid and open-source ones are good and reliable mapping frameworks and there are a lot of good things they can do. Choosing between the two types will require consideration of several factors. The Google Maps API is created and maintained by Google. All updates, improvements and rules regarding its use come from Google. All free tier implementations must be publicly available – intranet usage and maps behind a paywall require a premium plan. Leaflet is an Open Source project, like WordPress, and there are fewer restrictions on its use. You can use it behind a paywall or on an intranet, use it for unlimited map views (though your base map provider may have its own limitations), remove or customize the branding and more. Let’s move to the next question you will ask when choosing the solution for your business. Releases and Upgrades Since Google controls the Google Maps API, they determine the release schedule and when new features are added. They also determine when older versions of the code will be retired. For the most part it’s a good thing. It means most websites will be using the same version of the API and that developers using the Google Maps API will be familiar with exactly what options are available. With Leaflet, upgrades are more frequent and incremental, new releases are made as new features are available. The plugin updates are also independent of the map updates, so additional improvements may come through those channels too. Or, if you’ve got a Leaflet map you’re happy with, you can copy the map code to your own server and keep using an older version for as long as you want – you aren’t forced to upgrade. Support Options If you’re using the free tier of Google Maps, then you could check out their community support site. If you are a paid plan Google Maps API user, you will have other support options available to you, including a hotline you can call. For Leaflet, there is active community support on StackExchange, StackOverflow and on GitHub, where the project code is hosted. Tools and libraries for maps Some of these map tools can really reduce the amount of effort needed to produce interactive maps. Many of these tools allow you to implement all kinds of dynamic maps with just a few lines of code. Here are the JS libraries you can use to show special map markers, draw custom route lines or even show a dialog when you hover or click on certain points of the map. Personalize your maps in the style that you want – some of them can be styled with CSS – or customize your map to be as interactive as you like. The source of the map data, dependencies and licenses of each library have been included for your convenience. For this roundup, we have chosen some of the Best JavaScript Libraries for creating interactive maps for your web applications. The following libraries provide a myriad of functions and features that help developers to create complex maps easily and quickly. Leafletjs Web-site: https://leafletjs.com/ GitHub stars: 25807, https://github.com/Leaflet/Leaflet/ Pricing: Free Map Data Source: OpenStreetMap Dependencies: None License: BSD 2-Clause “Simplified” License Category: Library Examples/Demo/Gallery: https://leafletjs.com/examples.html Leaflet.js Leaflet is one of the best open-source JavaScript libraries for creating mobile-friendly interactive maps. It is relatively small with a ton of features, plugins, straightforward API, and it works across all browsers and platforms. Here are some Leaflet.js demos. Its basic library is fairly small, making Leaflet a great option for mobile applications or other situations in which load time or size is at a premium. It also has a ton of available plugins meaning you can add on just about any functionality available with a heftier mapping library. It is also supported by some of the leading companies in the world; GitHub, Flickr, Facebook, Etsy and many more. Because it’s an open-source project, community members are welcome to contribute to the repository and make it even greater than it already is. Leaflet also has a strong documentation project behind it, making it a good choice for beginners, and there are a number of community-contributed examples out there on the Internet for when you get stuck, as well as many examples on the project homepage. Openlayers Web-site: https://openlayers.org/ GitHub stars: 5517, https://github.com/openlayers/openlayers Pricing: Free Map Data Source: OpenStreetMap Dependencies: None License: 2-Clause BSD Category: Library Examples: https://openlayers.org/en/latest/examples/ Openlayers OpenLayers is a high-performance open-source JavaScript framework to build interactive maps using various mapping services. You can choose the map layer source using a tiled layer or vector layer from a number of map services. The product comes mobile-ready out of the box, suitable for building maps across devices and browsers. You can use CSS for a different look at your map. To implement the map on your web using OpenLayers, here’s a tutorial that will help. OpenLayers is also capable of rendering vector data from GeoJSON, TopoJSON, KML, GML and other geographic data formats. The documentation for OpenLayers is well organized and provides a lot of information for developers. A gallery on the OpenLayers website contains a large selection of live demos, and quite a few code samples are available on GitHub. You can find beautiful maps for your admin panel. Mapbox Web-site: https://www.mapbox.com/ GitHub stars: 4845, https://github.com/mapbox/mapbox-gl-js Pricing: Free, starts from $4 for 1000 loads Map Data Source: Mapbox Dependencies: None License: Mapbox copyright Category: Web Application Examples: https://docs.mapbox.com/mapbox-gl-js/examples/ Mapbox Mapbox is one of the most advanced mapping solutions on the web right now. It is built for developers by experienced developers themselves. It gives easy to use set of tools for creating beautiful web and mobile maps. It offers users full control over map styling (including background map) and has a lot of cool additional services such as satellite images and geocoding or directions. The Mapbox platform features textures, illustrations, custom markers, vector tiles, static maps, geocoding and more. Mapbox offers five plans, ranging from a free starter plan to a high-volume enterprise plan. The platform also features Mapbox Editor, an online editor that allows users to quickly build custom maps using their own data. Data can be imported from a spreadsheet file (CSV), GeoJSON, KML or GPX. The documentation is well-designed and easy to follow. Google Maps API Web-site: https://developers.google.com/maps/documentation GitHub stars: – Pricing: Free, starts from $14 for 14000 loads in static maps Map Data Source: Google Dependencies: None License: Google copyright Category: Web Application Examples: https://developers.google.com/maps/documentation/javascript/examples Google Maps API Google Maps is a safe choice for anyone, whether an inexperienced webmaster or an advanced developer. It has been around for long enough to have established themselves as the leaders in mapping industry. To add to that, JavaScript API makes it easy to integrate Google Maps into any application, service or website you desire. Moreover, WordPress users will be able to find plenty of plugins to support Google Maps on their site, all of which use the API to deliver end result. You can find beautiful maps for your admin panel. Datamaps Web-site: https://datamaps.github.io/ GitHub stars: 3245, https://github.com/markmarkoh/datamaps Pricing: Free Map Data Source: D3.js Dependencies: D3.js and TopoJSON License: MIT License Category: Library Examples: https://datamaps.github.io/ Datamaps DataMaps – interactive maps for data visualizations bundled into a single Javascript file. It is SVG-based, can be scaled to any screen size and relies heavily on D3.js. It comes with ready-to-use maps for world map with countries, USA with states and a combined one. The map data is stored as JSON and any custom maps can be created by following the structure. Jvectormap Web-site: http://jvectormap.com/ GitHub stars: – Pricing: From $39 Map Data Source: jVectorMap Dependencies: jQuery License: GNU GPL, paid Category: Library Examples: http://jvectormap.com/examples/world-gdp/ jVectorMap jVectorMap is an open-source library for interactive maps that requires jQuery. jVectorMap has quite a small API reference and does not feature Documentation as we know it, but there is a concise Getting Started tutorial which is still very helpful. jVectorMap uses only native browser technologies like JavaScript, CSS, HTML, SVG or VML. No Flash or any other proprietary browser plug-in is required. This allows jVectorMap to work in all modern mobile browsers. Bing Maps Web-site: https://www.microsoft.com/en-us/maps/choose-your-bing-maps-api GitHub stars: – Pricing: Free, custom (on request) Map Data Source: Bing Maps Dependencies: None License: Microsoft copyright Category: Web Application Examples: https://docs.microsoft.com/en-us/bingmaps/v8-web-control/index Bing Maps Microsoft Bing Maps is a very popular mapping platform. Microsoft is steadily working on adding new features and improvements to the Bing Maps Platform. There is a nice AJAX Interactive SDK that provides feature samples and code snippets for developers building JavaScript applications. The Bing Maps platform provides multiple API options for applications including Web Control, a Windows Store apps control, a WPF control, REST Services, and Spatial Data Services. Amcharts Map Chart Web-site: http://www.amcharts.com/javascript-maps/ GitHub stars: – Pricing: Free, from $180 Map Data Source: amCharts Dependencies: None License: Amcharts copyright Category: Library Examples: https://www.amcharts.com/demos/#maps Ammap amMap is a special JavaScript (HTML5) library for maps developed by amCharts. It has no external dependencies and allows you to build beautiful choropleths, bubbles, dots (or points), connectors and flow maps quite easily, as well as supporting multiple utile interactive features. The tool can be used to show locations of offices, routes of journeys, create distributor map, etc. The product offers a number of features: it lets you use photos or images as layers and backgrounds, as well as highlight location and routes. Kartograph Web-site: http://kartograph.org/ GitHub stars: 1519, https://github.com/kartograph/kartograph.js Pricing: Free Map Data Source: Kartograph Dependencies: Kartograph.py, Raphael, and jQuery License: AGPL and LGPL Category: Framework Examples: http://kartograph.org/showcase/ Kartograph Kartograph is a simple and lightweight framework for generating SVG maps without any other mapping services. Kartograph.js is a JavaScript library for creating interactive maps based on Kartograph SVG maps. It is built on top of Raphael and jQuery and it gracefully degrades to Internet Explorer 7+. There is no ready-to-use map collection in Kartograph, but the library works with any SVG maps, also offering a utility named Kartograph.py to create maps. While Kartograph is not dependency-free requiring both Raphael JS (used for drawing) and jQuery, it provides you with smooth mapping experience, whereas the library documentation and API reference (combined in a single article) allow you to get interactive maps up and running in your projects in quite a nice and easy manner. ArcGIS Web-site: https://developers.arcgis.com/ GitHub stars: – Pricing: Free, from $125 monthly Map Data Source: Esri Dependencies: None License: Esri copyright Category: Framework Examples: https://developers.arcgis.com/javascript/3/jssamples/ ArcGIS ArcGIS API for JavaScript – a lightweight way to embed maps and tasks in web applications. It comes with a ton of features, samples, bundled widgets and templates. Here is a good ArcGIS Boilerplate. Esri has a really nice portal for developers that is well-designed and easy to follow. The developer portal includes access to ArcGIS APIs and SDKs, good documentation, live demos, code samples and more. Esri offers standalone developer pricing that uses a credit system (for developers who do not have an ArcGIS online subscription). Esri technology is used by more than 350,000 organizations worldwide, and over two-thirds of them are Fortune 500 companies. Zeemaps Web-site: https://www.zeemaps.com/ GitHub stars: – Pricing: Free, from $19.95 per month Map Data Source: – Dependencies: None License: Zeemaps copyright Category: Web Application Examples: https://www.zeemaps.com/mobile?group=1971477 ZeeMaps ZeeMaps is an enterprise-class mapping service that allows you to easily create, publish and share interactive maps. You can construct dynamic visualizations of geographic information, producing maps from your list of people or places. For example, you can create a map of places you have visited, or maps that mark the addresses of your customers, sales leads, friends and relatives. All maps are stored on their own servers and can be instantly accessed at any time, anywhere, from any standard Web browser on a computer or mobile device. All maps can be crowdsourced for additions. That makes it a very reliable platform to use between groups of people. Other features also include grids, icons, markers and custom fields. This is a tool that is tailored for specific types of interactive maps – it is wonderful at letting you create, publish and share maps for presentation or geoanalysis. It offers the kind of features that most others on the list do. In addition, it makes it easier for you to get inputs for the map from different sources and set up 3-level access for the maps. Anymap by Anychart Web-site: https://www.anychart.com/products/anymap/overview/ GitHub stars: – Pricing: From $79 Map Data Source: Anychart Dependencies: None License: Anycharts copyright Category: Library Examples: https://www.anychart.com/products/anymap/gallery/ AnyMap AnyMap is one of popular JavaScript (HTML5) charting libraries created by AnyChart. Just like amMap, it requires no big efforts to build a map using it as well as no external resources or third-party libraries such as jQuery. AnyMap also supports all basic types of maps you might need – choropleth, bubble, dot, connector and flow maps. The list of key interactive features of AnyMap includes drill-down for region-specific insights, events model for processing map viewer actions, and color scale for automatically coloring a map according to your settings instead of doing that manually. Highmaps by Highcharts Web-site: https://www.highcharts.com/products/highmaps/ GitHub stars: 8999, https://github.com/highcharts/highcharts Pricing: Free and paid (From $390) Map Data Source: Highcharts Dependencies: jQuery License: Highcharts copyright Category: Library Examples: https://www.highcharts.com/maps/demo HighMaps Highmaps library is the younger sister of Highcharts and Highstock, popular charting libraries developed by Norway’s Highsoft. Its core advantages are the open source nature with all its pros, light weight which ensures high rendering performance, and a vast set of interactive features such as drill down and others. Among the map types supported in Highmaps are choropleth and bubble maps. It is also possible to draw lines to depict a road, a river, or a connector. However, making flow maps is not as simple as with amMap or AnyMap, for example. It is also worth noting that neither Highcharts nor Highmaps can work without jQuery, so you must have this dependency if you want to use them or choose another charting library. A good thing is that Highmaps offer multiple ready-to-use maps in both SVG and GeoJSON. The documentation is quite extensive and is great at helping you understand the library’s settings quite quickly and easily. Cesium Web-site: https://cesiumjs.org/ GitHub stars: 4941, https://github.com/AnalyticalGraphicsInc/cesium Pricing: Free Map Data Source: Cesium Dependencies: None License: Apache License 2.0 Category: Library Examples: https://cesiumjs.org/demos/ Cesium Cesium, a WebGL-powered JavaScript mapping library, offers just that by being provider-agnostic. It has support for 3 different views: 3D globe, 2D map, and 2.5D Columbus View. It works across different platforms and different browsers: you don’t have to worry about compatibility. Polymaps Web-site: http://polymaps.org/ GitHub stars: 1533, https://github.com/simplegeo/polymaps Pricing: Free Map Data Source: OSM, Bing Dependencies: None License: SimpleGeo and Stamen copyright Category: Library Examples: http://polymaps.org/ex/ Polymaps Polymaps is a free JavaScript library for creating dynamic and interactive maps. Besides the usual cartography from OpenStreetMap, CloudMade, Bing, etc., it works with image-based and vector-tiled maps by providing a quick display of multi-zoom datasets over maps and supports a variety of visual presentations. Its main strength is making it very easy to composite raster and vector data from many different sources. It can meet all your requirements, particularly in letting you easily add your own coloring, grouping and interaction. Polymaps is also quite efficient: it runs quickly, it manages background tile loading well, and it’s only 30k of Javascript. The nice thing about using SVG (scalable vector graphics) for creating maps is that it means that many of the same styling options which can be applied to web documents with CSS will also work with your map design. As Polymaps can load data at a full range of scales, it’s a good fit for showing information from a country level on down to states, cities, neighborhoods and individual streets. Mapael Web-site: https://www.vincentbroute.fr/mapael/ GitHub stars: 922, https://github.com/neveldo/jQuery-Mapael Pricing: Free Map Data Source: Raphael.js Dependencies: jQuery License: MIT License Category: Library Examples: https://www.vincentbroute.fr/mapael/ Mapael jQuery Mapael allows you to create maps with elegant data visualization as well as interactivity. You can, for example, create a map and designate each region on the map with different colors based on region. You can also add tooltip on the region, as well as event handlers like click or hover. The map is built with SEO in mind by providing alternate content for search engine robots that are not capable of crawling JavaScript-generated content. Mapael offers a collection of maps on its own repository. Documentation and API descriptions are combined in one article, but despite this you can easily get started with this library just by reading this detailed tutorial. Conclusion According to Google Trends 3, the most popular tools for working with Maps are Leaflet, Google Maps API and Mapbox. You can see the big gap on search queries with Bing Maps API and Openlayers, these also being quite popular. Javascript Tools for mapping All the free libraries we mentioned do a good job of building interactive maps. All the APIs are capable of producing great online mapping systems, but your choice should also fit in with you or your company’s future development needs. For example, using any commercial API leaves you at the mercy of whatever changes the provider will make to the API or Terms of Service. On the other hand, using an open-source engine and the ability to switch providers anytime offers more freedom + flexibility, but it takes a lot of effort to build such systems. We believe in using the right tool for the job. Leaflet or the Google Maps API will work well for most use cases, but there are situations that call for other tools. For non-GIS background developers creating single-function mapping apps we will recommend Leaflet (now supported by MapBox). It’s small and easy to use. More functionality relies on plugins of varying quality and support. Lastly, if your maps are more design and user interaction oriented, you might want to consider using D3, a JavaScript animation library that can also do some types of mapping. Thanks for reading this, and I do hope you find the article helpful. P.S. We have also prepared a comparison table for a better view. LeafletjsOpenlayersMapboxGoogle Maps APIDatamapsJvectormapBing MapsAmcharts Map ChartKartographArcGISZeemapsAnymap by AnychartHighmaps by HighchartsCesiumPolymapsMapael Official Web-sitehttps://leafletjs.com/https://openlayers.org/https://www.mapbox.com/https://developers.google.com/maps/documentationhttps://datamaps.github.io/http://jvectormap.com/https://www.microsoft.com/en-us/maps/choose-your-bing-maps-apihttp://www.amcharts.com/javascript-maps/http://kartograph.org/https://developers.arcgis.com/https://www.zeemaps.com/https://www.anychart.com/products/anymap/overview/https://www.highcharts.com/products/highmaps/https://cesiumjs.org/http://polymaps.org/https://www.vincentbroute.fr/mapael/ GitHub stars25807, https://github.com/Leaflet/Leaflet/5517, https://github.com/openlayers/openlayers4845, https://github.com/mapbox/mapbox-gl-js-3245, https://github.com/markmarkoh/datamaps---1519, https://github.com/kartograph/kartograph.js---8999, https://github.com/highcharts/highcharts4941, https://github.com/AnalyticalGraphicsInc/cesium1533, https://github.com/simplegeo/polymaps922, https://github.com/neveldo/jQuery-Mapael PricingFreeFreeFree, starts from $4 for 1000 loadsFree, starts from $14 for 14000 loads in static mapsFreeFrom $39Free, custom (on request)Free, from $180FreeFree, from $125 monthlyFree, from $19.95 per monthFrom $79Free and paid (From $390)FreeFreeFree Map Data SourceOpenStreetMapOpenStreetMapMapboxGoogleD3.jsjVectorMapBing MapsamChartsKartographEsri-AnychartHighchartsCesiumOSM, BingRaphael.js DependenciesNoneNoneNoneNoneD3.js and TopoJSONjQueryNoneNoneKartograph.py, Raphael, and jQueryNoneNoneNonejQueryNoneNonejQuery LicenseBSD 2-Clause "Simplified" License2-Clause BSDMapbox copyrightGoogle copyrightMIT LicenseGNU GPL, paidMicrosoft copyrightAmcharts copyrightAGPL and LGPLEsri copyrightZeemaps copyrightAnycharts copyrightHighcharts copyrightApache License 2.0SimpleGeo and Stamen copyrightMIT License CategoryLibraryLibraryWeb ApplicationWeb ApplicationLibraryLibraryWeb ApplicationLibraryFrameworkFrameworkWeb ApplicationLibraryLibraryLibraryLibraryLibrary Examples/Demohttps://leafletjs.com/examples.htmlhttps://openlayers.org/en/latest/examples/https://docs.mapbox.com/mapbox-gl-js/examples/https://developers.google.com/maps/documentation/javascript/exampleshttps://datamaps.github.io/http://jvectormap.com/examples/world-gdp/https://docs.microsoft.com/en-us/bingmaps/v8-web-control/indexhttps://www.amcharts.com/demos/#mapshttp://kartograph.org/showcase/https://developers.arcgis.com/javascript/3/jssamples/https://www.zeemaps.com/mobile?group=1971477https://www.anychart.com/products/anymap/gallery/https://www.highcharts.com/maps/demohttps://cesiumjs.org/demos/http://polymaps.org/ex/https://www.vincentbroute.fr/mapael/ About Flatlogic At Flatlogic we develop admin dashboard templates and React Native templates. We are listed among Top 20 Web Development companies from Belarus and Lithuania. During the last 6 years, we have successfully completed more than 30 big projects for small startups and large enterprises. As a team, we always have a deep desire to help our clients. If you liked our blog, please read our latest posts:
0 notes
Text
Fwd: Urgent requirements for below positions.
New Post has been published on https://www.hireindian.in/fwd-urgent-requirements-for-below-positions-4/
Fwd: Urgent requirements for below positions.
We have an Urgent requirements for below positions.
Please see the job details below and let me know if you would be interested in this role.
If interested, please send me a copy of your updated resume, your contact details, your availability and a good time to connect with you.
Back End developer—–>Oakland, CA Front End developer——>Oakland, CA VMware Consultant——->Jackson, MI Senior Geospatial Solutions Front End Developer——>Washington, DC Drupal and PHP Developer——>Washington, DC TECHNICAL ARCHITECTURE SPECIALIST——>Washington, DC Sail Point Solution Design, Development, and Implementation Professional—–>Washington, DC Hadoop Lead——->Washington, DC
Job Title Location Job Description Back End developer Oakland, CA
Duration: Contract
Note: Face to Face is Must
Job Description:
BS/MS in computer science or equivalent work experience.
5+ years of experience designing and developing secure consumer-facing web applications.
Advanced level knowledge of JavaScript and Functional Programming.
2+ years of extensive experience building production application with Node.js
2+ years of Full Stack Front-End experience. Solid understanding of HTML5 and CSS3.
Proficient in building and consuming of Restful Web service, JSON based request response.
2+ years of experience working with popular JavaScript tools and Frameworks (like Gulp/npm, ejs/handlebar, Angular.js, or React/Redux or Ember). ReactJS is preferred.
Experience building responsive Single Page Web Applications.
Good understanding of design principles to build a scalable application.
Strong experience with the design and implementation of low-latency, high-availability and performant applications.
Proficient with writing unit test case using any of the testing framework like Mocha, Chai, Jasmine etc.
Proficiency with Chrome and/or other browser Developer Tools.
Proficiency with Git/Github or other distributed version control systems.
Understanding of user-centered design, progressive enhancement and graceful degradation, accessibility, SEO, responsive design, and website performance.
Experience with Scrum, Agile Process
Front End developer Oakland, CA
Duration: Contract
Experience: 8+ Years
Note: Face to Face is Must
Job Description:
8+ years of experience designing and developing secure consumer-facing web applications.
4+ years of extensive experience building production application with Node.js
4+ years of extensive experience building application using Javascript
Proficient in building and consuming of Restful Web service, JSON based request response.
Good understanding of design principles to build a scalable application.
Strong experience with the design and implementation of low-latency, high-availability and performant applications.
Experience with Deployment using Automation Tools like Bamboo etc.
Proficient with writing unit test case using any of the testing framework like Mocha, Chai, Jasmine etc.
Proficiency with Chrome and/or other browser Developer Tools.
Proficiency with Git/Github or other distributed version control systems.
Experience with Scrum, Agile Process
VMware Consultant Jackson, MI
Duration: Contract
Job Description:
Principles and Duties
Deal with Hardware vendors like IBM / HP / Dell /. Following up with Vendors hardware & software whenever required & resolve issues by minimizing downtimes.
Design, Implementation, Commissioning of ESX host platform in large customer environment
Hands on experience on ESX command line with good troubleshooting skills
Virtual Center Server management/ ESX/ESXi Patching/Health check and scripting knowledge
VMware ESX 3.5. 4.0,5.0.5.1
Base ESX Operating System Build
Knowledge on ESX servers from command line
Monitoring and Performance analysis on ESX Servers and VMs
Patching of ESX severs and VMs with VMware Update manager
Extensive Knowledge on Site Recovery Manager & VCenter Operation Manager
Should have good working knowledge of Linux and windows operating systems.
Well versed with knowledge on Snapshots.
Allocation of storage spaces to VMs through SAN
Ability to work with VSPHERE / VMware Consolidated Backup / Virtual machine backups
Operational experience for large scale virtualization environment, using vCentre for day to day management.
Strong experience with VMware HA/DRS, Update Manager, Site Recovery Manager –
Must have understanding of VizionCore Products (like vContol, vFoglight, vConverter etc.
Performance Analysis and Tuning/Optimization
Virtual machine creation, cloning, configurations
Tech handling L3 tickets
Incident management and preparation of RCA report.
Problem management.
Implementing short / long term plan.
Monitoring overall functioning of process and identify improvement areas.
Provide all necessary updating on operations as well as on primary task done by Tier 3 resource.
Actively participate in service improvement plans.
Act on Day to Day House Keeping tasks by using tools & scripts
To able to attend calls on calls basis whenever assigned
Work with Change & Problem Management Tools
Operational experience for large scale virtualization environment, using vCentre for day to day management.
Nice to Have Skills: VCP 5.0 Certification with SAN & NAS background.
System administration skills on UNIX/Linux/Windows.
Should have worked on VM block 740 series
Should have worked on EMC products
Should have worked on UCS blades
Provide operational support on a 24×7 rotation basis
Required Skills:
Should have good communication and customer interaction skills.
Global exposure in large environments would be preferred.
Should be able to drive priority issues over bridge calls providing timely updates and solutions to customer.
Must be open for 24×7 operation
MCSE / MCSA / MCP / MCITP / VCP are preferred.
Senior Geospatial Solutions Front End Developer Washington, DC
Duration: Long term
Job Description:
We are looking for a talented and energetic senior geospatial solutions front end developer to lead the development of new web GIS applications; as well as maintain current applications using the latest frameworks and technologies available to achieve desired business outcomes. Primary focus of this role will be to implement a complete user interface in the form of a mobile and desktop web app, with a focus on performance. You will work in a team with designers, back-end developer, GIS Analysts to design, develop and implement geospatial solutions.
Responsibilities
Design, develop, and support web-based geospatial applications
Incorporating interactive maps and other geospatial visualization/analysis technologies into web interfaces of existing systems, as well as creating new web-based data visualization and geospatial interfaces
Ensuring high performance on mobile and desktop
Writing tested, idiomatic, and documented JavaScript, HTML and CSS
Coordinate the workflow between the graphic designers
Support concurrent initiatives specific to infrastructure and software development
Support the installation of software components in testing and production environments
Support end-to-end project plans and ensuring timely delivery, issues escalation/reporting
Integration with external web (map) services
Integrate a diverse set of data into custom geospatial applications
Stay current on technology trends and identify ways to innovate our products
Educational Qualifications and Experience
Education: Bachelor’ degree in Computer Science, GIS or other geospatial disciplines
Role Specific Experience: 8+ years of experience as a Front-end application developer, with a heavy emphasis on front-end technologies and modern JavaScript frameworks (e.g., Angular5, Dojo, ReactJS, bootstrap etc.)
Required Skills/ Abilities
Experience with software and web development principles, concepts, and methods;
Experience with Angular 5 and Dojo is a requirement.
Creating custom, general use modules and components which extend the elements and modules of core Angular
Experience with object-relational databases (Postgre SQL or MySQL);
Web mapping API experience (ArcGIS Javascript. Leaflet, Mapbox, OpenLayers, Google Maps)
Geospatial data experience (SHP, KML, GeoJSON) as well as OGC standards (WMS, WFS)
Creating configuration, build, and test scripts for Continuous Integration environments
Proficiency with web GIS tools, particularly those used for map tiling and creating mashups/online interactive maps (Google Maps API, MapBox, OpenLayers and the Google Earth plugin);
Interest and experience in design and have artistic flair in data visualization
Must be organized and work well in a team setting. Be open to feedback from others and give honest non-judgmental feedback to others
Validating user actions on the client side and providing responsive feedback
Professional, precise communication skills
Drupal and PHP Developer Washington, DC
Duration: Long term
Job Description:
The Operational Products unit is responsible for the delivery and maintenance of IT-enabled business solutions. Our team provides IT support for the Development Economics (DEC) department for the multiple Open Data platforms and tools that are being enhanced to build a more usable, functional, and robust open data publishing, browsing, collecting system. These activities will leverage the existing work done on systems that are currently part of the Open Data platform.
Duties and Accountabilities:
Work with Drupal team to design, develop, and maintain Drupal based sites
Provide technical support and troubleshoot technical issues
Identify opportunities for process improvement, planning, and implementing changes
Provide front end development for interactive features
Stay up to date with Drupal core and module improvements, and security patches and updates to comply with the Office of Information Security accreditations.
Assist the team in developing and deploying other sites in a multi-site configuration.
Documenting current and future configuration processes and policies
Assist in debugging issues with hosting applications, cloud resources and Content Delivery Network (CDN).
Specific Requirements:
7+ years of professional enterprise level experience in Drupal including custom module development, key contributed modules, development best practices and core API
PHP, HTML, MySQL, Javascript, User Interface Design, Cascading Style Sheets
Proficiency in the maintenance and administration of Drupal modules and sites
Must be able to triage and troubleshoot tasks where appropriate to review and respond to technical challenges
Knowledge and expertise with cross browser compatibility issues (CSS, JavaScript, HTML)
Requires effective communication skills with other team members and clients
Preferred experience and familiarity with:
DKAN or any Drupal Gov distributions.
Acquia Cloud Platform and Acquia DevDesktop usage.
AWS S3 integration
Modern Javascript frame works such as React or AngularJS.
TECHNICAL ARCHITECTURE SPECIALIST Washington, DC
Duration: Long term
Job Description:
Position Overview:
The Technical Architecture Specialist is the technical expert centered on a Cloud and DevOps technology, technologies or a portfolio of Cloud hosted applications. Coordinate with other parties in setting the technical approach, direction and implementation for work.
Essential Job Functions:
Provide technical design expertise, defines cloud Specific technical requirements needed to support application migration efforts, participates in detailed design and code reviews, reviews system performance issues, adhere design to security requirements, reviews test plans, and provides technical guidance to the Application Teams across the enterprise.
Responsible for collaborating with the Team Lead(s) to coordinate project designs and validation of designs.
Work to build cloud patterns incorporating best practices, security guidelines and application performance.
Interface with Executive Sponsors, Group Leads, and Lead Functional Architects to convey infrastructure requirements, plan, and schedule deployment of tasks, and resolve any issues that impact the deployment of the Application delivery systems.
Define criteria for acceptance for the technical components of an application.
Good understanding of the DevOps process and tools.
Ensure Clients requirements are supported by the DevOps technical architecture,
Assist in development of overall system technical architecture – including software and hardware.
Analyze, determine, and document technical requirements and change request impact analysis. Participate in detailed design and product execution as required.
Manage and report time spent on all work activities.
Help Define DevOps pipeline for the application patterns and help establish the Pipeline.
Able to manage TFS build, release functions.
Educational Qualifications and Experience:
Education: Bachelor of Engineering or Masters.
Role Specific Experience: 5+ years of relevant experience in establishing cloud migration practice and supporting DevOps pipelines.
Certification Requirements:
Cloud or DevOps Certification
Required Skills/Abilities:
Ability to work in a team environment
Strong communication skills: both written and spoken
Strong experience in establishing cloud and devops Technical Requirement and able to communicate what is required.
Strong understanding of the SDLC process and Agile programming
Strong understanding of software project release automation.
Experience supporting DevOps CI/CD process.
Experience with the TFS and associated toolset.
Good understanding and troubleshooting skills for Build and scripting.
Very good experience with AWS and Azure services
Understanding of security in cloud services
Sail Point Solution Design, Development, and Implementation Professional Washington, DC
Duration: Long term
Job Description:
Position Overview:
The Design, Development, and Implementation Professional will be responsible for designing and configuring certification and Life cycle Management processes and implementing the solutions using the Provisioning Engine in SailPoint IdentityIQ (SailPoint IIQ) for Client. In addition, this resource will be responsible for designing, restructuring and developing SailPoint related processes to fine tune the application.
Essential Job Functions:
Utilize prior experience to further engineer solutions in all modules of SailPoint.
Provide necessary inputs on using OOB functionality and identify/differentiate areas where customization is required.
Leverage extensive experience in Application Owner/Role Membership/Role Composition Certification processes and customizations to support key ICFR and SOC1 compliance requirements.
Support capability development by leveraging knowledge in beanshell scripting/workflows/rules.
The resource will support ad-hoc request to develop solutions for ICAM clients, including: Necessary on-boarding of new applications, configuration changes to produce specific SailPoint IIQ solution requested by service users, and Role Mining/Role modeling to determine best way to implement Business Role/Functional Roles within ICAM.
Work with different project teams to understand their specific provisioning, access management, role management and certification needs and support them integrating their processes and applications with the available identity and access solutions.
Review all system related documentation to inform design and development decisions.
Develop, document and maintain architecture, design, and development documents required for ICAM sustainment and lifecycle management.
Develop enhancements and emergency fixes following the formal change management process.
Responsible for escalation resolution. Provide on-going knowledge transfer to tier-3 administrators, engineering support staff, team members, and clients on IAM services and standards.
Collaborates with the PMO, Business Architecture, QA team, and clients to effectively deliver solutions in-time and within budget.
Educational Qualifications and Experience:
Master’s or Bachelor’s degree(s) in Computer Science and/or Electrical Engineering. Minimum five consecutive years of computer/electrical/software engineering experience in information security and identity management fields (seven years of relevant experience required for applicants with only a Bachelor’s degree).
Nine years of experience as Security Consultant in Identity And Access Management domain
SailPoint certified trained engineer with a minimum of 4 years of experience in configuring, deploying, and maintaining SailPoint IIQ infrastructure in an enterprise setting is a must.
Minimum of 4 years of experience in Java programming.
Required Skills/Abilities:
Demonstrated experience in implementing multiple projects successfully on SailPoint IIQ; Designed and led IdentityIQ implementations
Must have hands on experience in onboarding connectors like AD, LDAP, Unix, Lotus Notes, Outlook Office365, Remedy, and other OOB connectors
Must have good exposure/hands on experience on SailPoint API.
Excellent Java programming and scripting knowledge in Linux and Windows environments is a must.
Good understanding of system software design and development methodologies and implementation experience. C++, C#, or Python programming and scripting knowledge in Linux and Windows environments is desired.
Experience troubleshooting system hardware and software, particularly to investigate problems related to device drivers provisioned by the SailPoint IIQ solution.
Good knowledge of TCP/IP networking and protocols (DNS, ICMP, SMB, SSL/TLS, etc.)
Familiarity with performance analysis using performance monitoring and tuning tools.
Strong analytical thinking skills.
Excellent interpersonal skills, including an ability to work effectively in a team/task force as a participant or team leader.
Demonstrate flexibility to work environment changes and emerging opportunities.
Ability to balance risks and reprioritize as needed.
Demonstrate continuing professional development.
Superior verbal and written communication/presentation skills in English.
Professional certifications, e.g., Certified Information Systems Security Professional (CISSP) by (ISC)2 and GIAC Certified Forensic Examiner (GCFE), or advanced information security training by educational organizations such as SANS Institute is a plus.
Hadoop Lead Washington, DC
Duration: Long term
Experience: 8+ Years
Job Description:
Must have hands on development experience in data integration area
Minimum 2 years of development experience in Hadoop platform, Spark, StreamSets and Kafka/NIFI, Java, Hive, HBase, Solr and Rest API.
Experience in leading three to four development projects
Experience in leading onsite-Offshore development model and ability to coordinate work with offshore ( India based development centers) team.
Thanks, Steve Hunt Talent Acquisition Team – North America Vinsys Information Technology Inc SBA 8(a) Certified, MBE/DBE/EDGE Certified Virginia Department of Minority Business Enterprise(SWAM) 703-594-5490 www.vinsysinfo.com
To unsubscribe from future emails or to update your email preferences click here .
0 notes