#DataDashboard
Explore tagged Tumblr posts
Visit Tumblr Blog
Explore Tumblr blogs with no restrictions, modern design and the best experience.
Last Seen Tumblr Blogs


Fun Fact
There were a total of 171.5 billion posts on Tumblr in 2019.
Text
What is Cloud Analytics? A Modern Guide to Data-Driven Decisions
In today's fast-paced digital world, data is everywhere. But collecting it isn't enough; you need to understand it. That’s where cloud analytics comes in. As a powerful evolution of traditional business intelligence, cloud analytics provides organizations with the tools and flexibility they need to gain actionable insights from vast volumes of data without the cost or complexity of legacy systems.
Whether you're a startup or an enterprise, embracing cloud analytics can transform how you operate, compete, and grow.
Understanding Cloud Analytics
Cloud analytics refers to the process of using cloud-based technologies to analyze, visualize, and interpret data. Unlike traditional analytics platforms that require on-premise infrastructure, cloud analytics tools are hosted on remote servers and accessed via the internet. This offers a scalable, cost-effective, and highly accessible way to handle large-scale data analytics workloads.
Key Characteristics of Cloud Analytics:
Scalability: Easily handle growing data volumes as your business expands.
Real-time Access: Get up-to-date insights from anywhere, at any time.
Integration: Seamlessly connect with various data sources and business intelligence platforms.
Cost-Efficiency: Reduce capital expenses associated with hardware and software licensing.
How Cloud Analytics Works
The process typically involves several components:
Data Integration – Pull data from various sources like CRMs, ERP systems, social media, or IoT devices.
Data Storage – Store data securely in cloud-based data lakes or warehouses.
Data Processing – Clean, structure, and transform raw data for analysis.
Data Visualization – Use intuitive dashboards and reports to visualize trends and KPIs.
Decision Support – Empower stakeholders with actionable insights for smarter decisions.
Modern business intelligence platforms that offer cloud analytics often include AI-driven recommendations, automation, and predictive analytics, further enhancing decision-making.
Benefits of Cloud Analytics for Businesses
Implementing cloud analytics can dramatically impact performance and innovation. Here’s how:
1. Enhanced Decision-Making
Real-time data access ensures businesses are making decisions based on current and accurate information.
2. Improved Collaboration
Teams across departments and geographies can access the same dashboards and reports, fostering cross-functional alignment.
3. Lower Operational Costs
No need for costly servers or extensive IT maintenance. Most cloud BI solutions operate on a pay-as-you-go model.
4. Faster Deployment
Unlike traditional BI systems that may take months to implement, cloud analytics tools can be set up in days or weeks.
5. Advanced Security & Compliance
Top cloud providers prioritize enterprise-grade security, data encryption, and compliance with standards like GDPR and HIPAA.
Choosing the Right Cloud Analytics Platform
When evaluating a business intelligence platform with cloud capabilities, consider:
Data source compatibility
Ease of use
Customization and flexibility
Security features
Support and training availability
Popular solutions in the market offer comprehensive analytics ecosystems, supporting everything from simple data queries to complex predictive modeling all in the cloud.
Real-World Use Cases of Cloud Analytics
Businesses across industries are adopting cloud analytics to:
Optimize marketing campaigns with real-time performance data
Monitor supply chains and logistics with IoT integration
Detect fraud using advanced data modeling
Forecast sales trends using predictive analytics
Whether in healthcare, retail, finance, or manufacturing, the benefits of cloud-based business intelligence are becoming essential to staying competitive.
Final Thoughts
In a world where data is the new currency, cloud analytics offers the most agile, scalable, and cost-effective path to data-driven success. By leveraging the power of the cloud, businesses can make smarter decisions, enhance operational efficiency, and uncover new growth opportunities.
If your organization is ready to embrace modern business intelligence and data analytics, moving to a cloud analytics solution might just be your smartest move yet.
0 notes
Text
Unlock data insights with Prishusoft's custom dashboards
Improve decision-making, optimize resources, and get real-time insights to drive your business forward.
0 notes
Text

Tap into real-time data visualizations with VADY’s intuitive AI platform. Whether you're a C-level exec or a startup founder, VADY makes AI-powered data analytics accessible, interactive, and insight-rich. Business intelligence, simplified.
#VADY#NewFangled#RealTimeDataVisualization#AIpoweredBusinessIntelligence#DataAnalyticsForBusiness#ConversationalAnalyticsPlatform#BusinessIntelligencePlatform#VADYBusinessIntelligence#VADYAIAnalytics#SmartDecisionMakingTools#InteractiveDataTools#RealtimeAnalytics#VADYDataAnalyticsSolutions#EnterpriseAISolutions#DataDashboards#VisualizeWithAI#AIPoweredDashboards#BusinessInsights#SimpleAnalytics#AIForAll
0 notes
Text
" Mastering DAX: Unlocking the Power of Advanced Data Analytics "
" Mastering DAX: Unlocking the Power of Advanced Data Analytics "
https://www.udemy.com/course/pl-300-microsoft-power-bi-data-analyst-certification-2024/?couponCode=7B13AB8EAC2516DC7634
Are you ready to transform raw data into actionable insights?
🚀 Join our Microsoft Power BI Course and gain the skills you need to create stunning, interactive dashboards and reports that drive smarter business decisions.
💡 What You’ll Learn:
✅ Master the Power BI interface and tools ✅ Connect and transform data from multiple sources ✅ Build visually compelling dashboards and reports ✅ Use DAX to perform advanced calculations ✅ Share and collaborate on insights in the Power BI service
🎯 Who Should Enroll?
This course is perfect for:
Aspiring data analysts Business professionals seeking data-driven decision-making skills Students and graduates wanting to boost their resumes
📅 Course Details:
Duration: 2 Hours Mode: Online/In-person Start Date: Anytime
🔥 Why Choose Us?
Expert trainers with real-world experience Help for real certification exam.
📌 Reserve Your Spot Now! Transform your career and become a data visualization expert. 💼
��� PL-300: Microsoft Power BI Practice Test - 2024 (Practice only no certification)
Don’t wait—spaces are filling fast!
📊 #PowerBI #DataAnalytics #BusinessIntelligence #PowerBITraining #MicrosoftPowerBI #DataVisualization #BusinessIntelligence #DataAnalytics #DataDriven #BItools #Analytics #DataScience #DataInsights #PowerBIReports #DataStorytelling #DataDashboards #VisualizeData #PowerBICommunity #DataEngineer #SelfServiceBI #DataAnalysis #BusinessAnalytics #DashboardDesign #DataReporting #DataVisualizationTools #DataStrategy #DataVisualizationDesign #PowerBIDesktop #PowerBIDashboards #PowerBITraining #DataVisualizationTips #DataCulture #AdvancedAnalytics #DataManagement #PowerBIDeveloper #InteractiveData #BIAnalytics #PowerBIExperts #MicrosoftBI #DataDrivenDecisions #AIAndBI #DataIntegration #PowerBIPro #BusinessData #DataExploration #TechWithData #PowerBIProjects #DataPerformance #DataWithPowerBI #BIConsulting #PowerBIDevelopment #DynamicData #RealTimeBI #BIVisualization #CustomDashboards #DataAutomation #PowerPlatform #ModernBI #DataJourney #TechForBusiness #BIForBusiness
0 notes
Photo
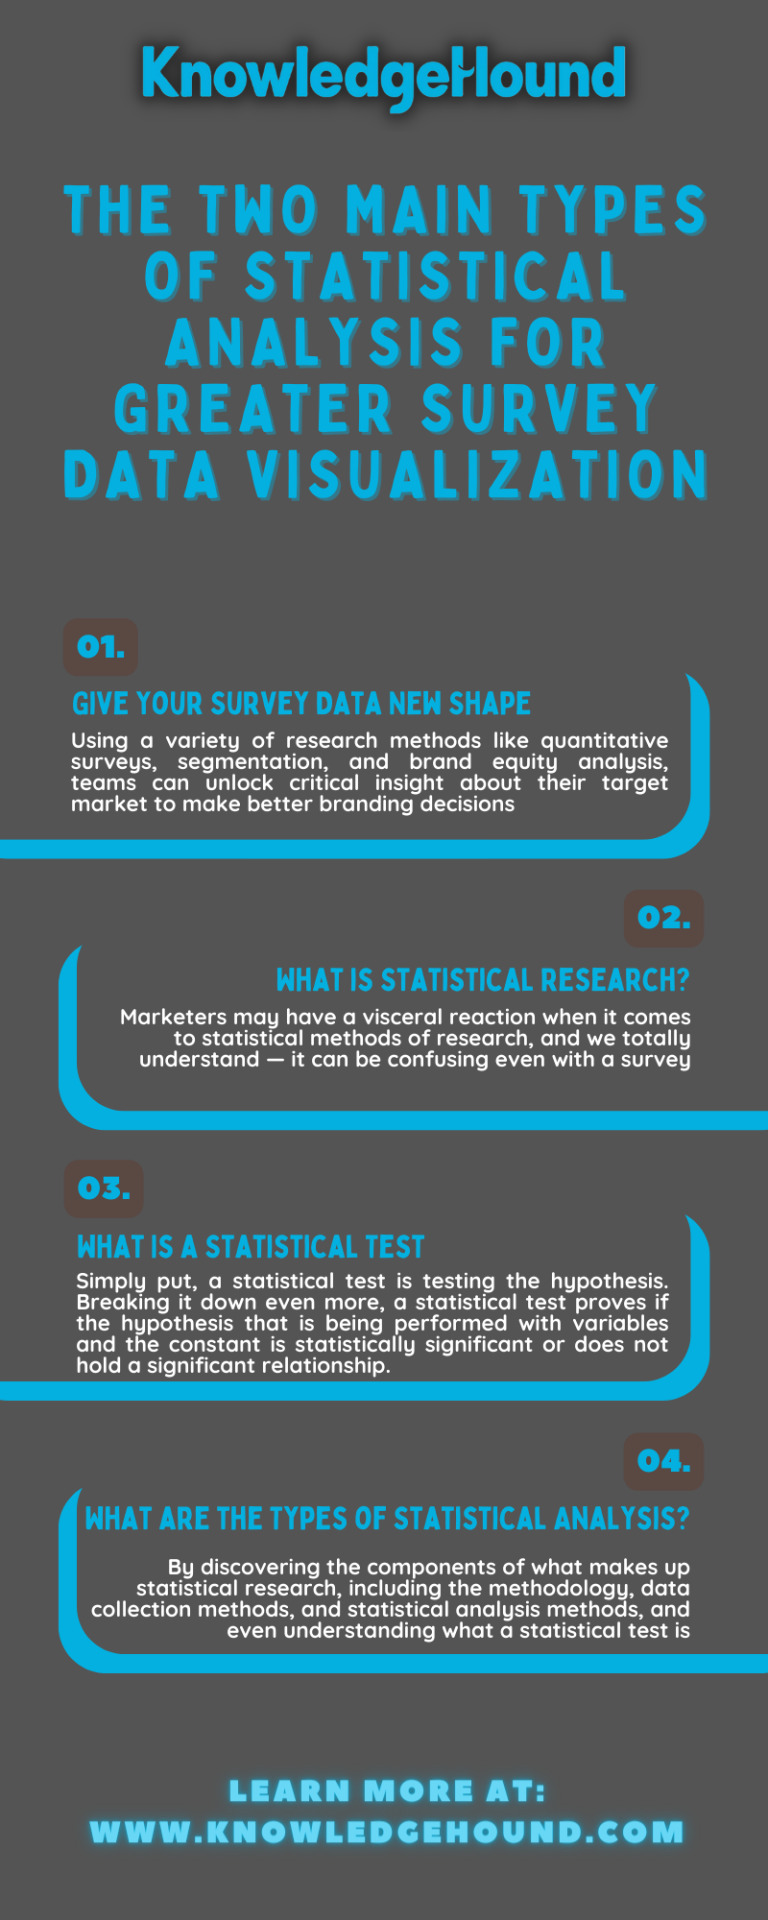
Gain a greater understanding of statistical tools for data analysis, the data experts at KnowledgeHound explain the two types of statistical analysis. Describing the different types of statistical analysis and educate users about KH's ability to automate some of these processes.
#datavisualization#structureddata#datamanagement#datavisualizationtool#databasemanagement#databaseaccess#dataaccess#primarydata#datadashboard#consumerinsights#datasharing
0 notes
Link
How Are Data Dashboards Useful in Business? Learn how data dashboards are used by businesses to track and monitor performance. Understand what type of data is collected and see examples of how data dashboard usage has impacted business growth.
0 notes
Link
An efficient data dashboard helps to improvise the presentation of your data. The challenge is to make your representations as simple to read and comprehend as possible.
0 notes
Photo

WEDNESDAY, JANUARY 27: Insight from data has made an impactful difference in Hawaii’s response to COVID. Learn how data, data visualizations, and data integration with other system increases decision making value. You can create and foster a data culture at your organization! https://www.hawaiical.com/event/tableau-in-hawaii/ #tableau #datadashboards #datavisualization #dataviz @htdcorg @sandbox.hawaii @hawaiiexecutivecollaborative (at Entrepreneurs Sandbox) https://www.instagram.com/p/CJ0HvhUDT9v/?igshid=hku8l12y0vy6
0 notes
Text
I’m looking at the coronavirus statistics for Washington state where I live & I just found out that in Washington state nearly 39% of all coronavirus cases are in people between the ages of 20 and 39.
What this says to me Is that young adults are not taking this as seriously as they should. It’s possible that this is the largest age group in Washington and that’s why the cases are higher but it’s also excellent evidence that despite what the media tells you, young adults ARE affected by this virus and we need to be taking the SAME precautions we insist our older family and friends take.
This is a dangerous deadly disease the long term effects of which are a complete unknown.
Protect yourself, wear a mask, wash your hands, stay home whenever possible!
https://www.doh.wa.gov/Emergencies/NovelCoronavirusOutbreak2020COVID19/DataDashboard
1 note
·
View note
Photo

Corona Virus Stats https://www.doh.wa.gov/Emergencies/NovelCoronavirusOutbreak2020COVID19/DataDashboard
1 note
·
View note
Link
#datavisualization#structureddata#datamanagement#datavisualizationtool#databasemanagement#databaseaccess#dataaccess#primarydata#datadashboard#consumerinsights#KnowledgeHound
0 notes
Photo

Top 4 Data Analytics Tools http://ehelpdesk.tk/wp-content/uploads/2020/02/logo-header.png [ad_1] TOP 4 DATA ANALYTICS TOOLS //Dat... #analysistools #analyticstools #bigdata #bigdataanalyticstools #businessintelligence #charts #code #coding #dashboard #data #dataanalysis #dataanalyst #dataanalysttools #dataanalytics #dataanalyticstools #datacharts #datadashboard #dataengineer #datamodeling #datascience #datascientist #datascientisttools #datatools #datavisualization #excel #exceldashboard #excelformulas #excelfunctions #excelmacros #excelvba #graphics #machinelearning #microsoftaccess #microsoftoffice #microsoftoffice365 #microsoftpowerbi #microsoftproject #microsoftword #officeproductivity #pivottables #powerpivot #powerpoint #programming #python #pythonprogramming #pythonvsr #rvspython #sap #sas #sasprogramming #statistics
0 notes
Photo

Woensdag 28 februari – Schets van het idee doughnut dashboard. Het idee is in de basis eenvoudig: De donut van Kate Raworth is een data representatie. De buitenring toont op negen indicatoren hoe een bepaalde entiteit scoort ten aanzien van de ecologische bovengrens (daarboven spreek je van ‘overshoot’). De binnenste ring toont op twaalf indicatoren hoe een bepaalde entiteit scoort ten aanzien van de sociale ondergrens (daaronder spreek je van ‘shortfall’). De score op een indicator moet je kunnen meten en daar heb je data voor nodig.
Waar landen hun succes nu primair meten aan de hand van (groei van) bruto nationaal product zou je willen dat landen (maar net zo goed huishoudens als steden of regio’s – en uiteindelijk vooral de hele wereld) hun succes meten op de éénentwintig indicatoren van de donut. We moeten immers met z’n allen binnen de donut zien te blijven, anders gaat het mis met de mensheid.
Het idee doughnut dashboard is eenvoudig: als de donut in essentie een data-representatie is, laten we dan zorgen dat er donut-data-dashboards komen die mensen helpen hun activiteiten af te stemmen op de grenzen van de donut. Wat mij betreft is het doel dat donut-data-dashboards voor alle mensen de norm is, op alle schaalniveau’s. De ontwerp- of onderzoeksvraag is dan: Hoe bereiken we die situatie zo snel mogelijk. Daar gaat de zeer prille schets over.
0 notes