#DataDrivenPlanning
Explore tagged Tumblr posts
Visit Tumblr Blog
Explore Tumblr blogs with no restrictions, modern design and the best experience.
Last Seen Tumblr Blogs


Fun Fact
Premium Tumblr themes are available from anywhere between $9 to $49.
Text
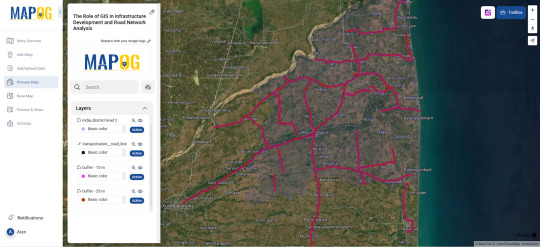
A GIS-Based Approach to Infrastructure and Road Network Planning
Geographic Information Systems (GIS) offer a powerful platform for infrastructure development by enabling detailed spatial analysis, route optimization, and long-term urban planning. Through advanced mapping, terrain modeling, and data integration, GIS improves the efficiency, sustainability, and connectivity of transportation systems.
Why Use GIS for Infrastructure and Road Network Development? GIS provides planners and engineers with accurate, data-driven insights into land use, topography, and population density. It reduces development costs, enhances route planning, and ensures infrastructure aligns with environmental and social needs. This approach also supports transparent decision-making and continuous project monitoring.

GIS in Road Network Analysis Supports:
Spatial Planning: Analyzing terrain and land cover to determine optimal routes and avoid natural obstacles.
Traffic Flow Analysis: Using temporal traffic data to identify bottlenecks and improve route efficiency.
Environmental Assessment: Minimizing environmental impact by avoiding sensitive zones during construction planning.
Infrastructure Lifecycle Management: Enabling long-term monitoring and maintenance scheduling of road networks.
Using GIS for Infrastructure Mapping Includes:
Uploading and styling road and terrain layers.
Using elevation and slope data to design roads in complex topography.
Buffering critical areas (e.g., schools, rivers) for risk-aware planning.
Integrating socio-economic datasets for inclusive infrastructure design.
Procedure for Infrastructure Mapping and Road Network Analysis Using GIS
Road network analysis using GIS begins with acquiring and preparing data on traffic, fuel consumption, emissions, and environmental conditions. Administrative boundaries and road network layers are added and styled for better visualization. Buffer zones are created around current and proposed highways to assess impact areas. Spatial joins integrate land ownership, zoning, and environmental data. A multi-criteria analysis is then conducted to identify the most suitable road alignment. The results are compiled into a geospatial report for informed planning and stakeholder input.
Use Case: Urban Expansion and Road ConnectivityGIS helps urban planners overlay demographic data with existing transport networks to identify underserved areas and prioritize road expansions, promoting equitable access, economic growth, and reduced congestion.
Open-source GIS Mapping for Road Networks Open-source tools like MAPOG enable detailed, multi-layered infrastructure mapping with features like route tracking, real-time updates, and spatial analysis. These platforms empower planners to build smarter cities with sustainable mobility systems and increased public engagement.
Conclusion Buffer zones and route analytics improve the precision of infrastructure projects. When used effectively, GIS supports proactive planning, better transport access, and reduced development risks across urban and rural areas.
#InfrastructureMapping#RoadNetworkPlanning#UrbanMobility#GISinInfrastructure#GeospatialTech#SmartCities#SmartMapping#DataDrivenPlanning#TransportationInnovation
1 note
·
View note
Text
Digital Twin Technology for Urban Planning Market to Reach $12.7B by 2033, Growing from $2.5B in 2023 with 17.4% CAGR
Digital Twin for Urban Planning Market : Digital twin technology is revolutionizing urban planning by creating real-time, dynamic simulations of cities and infrastructure. Through the use of sensors, IoT devices, and advanced modeling software, digital twins replicate the physical world in a virtual environment, allowing planners to analyze and predict the effects of various changes in urban environments. This innovation allows city officials to optimize traffic flow, improve waste management, and enhance public services by simulating scenarios before they are executed in real life. The ability to visualize entire cityscapes as virtual models also helps with long-term urban development and sustainable resource management, ensuring that cities can grow efficiently and smartly.
To Request Sample Report : https://www.globalinsightservices.com/request-sample/?id=GIS32598 &utm_source=SnehaPatil&utm_medium=Article
By providing actionable insights, digital twins are empowering smarter decision-making processes. Urban planners can assess the impact of new buildings, infrastructure projects, and environmental factors, enabling them to mitigate potential challenges such as congestion or resource shortages. With continuous data integration, digital twins also adapt to ongoing changes, ensuring that urban development remains aligned with evolving population needs and climate considerations. As more cities adopt this technology, digital twins are becoming a cornerstone of smart cities, making urban spaces more connected, efficient, and sustainable.
#DigitalTwin #UrbanPlanning #SmartCities #FutureOfCities #SustainableUrbanDevelopment #IoTForCities #CitySimulations #UrbanInnovation #SmartInfrastructure #DataDrivenPlanning #TechForUrbanDevelopment #CityManagement
0 notes
Text
Flood Risk Mapping Using Interactive Web Maps: A SaaS Platform Approach

An interactive SaaS-based online map-based method for mapping flood risk. Real-time data visualization, risk analysis, and decision-making support are all made easier by the platform. Through the use of cloud computing and geospatial tools, it enhances accessibility and collaboration in flood risk management for planners, governments, and communities.
For Flood Risk Mapping, Why Use an Interactive Web Map-Based Software as a Service Platform?
Without the need for complex infrastructure, SaaS systems provide scalable, reasonably priced flood risk mapping solutions that enable users to view data, assess risks remotely, and collaborate to enhance decision-making, prepare for emergencies, and ensure continuous updates.
A SaaS Platform Approach to GIS Applications for Interactive Web Maps in Flood Risk Mapping
Using a SaaS platform to map flood risk requires Geographic Information Systems (GIS) since they enable:
The process of combining hydrological, topographical, and meteorological data for in-depth analysis is known as data integration.
The practice of using spatial trends to identify persons and regions at risk is known as risk assessment.
Decision Support: Giving planners and emergency responders useful information.
Public Engagement: Developing user-friendly interfaces to assist communities in understanding the risks associated with flooding.
Using Interactive Web Maps to Map Flood Risk:
The three primary applications of interactive web maps for mapping flood risk are as follows:
Aids in emergency response planning: identifying high-risk areas, devising efficient evacuation routes, and resource allocation.
Supports engineers in developing resilient infrastructure and zoning laws in flood-prone areas.
Encourages community involvement and public awareness: providing easily understandable flood risk information.
Flood Risk Map Generation with Interactive Web Maps
This technique explains how to use an interactive online map SaaS platform to generate flood risk maps.
Create a hybrid basemap with unique river and border layers.
Create buffer zones around rivers to show flood affected areas.
Style each layer for clarity.
Deliver scalable, real-time analysis in flood-prone locations.
Improve public awareness, emergency planning, and informed decision-making.
UseCase: Urban Planning and Infrastructure Resilience – Flood risk maps inform land-use planning by overlaying floodplain data with zoning and infrastructure layers, enabling planners to design resilient urban systems, enforce building codes, and mitigate future flood impacts through strategic development.
Open-source web application for making maps
Open-source tools like MAPOG are reshaping flood risk management by offering interactive online maps powered by dynamic mapping, cloud access, and strong data analytics. This flexible platform supports preparedness, strengthens communities, and enables faster emergency response. With intuitive buffer tools, users can easily create clear, impactful flood maps for planning and analysis.
Conclusion
Buffer distances provide a clear way to visualize proximity and risk. When applied correctly, they support better planning, safety assessments, and environmental decision-making in various fields like urban development or disaster response.
#FloodRiskMapping#SmartMapping#DisasterPreparedness#SaaSMapping#GeospatialTech#InteractiveMaps#MAPOG#ClimateResilience#EmergencyResponse#DataDrivenPlanning#UrbanResilience#FloodAwareness
0 notes