#GeospatialTech
Explore tagged Tumblr posts
Visit Tumblr Blog
Explore Tumblr blogs with no restrictions, modern design and the best experience.
Last Seen Tumblr Blogs


Fun Fact
Tumblr Inc. has $15.1M in annual revenue.
Text
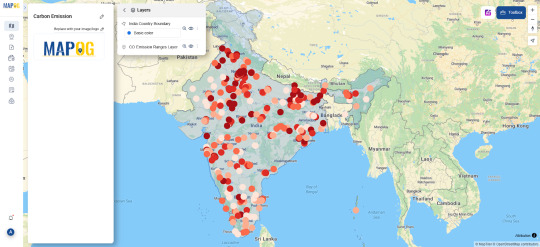
Monitoring Climate Change and Its Impact: The Power of GIS

GIS plays a vital role in monitoring climate change by transforming environmental data into visual insights, helping researchers, planners, and communities understand impacts, track changes, and make informed decisions.
Why GIS Matters in Climate Monitoring
GIS transforms satellite and environmental data into visual, interactive maps—giving scientists, planners, and communities the tools to:
Monitor Deforestation: Track forest loss and land use change using multi-temporal imagery.
Observe Glacial Retreat & Sea-Level Rise: Detect shrinking ice caps, rising coastlines, and erosion hotspots.
Map Urban Heat Islands: Analyze temperature patterns to plan greener, cooler cities.
These aren’t just data points—they're living maps that help us make smarter, faster decisions.
How It Works: A Simple Workflow
To create a carbon emissions map, start by gathering key data—such as pollutant levels and monitoring station locations. Import boundary layers and adjust their opacity for better visual clarity. Upload or enter your data, ensuring coordinates are accurately mapped. Use the Bubble tool to display the “Pollution average” across five data categories, setting a radius of 12 and choosing an appropriate color scheme. Customize the map’s layers and styles to improve readability. Once complete, analyze the map for meaningful insights and share it to help raise awareness and support informed environmental action.
Use Case: Mapping Methane Emissions from Permafrost Thaw
GIS is used to monitor and model methane release from thawing permafrost in Arctic regions. By integrating satellite imagery, soil temperature data, and terrain models, GIS helps researchers visualize methane hotspots, track emission trends, and predict future climate feedback loops—an uncommon but critical application in climate science.
Conclusion
GIS turns climate data into meaningful insights, helping us monitor environmental changes, design resilient infrastructure, and involve communities in climate solutions. Its ability to visualize and interpret change makes it an essential tool in tackling the climate crisis.
Open Tools Make It Easier
Exploring your community’s climate challenges? Cutting‑edge GIS solutions like MAPOG bring powerful capabilities—buffer analysis, multi‑layer overlays, and intuitive map‑building—to everyone from urban planners to grassroots activists. You can turn complex environmental data into clear, actionable visualizations that inform decision‑making and spark local engagement.
Have you tried using a chart of climate impacts where you live? Share your insights or questions below!
#ClimateMapping#SmartMapping#GISforClimate#GeospatialTech#EnvironmentalMonitoring#ClimateResilience#MAPOG#SustainabilityTech#DataDrivenClimateAction#InteractiveMaps#EarthObservation#ClimateScience#AdaptationStrategies
0 notes
Text
Become a ArcGIS/ArcMap Pro – GIS Mapping & Analysis Course
Take your GIS skills to the next level with this ArcGIS/ArcMap Udemy course! 📊 Learn geospatial data processing, automation & visualization like a pro.
🚀 ONLY 7.69 USD from 14.8 USD (48% OFF)!
#AdvancedGIS#ArcGISArcMapPro#GISMappingSkills#SpatialData#GeospatialTech#ArcGISArcMapExperts#GISVisualization#Geoprocessing#CartographySkills#UdemyDiscount
0 notes
Text
Want to go from ArcGIS Pro 3 beginner to expert?
English Video tutorial, just FOR $9.99 (NORMAL price $19.9). Get it once and you will get endless access right.
🎯 This comprehensive guide teaches you essential GIS skills, including data visualization, spatial analysis, and map creation. Perfect for anyone looking to level up their GIS expertise with hands-on learning!
📌 Don't forget to like & subscribe for more GIS content!
0 notes
Text
The surveying and mapping market plays a pivotal role in capturing, analyzing, and visualizing geospatial data. It encompasses technologies like GPS, LiDAR, and GIS, driving applications in urban planning, construction, agriculture, and disaster management. With a growing demand for accurate spatial information, the market is evolving rapidly, offering diverse solutions and services to meet the needs of industries worldwide.
0 notes
Text
Shaping Smarter Urban Environments Through Geospatial Digital Twins
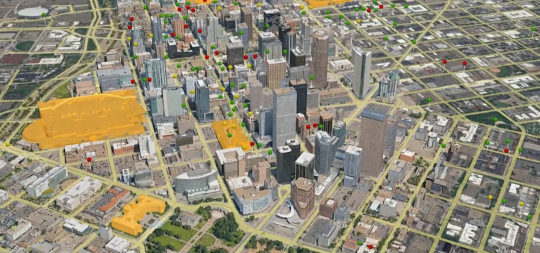
🌇Ready to Dive into the Future of Urban Planning? Explore how Geospatial Digital Twins are Transforming Cities! 🌍 Discover how GIS data integration is shaping smarter urban environments. Read the article to learn more! 🏙️ https://lnkd.in/gss4-9bB
0 notes
Text
Autonomous Drone Inspections Market to Soar to $12.5B by 2034 ✨
Autonomous Drone Inspections Market is projected to grow from $4.2 billion in 2024 to $12.5 billion by 2034, at a CAGR of 11.5%. These AI-powered UAVs are transforming infrastructure, energy, agriculture, and industrial inspections, enhancing safety, efficiency, and cost-effectiveness.
To Request Sample Report: https://www.globalinsightservices.com/request-sample/?id=GIS10849 &utm_source=SnehaPatil&utm_medium=Article
Key Market Drivers 🚀
✅ Growing demand for automated infrastructure and energy inspections ✅ Advancements in AI, LiDAR, and computer vision ✅ Increased regulatory support for drone deployment ✅ Expanding smart city and industrial automation initiatives
Top Market Segments & Regional Insights 🌍
🔹 Leading Segments:
Energy & Utilities (45%) — Drones inspect power lines, solar panels, and wind turbines
Infrastructure (30%) — Enhanced monitoring of bridges, buildings, and railways
Agriculture (25%) — Precision farming & crop health assessments
🌎 Regional Breakdown:
North America leads, driven by R&D and regulatory backing
Europe follows, fueled by strict safety laws & smart city growth
The U.S. & Germany are at the forefront of adoption & innovation
Market Outlook & Key Players 🏆
By 2028, market volume is expected to rise from 2.5 million to 5 million units, with DJI, Parrot SA, and AeroVironment leading the way. These companies are pioneering AI-driven automation and real-time data analytics, shaping the future of drone-based inspections.
#AutonomousDrones #DroneInspections #AI #MachineLearning #LiDAR #InfrastructureMonitoring #UAVs #SmartCities #ConstructionTech #EnergyTech #IndustrialAutomation #RemoteSensing #AerialInspection #GeospatialTech #FutureTech #TechInnovation #DronesInEnergy #IoT #DigitalTransformation #Surveying #GIS #DaaS #SmartInfrastructure #CloudComputing #SafetyTech #DataAnalytics
0 notes
Text
Become a ArcGIS/ArcMap Pro – GIS Mapping & Analysis Course
Take your GIS skills to the next level with this ArcGIS/ArcMap Udemy course! 📊 Learn geospatial data processing, automation & visualization like a pro.
🚀 ONLY 7.69 USD from 14.8 USD (48% OFF)!
#AdvancedGIS#ArcGISArcMapPro#GISMappingSkills#SpatialData#GeospatialTech#ArcGISArcMapExperts#GISVisualization#Geoprocessing#CartographySkills#UdemyDiscount
0 notes
Text
Become a ArcGIS/ArcMap Pro – GIS Mapping & Analysis Course
Take your GIS skills to the next level with this ArcGIS/ArcMap Udemy course! 📊 Learn geospatial data processing, automation & visualization like a pro. 🚀 ONLY 7.69 USD from 14.8 USD (48% OFF)! 👉
#AdvancedGIS#ArcGISArcMapPro#GISMappingSkills#SpatialData#GeospatialTech#ArcGISArcMapExperts#GISVisualization#Geoprocessing#CartographySkills#UdemyDiscount
0 notes
Text
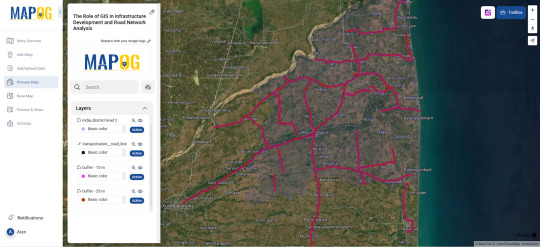
A GIS-Based Approach to Infrastructure and Road Network Planning
Geographic Information Systems (GIS) offer a powerful platform for infrastructure development by enabling detailed spatial analysis, route optimization, and long-term urban planning. Through advanced mapping, terrain modeling, and data integration, GIS improves the efficiency, sustainability, and connectivity of transportation systems.
Why Use GIS for Infrastructure and Road Network Development? GIS provides planners and engineers with accurate, data-driven insights into land use, topography, and population density. It reduces development costs, enhances route planning, and ensures infrastructure aligns with environmental and social needs. This approach also supports transparent decision-making and continuous project monitoring.

GIS in Road Network Analysis Supports:
Spatial Planning: Analyzing terrain and land cover to determine optimal routes and avoid natural obstacles.
Traffic Flow Analysis: Using temporal traffic data to identify bottlenecks and improve route efficiency.
Environmental Assessment: Minimizing environmental impact by avoiding sensitive zones during construction planning.
Infrastructure Lifecycle Management: Enabling long-term monitoring and maintenance scheduling of road networks.
Using GIS for Infrastructure Mapping Includes:
Uploading and styling road and terrain layers.
Using elevation and slope data to design roads in complex topography.
Buffering critical areas (e.g., schools, rivers) for risk-aware planning.
Integrating socio-economic datasets for inclusive infrastructure design.
Procedure for Infrastructure Mapping and Road Network Analysis Using GIS
Road network analysis using GIS begins with acquiring and preparing data on traffic, fuel consumption, emissions, and environmental conditions. Administrative boundaries and road network layers are added and styled for better visualization. Buffer zones are created around current and proposed highways to assess impact areas. Spatial joins integrate land ownership, zoning, and environmental data. A multi-criteria analysis is then conducted to identify the most suitable road alignment. The results are compiled into a geospatial report for informed planning and stakeholder input.
Use Case: Urban Expansion and Road ConnectivityGIS helps urban planners overlay demographic data with existing transport networks to identify underserved areas and prioritize road expansions, promoting equitable access, economic growth, and reduced congestion.
Open-source GIS Mapping for Road Networks Open-source tools like MAPOG enable detailed, multi-layered infrastructure mapping with features like route tracking, real-time updates, and spatial analysis. These platforms empower planners to build smarter cities with sustainable mobility systems and increased public engagement.
Conclusion Buffer zones and route analytics improve the precision of infrastructure projects. When used effectively, GIS supports proactive planning, better transport access, and reduced development risks across urban and rural areas.
#InfrastructureMapping#RoadNetworkPlanning#UrbanMobility#GISinInfrastructure#GeospatialTech#SmartCities#SmartMapping#DataDrivenPlanning#TransportationInnovation
0 notes
Text
Flood Risk Mapping Using Interactive Web Maps: A SaaS Platform Approach

An interactive SaaS-based online map-based method for mapping flood risk. Real-time data visualization, risk analysis, and decision-making support are all made easier by the platform. Through the use of cloud computing and geospatial tools, it enhances accessibility and collaboration in flood risk management for planners, governments, and communities.
For Flood Risk Mapping, Why Use an Interactive Web Map-Based Software as a Service Platform?
Without the need for complex infrastructure, SaaS systems provide scalable, reasonably priced flood risk mapping solutions that enable users to view data, assess risks remotely, and collaborate to enhance decision-making, prepare for emergencies, and ensure continuous updates.
A SaaS Platform Approach to GIS Applications for Interactive Web Maps in Flood Risk Mapping
Using a SaaS platform to map flood risk requires Geographic Information Systems (GIS) since they enable:
The process of combining hydrological, topographical, and meteorological data for in-depth analysis is known as data integration.
The practice of using spatial trends to identify persons and regions at risk is known as risk assessment.
Decision Support: Giving planners and emergency responders useful information.
Public Engagement: Developing user-friendly interfaces to assist communities in understanding the risks associated with flooding.
Using Interactive Web Maps to Map Flood Risk:
The three primary applications of interactive web maps for mapping flood risk are as follows:
Aids in emergency response planning: identifying high-risk areas, devising efficient evacuation routes, and resource allocation.
Supports engineers in developing resilient infrastructure and zoning laws in flood-prone areas.
Encourages community involvement and public awareness: providing easily understandable flood risk information.
Flood Risk Map Generation with Interactive Web Maps
This technique explains how to use an interactive online map SaaS platform to generate flood risk maps.
Create a hybrid basemap with unique river and border layers.
Create buffer zones around rivers to show flood affected areas.
Style each layer for clarity.
Deliver scalable, real-time analysis in flood-prone locations.
Improve public awareness, emergency planning, and informed decision-making.
UseCase: Urban Planning and Infrastructure Resilience – Flood risk maps inform land-use planning by overlaying floodplain data with zoning and infrastructure layers, enabling planners to design resilient urban systems, enforce building codes, and mitigate future flood impacts through strategic development.
Open-source web application for making maps
Open-source tools like MAPOG are reshaping flood risk management by offering interactive online maps powered by dynamic mapping, cloud access, and strong data analytics. This flexible platform supports preparedness, strengthens communities, and enables faster emergency response. With intuitive buffer tools, users can easily create clear, impactful flood maps for planning and analysis.
Conclusion
Buffer distances provide a clear way to visualize proximity and risk. When applied correctly, they support better planning, safety assessments, and environmental decision-making in various fields like urban development or disaster response.
#FloodRiskMapping#SmartMapping#DisasterPreparedness#SaaSMapping#GeospatialTech#InteractiveMaps#MAPOG#ClimateResilience#EmergencyResponse#DataDrivenPlanning#UrbanResilience#FloodAwareness
0 notes
Text
QGIS 3 for Mapping Enthusiasts – Learn on Udemy Today!
🗺️ Love mapping? This QGIS 3 course on Udemy is for you.
Get 48% OFF and enroll for just $12.99. Offer ends soon – start learning now!
👉
#QGIS3#MappingEnthusiasts#UdemyDeal#GeospatialTech#LearnGIS#UdemySpecial#TechLearning#GISCommunity#MappingSkills#UdemyOffer
0 notes
Text
QGIS 3 Mastery – Enroll on Udemy and Save 48%!
🎓 Achieve QGIS 3 mastery with this Udemy course.
Get 48% OFF and enroll for just $12.99.
Perfect for all skill levels. Offer ends soon – act now! 👉
#QGIS3#GISMastery#UdemyDeal#GeospatialTech#LearnGIS#UdemySpecial#TechLearning#GISCommunity#MappingSkills#UdemyOffer
0 notes
Text
Become a QGIS 3 Pro – Enroll on Udemy and Save 48%!
📊 Ready to become a QGIS 3 pro? This Udemy course has you covered.
Get 48% OFF and enroll for just $12.99. Offer ends soon – start learning today!
👉 Sign Up Now
#QGIS3#GISPro#UdemyDeal#GeospatialTech#LearnMapping#UdemySpecial#TechLearning#GISCommunity#MappingMastery#UdemyOffer
0 notes
Text

"Master QGIS 3 in No Time – Udemy Course at 48% OFF!" ⏳ Time is running out to master QGIS 3! Enroll in this Udemy course and
SAVE 48% – only $12.99. Perfect for beginners and pros alike. Don’t wait – offer ends soon!
👉 Sign Up Now:
#QGIS3#UdemyCourse#GISMastery#GeospatialTech#LearnMapping#UdemyDiscount#GISForAll#TechEducation#MappingSkills#SaveBig
0 notes
Text
"Master QGIS 3 in No Time – Udemy Course at 48% OFF!"
⏳ Time is running out to master QGIS 3!
Enroll in this Udemy course and save 48% – only $12.99. Perfect for beginners and pros alike. Don’t wait – offer ends soon!
👉 Sign Up Now:
#QGIS3#UdemyCourse#GISMastery#GeospatialTech#LearnMapping#UdemyDiscount#GISForAll#TechEducation#MappingSkills#SaveBig
0 notes
Text
Become a QGIS 3 Pro – GIS Mapping & Analysis Course! Take your GIS skills to the next level with this QGIS 3 Udemy course! 📊 Learn geospatial data processing, automation & visualization like a pro.
🚀 ONLY $12.99 from $19.99 (48% off)!
#AdvancedGIS#QGISPro#GISMappingSkills#SpatialData#GeospatialTech#QGISExperts#GISVisualization#Geoprocessing#CartographySkills#UdemyDiscount
0 notes