#DataVisualization 📈
Explore tagged Tumblr posts
Visit Tumblr Blog
Explore Tumblr blogs with no restrictions, modern design and the best experience.
Last Seen Tumblr Blogs


Fun Fact
Tumblr.com is the 103rd most visited website in the world.
Text

Deploying a Project Using Power BI Pro 🚀
Power BI Pro allows you to share, collaborate, and manage Power BI reports securely within an organization. Here's how you can deploy a project using Power BI Pro:
1️⃣ Prepare & Publish the Report
Develop your Power BI report in Power BI Desktop.
Connect to data sources, clean data, and create interactive visualizations.
Click "Publish" and select your Power BI workspace.
2️⃣ Configure Data Refresh & Security
Set up scheduled refresh to keep reports updated.
Use Data Gateway for on-premises data sources.
Configure Row-Level Security (RLS) to restrict data access.
3️⃣ Share & Collaborate
Share reports within your organization using Power BI Pro licensing.
Create and distribute Power BI Apps for easy access.
Embed reports in Microsoft Teams, SharePoint, or web applications.
4️⃣ Monitor & Optimize
Track usage and performance through the Power BI Admin Portal.
Optimize report performance using Performance Analyzer.
Manage permissions and data governance policies.
���� Power BI Pro ensures seamless collaboration, secure sharing, and efficient data-driven decision-making! 🚀
For Free Power BI Tutorial Visit-https://www.tpointtech.com/power-bi
#PowerBI 📊#PowerBIPro 🚀#DataAnalytics 📈#BusinessIntelligence 💡#DataVisualization 🎨#PowerBIReports 📑#MicrosoftPowerBI 🔥
1 note
·
View note
Text
Bubblemaps and TON Enhance Transparency for Telegram Blockchain 🚀💎
Have you ever felt like your investments are lost in the blockchain abyss, swirling around with no transparency? Well, *fear not*, dear crypto enthusiasts! 💪✨ Bubblemaps has joined forces with TON to illuminate the dark corners of Telegram's blockchain. That's right, they're bringing the transparency we all crave to over 40 million wallets and 2 million daily transactions. Who knew data visualization could become the life of the party?! 🎉

Bubblemaps Partners with TON for Blockchain Transparency
According to the mighty Nicolas Vaiman, CEO of Bubblemaps:
"TON is a unique case. It's not just another chain; it's backed by one of the largest messaging platforms in the world. The scale is massive, and so is the opportunity for both builders and traders. That’s why we’re bringing Bubblemaps V2 to TON, to help make the network’s activity more accessible and easier to follow for everyone."
With enhanced analytics and visibility, it looks like this partnership is not just a passing fad but a solid *investment move*. 📈💰 Who wouldn't want to see their crypto world through a crystal-clear lens?
So, if you're interested in *building trust and participation* in the crypto market, hop on over to our article and discover how this partnership will *supercharge* your Telegram experience. Don’t miss out on the revolution happening right before our eyes! 🔍👇 Check it out!
Disclaimer: The content on The CCPress is provided for informational purposes only and should not be considered financial or investment advice. Cryptocurrency investments carry inherent risks. Please consult a qualified financial advisor before making any investment decisions.
#Bubblemaps #TON #CryptoTransparency #BlockchainNews #Telegram #CryptoInvesting #DataVisualization #CryptoCommunity #InvestSmart
0 notes
Text

📊 Unlock business growth with the right Marketing Analytics Method — turn data into decisions! 🚀📈
.
.
#HRGauravSingh #MarketingAnalytics #DataDriven #DigitalMarketing #MarketingStrategy #AnalyticsTools #BusinessGrowth #DataAnalysis #MarketingInsights #MarketingTips #GrowthHacking #MarketingData #CustomerInsights #DataScience #PerformanceMarketing #DataVisualization #MarketingIntelligence #MarketingOptimization #MarketingMetrics #OnlineMarketing #MarketingTrends #MarketingROI #CampaignTracking #BigDataMarketing #DataDrivenDecisions #PredictiveAnalytics #MarketResearch #CustomerJourney #ConversionRateOptimization #MarketingTechnology
#hr gaurav singh#digital marketing#digital sales#ecommerce business#online sales#online business#ecommerce#marketing
0 notes
Text
youtube
How to Create an Employee Turnover Analysis Dashboard in Excel (With Slicers & Trends) 📈 This dashboard is perfect for: HR teams analyzing employee retention Excel learners building real-world dashboards Managers who want to track workforce movement Students or freelancers learning Excel reporting
ExcelDashboard #HRAnalytics #EmployeeTurnover #DataVisualization #ExcelTips #PivotTable #ExcelSlicer #HRDashboard #TurnoverRate #exceltutorial
youtube
0 notes
Text
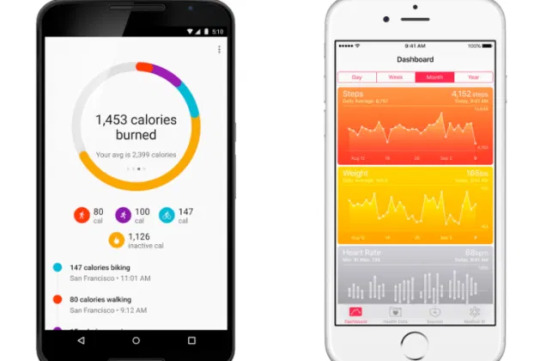
📊💪 Transforming Health with Data: How R & Fitbit Revealed Powerful Insights! 🚀📈
🚀 New Blog Alert: How I Used Data Visualization in R to Improve My Health! 🏃♂️📊
Ever wondered how much impact your daily activities, sleep patterns, and even Netflix binges have on your health?
One of our latest blogs dives deep into a real-life experiment using a Fitbit, R programming, and a passion for data analytics! 📈 From extracting raw activity and sleep data via Fitbit's API to analyzing calorie burns, active minutes, and sleep cycles — this blog uncovers fascinating insights about building healthier habits with the power of data.
👉 Read the full blog here: https://analyticsjobs.in/blog-data-visualization-r-how-i-analyzed-the-data-from-my-fitbit-to-improve-my-overall-health/
🔎 Key takeaways:
How active weekdays vs weekends really are
The real impact of exercise on calorie burn
Why "quality" of sleep matters more than "quantity"
A first-hand attempt at using machine learning to predict better sleep!
If you’re passionate about data, health, or simply curious about combining the two — you don’t want to miss this read! 💬
#AnalyticsJobs #DataVisualization #RProgramming #Fitbit #HealthAnalytics #DataScience #SleepAnalysis #FitnessJourney
0 notes
Text
Power Bi Training with Placement | Call : +91 98407 62315

🔥 Supercharge Your Career with Power BI & SQL in Just 8 Weeks! 🚀
🎯 Launching a New Microsoft Power BI Batch
✅ For IT & NON-IT Professionals
📊 Covers: Power BI, SQL Server, SSIS, Python & BI Basics to Advanced Concepts
🎯 100% Placement Assurance
🤝 Partnered with: Snowflake ❄️ | AWS ☁️ | Microsoft 💻
📞 Contact: +91 98407 62315
📈 Elevate your data skills and boost your career prospects!
#PowerBI #SQL #DataAnalytics #CareerGrowth #BITraining #PowerBITraining #DataVisualization #ITTraining #PlacementAssurance #SQLServer #Snowflake #AWS #Microsoft #CareerDevelopment #powerbitraining #powerbi #dataanalytics #sql #datascience #dataanalysis #datavisualization #excel #msexceltraining #python #tableau #microsoftpowerbi #powerbicourseonline #dataanalyst #exceltraining #powerbidesktop #powerbicourse #datasciencetraining #sqlserver #sqldatabase #sqldeveloper #powerquery #excelonlinecourse #powerbionline #vbamacrostraining #powerbideveloper #powerquerry #vba #dax #vbaexcel
#placement #job #jobs #career #training #hiring #recruitment #jobsearch #education #engineering #college #success #india #students #placements #motivation #admission #coding #internship #java #placementdrive #vacancy #student #mba #employment #university #pune #mumbai #jobseekers #interview
0 notes
Text
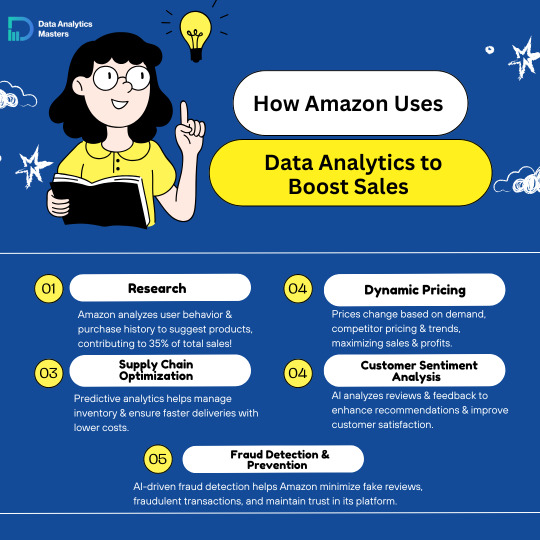
🧐How Amazon Uses Data Analytics to Boost Sales! 👜Amazon isn’t just an e-commerce site—it’s a data powerhouse! From analyzing customer behavior to real-time price changes, every decision is backed by data. ✨ Key Ways Amazon Uses Data 👉Supply Chain Optimization 👉Research & Personalization 👉Dynamic Pricing 👉Customer Sentiment Analysis 👉Fraud Detection & Prevention 📈🤝Want to master Data Analytics and transform industries? Start your journey today! 🚀 🌟Why Choose Data Analytics Masters?🌟 ✔ 100% Job-Oriented Program – Learn skills that get you hired! ✔ Expert Faculty – Learn from industry professionals. ✔ Real Projects – Work on live industry datasets. ✔ Flexible Learning – Online & offline options available. ☎ Contact us ☎ 📞+91 9948801222 💻www.dataanalytics.in 📧[email protected] 🚀 Join Data Analytics Masters and start your career in Data Analytics today! #dataanalyticscasestudy #LearnWithData #python #sql #RealWorldAnalytics #FromDataToDecisions #viralcontent #MachineLearningCaseStudy #BigDataCaseStudy #datadrivendecisions #DataAnalytics #DataScience #MachineLearning #DataAnalysis #DataVisualization #ArtificialIntelligence #DataScientist #Python #RStats #SQL #Tableau #BusinessIntelligence #DataDriven #CyberSecurity
0 notes
Text


Department of Computer Science & Engineering 🖥️|| Seminar on Data Science & Analytics at Mewar University 📊📈
Students and faculty came together to explore the evolving field of Data Science, with expert insights into data analytics tools, machine learning applications, and visualization techniques. Here’s the lineup:
Seminar Schedule:
🔰 Dr. Shilpa Sharma - Associate Professor Topic: Overview of Data Science
🔰 Dr. Vaibhav Bhatnagar - Associate Professor Topics: Data Analytics through Jamovi & Machine Learning through Orange
🔰 Dr. Linesh Raja - Associate Professor Topic: Data Visualization using Tableau
This engaging seminar offered hands-on knowledge in analytics tools, statistical software, and the impactful power of data visualization.
#DataScienceSeminar #ComputerScience #DataAnalytics #MachineLearning #DataVisualization #MewarUniversity #EngineeringEducation #DataScienceTools #LearningWithJamovi #OrangeML #TableauVisualization #FutureDataScientists #HandsOnLearning #AnalyticsAndInsights #TechSeminar2024
0 notes
Text
🚀 Master Power BI with Ease! 🚀
Are you ready to take your data analysis skills to the next level? I’ve covered everything you need to know about Power BI in my latest blog post! 📊✨
🔍 What you’ll learn: 1. Introduction to Power BI – What it is and its features 💡 2. How to connect and import data from multiple sources 🌐 3. Transforming and cleaning data like a pro with Power Query 🛠️ 4. Creating stunning visuals and interactive dashboards 📈 5. Mastering DAX calculations and data analysis 🧠 6. Publishing and sharing your reports with ease 🌟 7. Advanced topics like Time Intelligence and custom visuals 🚀
💡 Plus, real-world project examples and case studies!
Don’t miss out on the ultimate guide to Power BI success. Check it out now and elevate your skills: https://analysiswithsadiul.blogspot.com
#PowerBI #DataVisualization #DataAnalytics #DashboardDesign #DAX #BusinessIntelligence #LearnPowerBI #DataScience
#PowerBI #DataVisualization #BusinessIntelligence #DataAnalytics #DataScience #BI #MicrosoftPowerBI #DAX #DataModeling #DataAnalysis #DataInsights #DashboardDesign #PowerQuery #Reporting #DataStorytelling #Visualization #Analytics #PowerPlatform #SelfServiceBI #PowerBIDesktop #PowerBIDashboard #BIReports #BigData #DataTransformation #BusinessAnalysis #AI #MachineLearning #Automation #SQL #ETL
#analytics#business intelligence#data analytics#power bi#data#data analysis#data science#youtube#data visualization#sql
0 notes
Text

🌟 Explore the World of Data Science at Alvin IT Solutions Virar West! 🌟 Are you fascinated by the power of data and its impact on decision-making? Dive into the realm of Data Science with our comprehensive course at Vurar Alvin IT Solutions Software Training Institute! Whether you're a beginner or aiming to advance your skills, our program is designed to cater to all levels of expertise. Course Highlights: 📊 Fundamentals of Data Science: Understand the core principles and techniques. 🔍 Data Wrangling and Analysis: Learn how to clean, transform, and analyze data effectively. 📈 Machine Learning Essentials: Explore algorithms and their applications. 💻 Hands-on Projects: Apply your learning to real-world scenarios. 🌐 Industry-Relevant Skills: Gain insights into current trends and practices. 🎓 Certification: Earn a recognized certification upon completion. Why Choose Alvin IT Solutions Software Training Institute at Virar ? At Alvin IT Solutions Software Training Institute , we combine theoretical knowledge with practical skills, ensuring our students are well-prepared for the demands of the industry. Our experienced instructors and state-of-the-art facilities create an ideal environment for learning and growth. Who Should Attend? Aspiring Data Scientists Professionals looking to transition into Data Science roles Anyone curious about harnessing the power of data Don't miss this opportunity to embark on a journey towards mastering Data Science at Alvin IT Solutions Software Training Institute ! Limited seats available. Enroll now to secure your spot. For more information and to enroll, visit https://alvinitsolutions.in/ or contact us at 8855839879. Unlock the potential of data with Vurar. Your future in Data Science starts here!
datascience #datascienceinvirar #bestcomputerclassesinvirar #dataenginering #datavisualization #machinelearning #softwaredevelopment
#programming#youtube#college#studyblr#know more about smart coding info solutions#tech#student#code#science#school
0 notes
Text
Unleash Your Data Wizardry with Markcraft Solutions R Programming Course!
Embark on a transformative journey into the realm of data analytics with Markcraft Solutions' R Programming course! 📊💻 Unlock the power of R, a versatile programming language tailored for statistical computing and data analysis.
🎓 Course Highlights: Dive deep into the intricacies of R programming, mastering data manipulation, statistical analysis, and visualization. Our expert instructors ensure a hands-on learning experience, equipping you with the skills to tackle real-world data challenges. From data wrangling to creating insightful visualizations, this course empowers you to harness the full potential of R.
🚀 Why R Programming at Markcraft Solutions?
Industry-Relevant Curriculum: Stay ahead in the rapidly evolving field of data science with a curriculum designed to align with industry demands.
Practical Application: Gain practical insights through real-world projects and case studies, translating theoretical knowledge into actionable skills.
Supportive Community: Connect with fellow learners, share experiences, and collaborate on projects, fostering a supportive learning environment. DataScience #RProgramming #MarkcraftSolutions #DataAnalytics #LearnDataScience #ProgrammingCourse #DataVisualization
Ignite your passion for data analysis and propel your career forward! Enroll now and embrace the world of possibilities with Markcraft Solutions' R Programming course. 🚀📈
0 notes
Text
Master the art of data visualization with Excel 2019! 📊📈 Unleash the power of charts to make complex information easy to understand. Learn how to create stunning visuals, customize your charts, and analyze trends with precision.
#bpa #bpaeducators
#Excel2019 #DataVisualization #ChartsTips
0 notes
Text

Boost your data skills with our data science certification course! 📊Dive into the exciting world of data science and gain practical experience in using data for analysis and problem-solving. 🌐 Explore machine learning, data visualization, and advanced analytics with hands-on learning. 📈🔍 Open doors to new career possibilities and become a certified data expert! 🌟 DATAPRO is a national branded Skill Development Training Centre. Contact: 9573388833 https://www.datapro.in/blog_details/importance-of-data-visualization-in-data-science #MachineLearning #deeplearinng #datascience #datascientist #tech #data #technology #computerscience #datavisualization #analytics #vizag #anakapalli #srikakulam #vizianagaram #andhrapradesh #dataprocomputers
0 notes
Text
How we can use Code interpreter to enhance reporting | financial report | management report
youtube
Video Description: "Revolutionizing Reporting: Harnessing the Power of Code Interpreters for Financial & Management Reports 📈💻 Explore how code interpreters can supercharge your reporting, making it more dynamic, insightful, and efficient! #CodeInterpreters #FinancialReporting #ManagementReporting #DataVisualization #ReportAutomation #Efficiency #DataAnalysis #BusinessInsights #InnovationInFinance #TechInManagement #DataDrivenDecisions"
0 notes
Video
youtube
Unlocking Success: How Business Dashboards Revolutionize Decision-Making
🚀 Welcome to the data-driven revolution! In this article- Unlocking Success: How Business Dashboards Revolutionize Decision-Making, we explore the incredible impact of Business Dashboards, including BI dashboards, CEO dashboards, and more. Discover how these tools can supercharge your decision-making process and elevate your business strategy. Plus, stay tuned for answers to some of the most pressing questions about Business Dashboards. Here are some of the questions we will answer in this article: 🔍 What are Business Intelligence (BI) dashboards? 📈 How do real-time data monitoring and enhanced data analysis benefit decision-makers? 👔 What role do CEO dashboards play in strategic decision-making? 👩💼 How can a virtual Chief Technology Officer (e-CTO) optimize your dashboards? 📊 What steps are involved in the process of creating effective business dashboards? Source Article: https://bit.ly/3EqUsII Stay informed, stay ahead! 📊🔥 Check out our past articles at: https://bit.ly/BlogCTO #BusinessDashboard #DataDrivenDecisions #CEOInsights #VirtualCTO #DecisionMakers #BusinessIntelligence #Analytics101 #DashboardMagic #TechSavvy #StrategySuccess #InnovationJourney #FutureOfBusiness #BoostYourBusiness #DigitalTransformation #SmartDecisionMaking #BusinessGrowth #UnlockPotential #ElevateYourStrategy #SuccessStories #LeadershipExcellence #DataVisualization #BusinessInnovation #CTOExpertise #CompetitiveEdge #IndustryInsights
0 notes
Text
0 notes