#PublicData
Explore tagged Tumblr posts
Visit Tumblr Blog
Explore Tumblr blogs with no restrictions, modern design and the best experience.
Last Seen Tumblr Blogs


Fun Fact
Celebrities use Tumblr as well.
Text
youtube
Citizen Gain: Exploring Data for Systems Change | Tackle the limitations of public data
Delve into the power of data for societal transformation! Join us in "Citizen Gain" as we navigate through the challenges and possibilities of leveraging public data for meaningful systems change. Uncover insights, tackle limitations, and discover the potential to reshape our communities through informed action.
0 notes
Text
Data entry is the process of inputting or transferring information into a digital format, such as a database, spreadsheet, or computer system. It involves the manual or electronic input of data, including text, numbers, and other relevant details. Data entry tasks can range from simple tasks like typing information from paper documents into a computer to more complex tasks like updating records, verifying data accuracy, and maintaining databases.

#dataentry #data #dataentryoffline #dataentryprovidercompany #dataprivacy #publicdata #datacenter #datascience #datamining #datavisualization #entry #dataanalysis #dataentryprojects #businesssupport #smallbusinesssupport #datascientists #entryscene #emailmanagementservices
0 notes
Photo

Posted @withregram • @eu_eurostat 💰💼In the EU, the at-risk-of-poverty rate for people aged less than 65 years living in households with very low work intensity was 64.0% in 2020. This rate ranged from 48.7% in 🇩🇰Denmark and 49.9% in 🇮🇪Ireland to 85.4% in 🇱🇹Lithuania, followed by 84.2% in 🇷🇴Romania. 🔸Across all EU Member States, the at-risk-of-poverty rate decreased as work intensity increased. What were the rates in your country❓ 👉LINK IN BIO . . . #data #database #statistics #datascience #stats #statistical #powerofdata #dataviz #publicdata #europedata #Eurostat #AskEurostat #EU #atriskofpoverty #poverty #povertyrates #income #livingconditions #incomestatistics #demography #demographics #economy #employment #work #workintensity https://www.instagram.com/p/Cg2hIKDMlSH/?igshid=NGJjMDIxMWI=
#data#database#statistics#datascience#stats#statistical#powerofdata#dataviz#publicdata#europedata#eurostat#askeurostat#eu#atriskofpoverty#poverty#povertyrates#income#livingconditions#incomestatistics#demography#demographics#economy#employment#work#workintensity
0 notes
Photo
#CorpMedia #Idiocracy #Oligarchs #MegaBanks vs #Union #Occupy #NoDAPL #BLM #SDF #DACA #MeToo #Humanity #DemExit #FeelTheBern
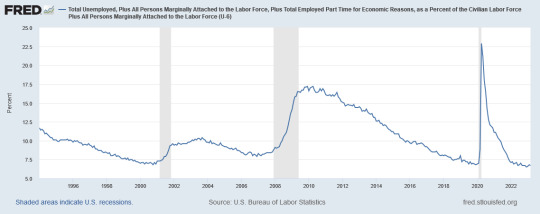
[UPDATE] ACTUAL U.S. U6 TABLE UNEMPLOYMENT RATE 7 APR 2023 6.7%* [W/LTU 24.6]
http://research.stlouisfed.org/fred2/series/U6RATE
http://www.bls.gov/news.release/empsit.t15.htm
http://www.economicpopulist.org/content/never-ending-little-changed-unemployment-figures-january-2013
http://www.economicpopulist.org/content/april-unemployment-rate-lowest-may-2007-6106
*Does NOT Include Long-Term Unemployment (Total 24.6% - See Below)
http://www.shadowstats.com/alternate_data/unemployment-charts
UNEMPLOYMENT RATES IN PROGRESSIVE/SOCIAL DEMOCRACIES
DENMARK 2.3%
NORWAY*** 3.1%
NETHERLANDS 3.5%
ICELAND*** 5.0%
GERMANY 5.6%
BELGIUM 5.8
EUROPEAN UNION 6.0%
***ICELAND AND NORWAY NOT E.U. MEMBERS
https://ec.europa.eu/eurostat/databrowser/view/tipsun30/default/table?lang=en
https://tradingeconomics.com/country-list/unemployment-rate?continent=europe
NEW ZEALAND 3.4%
AUSTRALIA 3.5%
https://tradingeconomics.com/country-list/unemployment-rate?continent=australia
https://www.stats.govt.nz/
https://www.abs.gov.au/
HOW IT'S DONE - WHAT THESE COUNTRIES HAVE IN COMMON
Higher Minimum-Wage/Prevailing Wage Than U S
https://stats.oecd.org/Index.aspx?DataSetCode=RMW
https://en.wikipedia.org/wiki/List_of_minimum_wages_by_country
http://www.nationmaster.com/country-info/stats/Labor/Salaries-and-benefits/Minimum-wage
https://glabor.org/wp/platform/data/
https://wageindicator.org/salary/minimum-wage
Green Economic And Social Policies (Environmental Performance Index)
https://epi.envirocenter.yale.edu/
https://epi.yale.edu/epi-results/2022/component/epi
https://epi.envirocenter.yale.edu/results-overview
Socialized Higher Education (Free Post-Secondary Education)
https://en.wikipedia.org/wiki/Free_education#List_of_countries_with_free_post-secondary_education
High Trade/Labor Union Participation
https://stats.oecd.org/Index.aspx?DataSetCode=CBC
https://stats.oecd.org/Index.aspx?DataSetCode=TUD
http://www.nationmaster.com/country-info/stats/Labor/Trade-union-membership
High Government Transparency Ratings (Less Corruption)
https://www.transparency.org/en/cpi/2022
Equitable Distribution Of Income
http://en.wikipedia.org/wiki/List_of_countries_by_income_equality
Universal Healthcare
http://en.wikipedia.org/wiki/Universal_health_coverage_by_country
http://www.quora.com/What-countries-offer-universal-health-care-and-free-college-education
Longevity
http://en.wikipedia.org/wiki/List_of_countries_by_life_expectancy
Universal Literacy
http://en.wikipedia.org/wiki/List_of_countries_by_literacy_rate
https://www.cia.gov/the-world-factbook/references/guide-to-country-comparisons/
Lower Crime Rate
https://www.numbeo.com/crime/rankings_by_country.jsp
Lower Homicide Rate
https://en.wikipedia.org/wiki/List_of_countries_by_intentional_homicide_rate
Farthest Right U S State VS Furthest Left U S State
https://www.google.com/publicdata/explore?ds=z1ebjpgk2654c1_#!ctype=l&strail=false&bcs=d&nselm=h&met_y=unemployment_rate&fdim_y=seasonality:S&scale_y=lin&ind_y=false&rdim=country&idim=country:US&idim=state:ST4800000000000:ST5000000000000&ifdim=country&hl=en_US&dl=en_US&ind=false
https://www.google.com/publicdata/explore?ds=c8op9mhgodplq_&ctype=l&met_y=median_income_current#!ctype=l&strail=false&bcs=d&nselm=h&met_y=median_income_current&scale_y=lin&ind_y=false&rdim=country&idim=country:US&idim=region:northeast:south:midwest:west&ifdim=country&hl=en_US&dl=en_US&ind=false
https://www.google.com/publicdata/explore?ds=b1tlmra7lb7a9_#!ctype=l&strail=false&bcs=d&nselm=h&met_y=crime_rate&fdim_y=crime_type:violent&scale_y=lin&ind_y=false&rdim=country&idim=state:TX:VT&ifdim=country&hl=en_US&dl=en_US&ind=false
https://en.wikipedia.org/wiki/List_of_U.S._states_by_homicide_rate
SEE A PATTERN? FORWARD AND TO THE LEFT, PLEASE...
*JUST SO WE’RE CLEAR, I SPENT AN AFTERNOON WATCHING FAUX NEWS (SHUDDER) AND RECORDING ALL OF THE THINGS THAT REPUBLICANS SAY KILL JOBS, AND THEN DID THE RESEARCH TO SEE IF ANY OF THEIR CLAIMS HOLD UP IN THE REAL WORLD.
WHAT I FOUND WAS THAT THE OPPOSITE IS TRUE. IN FACT, THOSE COUNTRIES WHICH TOOK THESE POLICIES TO THE FURTHEST EXTREMES ALL SEEMED TO OUTPERFORM THE US WHEN IT COMES TO EMPLOYMENT.
SO I CREATED A SURVEY OF ONLY THOSE COUNTRIES, EXCLUDING ANY THAT DID NOT FIT ALL OF THE CRITERIA. FOR EXAMPLE, I EXCLUDED BELGIUM, BECAUSE, EVEN THOUGH THEY FIT MOST CRITERIA, THEIR ENVIRONMENTAL RECORD IS ACTUALLY WORSE THAN OURS, HOWEVER, IN CASE YOU WERE CURIOUS, THEIR UNEMPLOYMENT RATE WAS STILL LOWER.
I ALSO FOUND THAT THEY BEAT US WHEN IT CAME TO EVERY OTHER SOCIAL MEASURE I COULD THINK OF...?
Actually, North American unemployment stats are pretty misleading and don't report the real jobless rate and the poverty it creates.
http://www.shadowstats.com/alternate_data/unemployment-charts
For example, European countries measure their real unemployment far more honestly and comprehensively than the US [which is what I'm referring to. Bill Clinton had the long-term unemployed removed from the Dept Of Labor's stats in 1994]
For example, in France now the official jobless rate is 7.2%—that’s quite a bit higher than the US, which has an official rate of 3.4%.
However, France, like Italy and Germany, which all have a 35-hour regular work week, consider anyone working less than 11 hours a week to be unemployed, and adult full-time post-secondary students training in a recognized profession are considered part of the work force and therefore unemployed as well—in addition to employable welfare recipients.
http://tinyurl.com/2exnpzx http://www.eurofound.europa.eu/.../feature/fr0103138f.html https://www.eurofound.europa.eu/publications/article/2001/unemployment-rate-falls http://tinyurl.com/34yk4e4
The US does not include students and has no minimum hours provisions in its calculations. By these standards, if you worked, even an hour in a week during the federal survey, you’re considered employed. If you didn’t work and hadn’t looked for a job in four weeks, you’re not considered part of the work force. Non-disabled adult welfare recipients and the huge chronic poor populations, especially in urban areas, aren’t considered either. Canada is similar.
So if you apply US-style measures to France, the rate turns out to be 3.4%. Now, if you apply French measures to the US, the rate jumps to a whopping 24.6%—that’s largely because of the huge under-employed low-paid part-time work force in the US, and the huge number of employable welfare recipients and chronic poor.
93 notes
·
View notes
Text
How Social Media Can be Used to Help Uncover Truth and Solve Crimes
How Social Media Can be Used to Help Uncover Truth and Solve Crimes
[ad_1]
Social media has become so ingrained in our society that it’s often hard to separate it from the rest of our lives. If there’s something happening in your life, it will be reflected on social media in one way or another. And that’s good news for law enforcement officers who are always looking for ways to gain richer insights in their investigations.
Gathering Public Data
When you post…
View On WordPress
0 notes
Text

#CorpMedia #Idiocracy #Oligarchs #MegaBanks vs #Union #Occupy #NoDAPL #BLM #SDF #DACA #MeToo #Humanity #DemExit #FeelTheBern
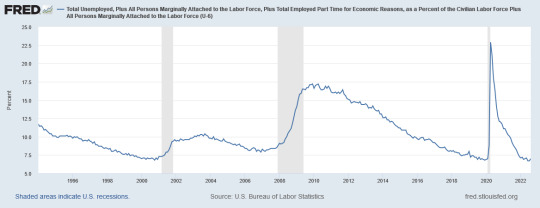
[UPDATE] ACTUAL U.S. U6 TABLE UNEMPLOYMENT RATE 3 SEP 2021 8.8%*
http://research.stlouisfed.org/fred2/series/U6RATE
http://www.bls.gov/news.release/empsit.t15.htm
http://www.economicpopulist.org/content/never-ending-little-changed-unemployment-figures-january-2013
http://www.economicpopulist.org/content/april-unemployment-rate-lowest-may-2007-6106
*Does NOT Include Long-Term Unemployment (Total 25.4% - See Below)
UNEMPLOYMENT RATES IN PROGRESSIVE/SOCIAL DEMOCRACIES 2 JUL 2021
NETHERLANDS 3.1%
GERMANY 3.6%
DENMARK 3.8%
NORWAY*** 5.1%
ICELAND*** 5.2%
EUROPEAN UNION 6.9%
***ICELAND AND NORWAY NOT E.U. MEMBERS
https://tradingeconomics.com/country-list/unemployment-rate?continent=europe
NEW ZEALAND 4%
AUSTRALIA 4.6%
https://tradingeconomics.com/country-list/unemployment-rate?continent=australia
HOW IT'S DONE - WHAT THESE COUNTRIES HAVE IN COMMON
Higher Minimum-Wage/Prevailing Wage Than U S
https://stats.oecd.org/Index.aspx?DataSetCode=RMW
https://en.wikipedia.org/wiki/List_of_minimum_wages_by_country
http://www.nationmaster.com/country-info/stats/Labor/Salaries-and-benefits/Minimum-wage
https://glabor.org/wp/platform/data/
https://wageindicator.org/salary/minimum-wage
Green Economic And Social Policies (Environmental Performance Index)
https://epi.envirocenter.yale.edu/
https://epi.yale.edu/epi-results/2020/component/epi
https://epi.envirocenter.yale.edu/results-overview
Socialized Higher Education (Free Post-Secondary Education)
https://en.wikipedia.org/wiki/Free_education#List_of_countries_with_free_post-secondary_education
High Trade/Labor Union Participation
https://stats.oecd.org/Index.aspx?DataSetCode=CBC
https://stats.oecd.org/Index.aspx?DataSetCode=TUD
http://www.nationmaster.com/country-info/stats/Labor/Trade-union-membership
High Government Transparency Ratings (Less Corruption)
https://www.transparency.org/en/cpi/2020/index/nzl
Equitable Distribution Of Income
http://en.wikipedia.org/wiki/List_of_countries_by_income_equality
Universal Healthcare
http://en.wikipedia.org/wiki/Universal_health_coverage_by_country
http://www.quora.com/What-countries-offer-universal-health-care-and-free-college-education
Longevity
http://en.wikipedia.org/wiki/List_of_countries_by_life_expectancy
Universal Literacy
http://en.wikipedia.org/wiki/List_of_countries_by_literacy_rate
https://www.cia.gov/the-world-factbook/references/guide-to-country-comparisons/
Lower Crime Rate
https://www.numbeo.com/crime/rankings_by_country.jsp
Lower Homicide Rate
https://en.wikipedia.org/wiki/List_of_countries_by_intentional_homicide_rate
Farthest Right U S State VS Furthest Left U S State
https://www.google.com/publicdata/explore?ds=z1ebjpgk2654c1_#!ctype=l&strail=false&bcs=d&nselm=h&met_y=unemployment_rate&fdim_y=seasonality:S&scale_y=lin&ind_y=false&rdim=country&idim=state:ST4800000000000:ST5000000000000&ifdim=country&hl=en_US&dl=en_US&ind=false
https://www.google.com/publicdata/explore?ds=c8op9mhgodplq_&ctype=l&met_y=median_income_current#!ctype=l&strail=false&bcs=d&nselm=h&met_y=median_income_current&scale_y=lin&ind_y=false&rdim=country&idim=country:US&idim=region:northeast:south&ifdim=country&hl=en_US&dl=en_US&ind=false
https://www.google.com/publicdata/explore?ds=b1tlmra7lb7a9_#!ctype=l&strail=false&bcs=d&nselm=h&met_y=crime_rate&fdim_y=crime_type:violent&scale_y=lin&ind_y=false&rdim=country&idim=state:TX:VT&ifdim=country&hl=en_US&dl=en_US&ind=false
https://en.wikipedia.org/wiki/List_of_U.S._states_by_homicide_rate
SEE A PATTERN? FORWARD AND TO THE LEFT, PLEASE...
*JUST SO WE’RE CLEAR, I SPENT AN AFTERNOON WATCHING FAUX NEWS (SHUDDER) AND RECORDING ALL OF THE THINGS THAT REPUBLICANS SAY KILL JOBS, AND THEN DID THE RESEARCH TO SEE IF ANY OF THEIR CLAIMS HOLD UP IN THE REAL WORLD.
WHAT I FOUND WAS THAT THE OPPOSITE IS TRUE. IN FACT, THOSE COUNTRIES WHICH TOOK THESE POLICIES TO THE FURTHEST EXTREMES ALL SEEMED TO OUTPERFORM THE US WHEN IT COMES TO EMPLOYMENT.
SO I CREATED A SURVEY OF ONLY THOSE COUNTRIES, EXCLUDING ANY THAT DID NOT FIT ALL OF THE CRITERIA. FOR EXAMPLE, I EXCLUDED BELGIUM, BECAUSE, EVEN THOUGH THEY FIT MOST CRITERIA, THEIR ENVIRONMENTAL RECORD IS ACTUALLY WORSE THAN OURS, HOWEVER, IN CASE YOU WERE CURIOUS, THEIR UNEMPLOYMENT RATE WAS STILL LOWER.
I ALSO FOUND THAT THEY BEAT US WHEN IT CAME TO EVERY OTHER SOCIAL MEASURE I COULD THINK OF...?
Actually, North American unemployment stats are pretty misleading and don't report the real jobless rate and the poverty it creates.
http://www.shadowstats.com/alternate_data/unemployment-charts
For example, European countries measure their real unemployment far more honestly and comprehensively than the US [which is what I'm referring to. Bill Clinton had the long-term unemployed removed from the Dept Of Labor's stats in 1994]
For example, in France now the official jobless rate is 8.1%—that’s quite a bit higher than the US, which has an official rate of 5.9%.
However, France, like Italy and Germany, which all have a 35-hour regular work week, consider anyone working less than 11 hours a week to be unemployed, and adult full-time post-secondary students training in a recognized profession are considered part of the work force and therefore unemployed as well—in addition to employable welfare recipients.
http://tinyurl.com/2exnpzx http://www.eurofound.europa.eu/.../feature/fr0103138f.html http://tinyurl.com/34yk4e4
The US does not include students and has no minimum hours provisions in its calculations. By these standards, if you worked, even an hour in a week during the federal survey, you’re considered employed. If you didn’t work and hadn’t looked for a job in four weeks, you’re not considered part of the work force. Non-disabled adult welfare recipients and the huge chronic poor populations, especially in urban areas, aren’t considered either. Canada is similar.
So if you apply US-style measures to France, the rate turns out to be 5%. Now, if you apply French measures to the US, the rate jumps to a whopping 25.4%—that’s largely because of the huge under-employed low-paid part-time work force in the US, and the huge number of employable welfare recipients and chronic poor.

60K notes
·
View notes
Text
AddHealth Survey Data
Sample description
The National Longitudinal Study of Adolescent to Adult Health (Add Health) is a longitudinal study of a nationally representative sample of adolescents in grades 7-12 in the United States during the 1994-95 school year. More than 90,000 respondents were interviewed.
Process
Eighty schools in the United States were sampled as representative of the nation, with regard to region of country, urbanicity, size, type, and ethnicity.
The study comprised an in-school questionnaire and an in-home questionnaire.
The in- school questionnaires included the following topics:
· social and demographic characteristics of respondents (of interest both as data and as selection criteria for in-home special samples)
· education and occupation of parents
· household structure
· risk behaviors
· expectations for the future
· self-esteem
· health status
· friendships
· school-year extracurricular activities
All students who completed the In-School Questionnaire plus those who did not complete a questionnaire but were listed on a school roster were eligible for selection into the core in-home sample. Students in each school were stratified by grade and sex. About 17 students were randomly chosen from each stratum so that a total of approximately 200 adolescents were selected from each of the 80 pairs of schools. A total core sample of 12,105 adolescents was interviewed.
Special oversamples
Ethnic: Based on self-reported data from the In-School Questionnaire, four supplementary ethnic-group samples were drawn. Following are the numbers of completed cases in these samples:
· 1,038 blacks from well-educated families (with a parent with a college degree)
· 334 Chinese
· 450 Cuban
· 437 Puerto Rican
Saturation: To enable analysis of social networks, all enrolled students in 16 schools were selected for in-home interviews. These were two large schools (with a total combined enrolment exceeding 3,100) and 14 small schools (with enrolments of fewer than 300).
Disabled: A sample of 589 students self-reported on the In-School Questionnaire that they had physical disabilities involving the use of their limbs.
Genetic: The genetic sample consists of pairs of siblings living in the same households. Identical twins, fraternal twins, and half siblings were sampled with certainty. In addition, non-related pairs, such as step-siblings, foster children, and adopted (non-related) siblings, were part of the genetic sample. The majority of full-sibling pairs entered into the sample by chance (disproportionately drawn from the 16 saturation-school samples). The genetic sample will make possible analyses that differentiate between parental social influence and parental genetic influence, and analyses that assess the extent to which environmental influences on behavior are shared among siblings.
The following topics were covered by the In-Home Interview:
· health status
· health-facility utilization
· nutrition
· peer networks
· decision-making processes
· family composition and dynamics
· educational aspirations and expectations
· employment experience
· the ordering of events in the formation of romantic partnerships
· sexual partnerships
· substance use
· criminal activities
Measures
The study centres on variables that may influence adolescents’ health and risk behaviors, including personal traits, families, friendships, romantic relationships, peer groups, schools, neighborhoods, and communities.
Publicly available data consists of one half of the core sample and one half of the over sample of African American respondents with at least one parent having a formal college education, chosen at random. The surveys are available for download at https://www.cpc.unc.edu/projects/addhealth/documentation/publicdata. The total number of respondents in this set is 6504.
1 note
·
View note
Quote
Here are some of the facts about "climate change" that get the most vigorous downvoting and debate from crisis/alarm advocates. IPCC never uses the word "crisis" a single time. https://www.ipcc.ch/site/assets/uploads/sites/2/2019/05/SR15_SPM_version_report_LR.pdf. It talks about increased participation, more extreme weather events, habitat pressure, etc. but never the catastrophe depicted in media. The US leads the world in emission reduction: https://www.eesi.org/articles/view/u.s.-leads-in-greenhouse-gas-reductions-but-some-states-are-falling-behind US emissions really are nearly flat since 1970: https://www.google.com/publicdata/explore?ds=cjsdgb406s3np_#!ctype=l&strail=false&bcs=d&nselm=h&met_y=emissions&fdim_y=emission_type:co2&scale_y=lin&ind_y=false&rdim=region&idim=country:185&idim=region:-2&ifdim=region&tdim=true&tstart=-748724400000&tend=1302498000000&hl=en_US&dl=en_US&ind=false Renewables have surpassed coal in the USA. https://qz.com/1610977/solar-wind-plus-other-renewables-beat-coal-for-first-time-in-us/?utm_source=reddit.com Per capita emissions are the lowest since 1950: https://eidclimate.org/u-s-per-capita-carbon-emissions-at-lowest-levels-since-1950-thanks-to-natural-gas/ China is routinely defended by alarm advocates. The first talking point mentioned is high per capita US emissions. About 22 percent of Asian emissions are exported, so they are still spiking even after blaming the US for outsourcing emissions. https://www.pnas.org/content/107/12/5687 MIT found that even US homeless account for double the global per capita average. https://www.sciencedaily.com/releases/2008/04/080428120658.htm One item is missing from the alarms being sounded: There is not a single example of someone who is calling for everyone to go to zero emissions who has actually unplugged from the grid, stopped buying things and begun foraging for food.
https://www.reddit.com/r/climateskeptics/comments/bvppro/the_most_inconvenient_truths/
In convenient facts for the chicken littles.

1 note
·
View note
Photo
Friendly reminder that this is entirely the product of Anglo-American capitalism, and is not anything one would have to deal with in an actually civilized country. Here is some math on our zany brand of capitalism: ACTUAL U.S. U6 TABLE UNEMPLOYMENT RATE 1 APR 2022 6.9%* [W/LTU 24.6%] [UPDATE] ACTUAL U.S. U6 TABLE UNEMPLOYMENT RATE 1 APR 2022 6.9%* [W/LTU 24.6%] http://research.stlouisfed.org/fred2/series/U6RATE http://www.bls.gov/news.release/empsit.t15.htm http://www.economicpopulist.org/content/never-ending-little-changed-unemployment-figures-january-2013 http://www.economicpopulist.org/content/april-unemployment-rate-lowest-may-2007-6106 *Does NOT Include Long-Term Unemployment (Total 24.6% - See Below) http://www.shadowstats.com/alternate_data/unemployment-charts UNEMPLOYMENT RATES IN PROGRESSIVE/SOCIAL DEMOCRACIES DENMARK 2.5% NORWAY*** 3.4% NETHERLANDS 3.4% ICELAND*** 4.5% GERMANY 5.0% FINLAND 6.7% EUROPEAN UNION 6.8% ***ICELAND AND NORWAY NOT E.U. MEMBERS https://tradingeconomics.com/country-list/unemployment-rate?continent=europe https://ec.europa.eu/eurostat/databrowser/view/tipsun30/default/table?lang=en NEW ZEALAND 3.2% AUSTRALIA 4.0% https://tradingeconomics.com/country-list/unemployment-rate?continent=australia https://www.stats.govt.nz/ https://www.abs.gov.au/ HOW IT'S DONE - WHAT THESE COUNTRIES HAVE IN COMMON Higher Minimum-Wage/Prevailing Wage Than U S https://stats.oecd.org/Index.aspx?DataSetCode=RMW https://en.wikipedia.org/wiki/List_of_minimum_wages_by_country http://www.nationmaster.com/country-info/stats/Labor/Salaries-and-benefits/Minimum-wage https://glabor.org/wp/platform/data/ https://wageindicator.org/salary/minimum-wage Green Economic And Social Policies (Environmental Performance Index) https://epi.envirocenter.yale.edu/ https://epi.yale.edu/epi-results/2020/component/epi https://epi.envirocenter.yale.edu/results-overview Socialized Higher Education (Free Post-Secondary Education) https://en.wikipedia.org/wiki/Free_education#List_of_countries_with_free_post-secondary_education High Trade/Labor Union Participation https://stats.oecd.org/Index.aspx?DataSetCode=CBC https://stats.oecd.org/Index.aspx?DataSetCode=TUD http://www.nationmaster.com/country-info/stats/Labor/Trade-union-membership High Government Transparency Ratings (Less Corruption) https://www.transparency.org/en/cpi/2021 Equitable Distribution Of Income http://en.wikipedia.org/wiki/List_of_countries_by_income_equality Universal Healthcare http://en.wikipedia.org/wiki/Universal_health_coverage_by_country http://www.quora.com/What-countries-offer-universal-health-care-and-free-college-education Longevity http://en.wikipedia.org/wiki/List_of_countries_by_life_expectancy Universal Literacy http://en.wikipedia.org/wiki/List_of_countries_by_literacy_rate https://www.cia.gov/the-world-factbook/references/guide-to-country-comparisons/ Lower Crime Rate https://www.numbeo.com/crime/rankings_by_country.jsp Lower Homicide Rate https://en.wikipedia.org/wiki/List_of_countries_by_intentional_homicide_rate Farthest Right U S State VS Furthest Left U S State https://www.google.com/publicdata/explore?ds=z1ebjpgk2654c1_#!ctype=l&strail=false&bcs=d&nselm=h&met_y=unemployment_rate&fdim_y=seasonality:S&scale_y=lin&ind_y=false&rdim=country&idim=country:US&idim=state:ST4800000000000:ST5000000000000&ifdim=country&hl=en_US&dl=en_US&ind=false https://www.google.com/publicdata/explore?ds=c8op9mhgodplq_&ctype=l&met_y=median_income_current#!ctype=l&strail=false&bcs=d&nselm=h&met_y=median_income_current&scale_y=lin&ind_y=false&rdim=country&idim=country:US&idim=region:northeast:south:midwest:west&ifdim=country&hl=en_US&dl=en_US&ind=false https://www.google.com/publicdata/explore?ds=b1tlmra7lb7a9_#!ctype=l&strail=false&bcs=d&nselm=h&met_y=crime_rate&fdim_y=crime_type:violent&scale_y=lin&ind_y=false&rdim=country&idim=state:TX:VT&ifdim=country&hl=en_US&dl=en_US&ind=false https://en.wikipedia.org/wiki/List_of_U.S._states_by_homicide_rate SEE A PATTERN? FORWARD AND TO THE LEFT, PLEASE... *JUST SO WE’RE CLEAR, I SPENT AN AFTERNOON WATCHING FAUX NEWS (SHUDDER) AND RECORDING ALL OF THE THINGS THAT REPUBLICANS SAY KILL JOBS, AND THEN DID THE RESEARCH TO SEE IF ANY OF THEIR CLAIMS HOLD UP IN THE REAL WORLD. WHAT I FOUND WAS THAT THE OPPOSITE IS TRUE. IN FACT, THOSE COUNTRIES WHICH TOOK THESE POLICIES TO THE FURTHEST EXTREMES ALL SEEMED TO OUTPERFORM THE US WHEN IT COMES TO EMPLOYMENT. SO I CREATED A SURVEY OF ONLY THOSE COUNTRIES, EXCLUDING ANY THAT DID NOT FIT ALL OF THE CRITERIA. FOR EXAMPLE, I EXCLUDED BELGIUM, BECAUSE, EVEN THOUGH THEY FIT MOST CRITERIA, THEIR ENVIRONMENTAL RECORD IS ACTUALLY WORSE THAN OURS, HOWEVER, IN CASE YOU WERE CURIOUS, THEIR UNEMPLOYMENT RATE WAS STILL LOWER. I ALSO FOUND THAT THEY BEAT US WHEN IT CAME TO EVERY OTHER SOCIAL MEASURE I COULD THINK OF...? Actually, North American unemployment stats are pretty misleading and don't report the real jobless rate and the poverty it creates. http://www.shadowstats.com/alternate_data/unemployment-charts For example, European countries measure their real unemployment far more honestly and comprehensively than the US [which is what I'm referring to. Bill Clinton had the long-term unemployed removed from the Dept Of Labor's stats in 1994] For example, in France now the official jobless rate is 7.4%—that’s quite a bit higher than the US, which has an official rate of 3.6%. However, France, like Italy and Germany, which all have a 35-hour regular work week, consider anyone working less than 11 hours a week to be unemployed, and adult full-time post-secondary students training in a recognized profession are considered part of the work force and therefore unemployed as well—in addition to employable welfare recipients. http://tinyurl.com/2exnpzx http://www.eurofound.europa.eu/.../feature/fr0103138f.html http://tinyurl.com/34yk4e4 The US does not include students and has no minimum hours provisions in its calculations. By these standards, if you worked, even an hour in a week during the federal survey, you’re considered employed. If you didn’t work and hadn’t looked for a job in four weeks, you’re not considered part of the work force. Non-disabled adult welfare recipients and the huge chronic poor populations, especially in urban areas, aren’t considered either. Canada is similar. So if you apply US-style measures to France, the rate turns out to be 4%. Now, if you apply French measures to the US, the rate jumps to a whopping 24.6%—that’s largely because of the huge under-employed low-paid part-time work force in the US, and the huge number of employable welfare recipients and chronic poor.

102K notes
·
View notes
Text
The art and science of writing content for websites, blogs, social media, marketing materials, and other platforms is known as content writing. Providing a target audience with relevant, interesting, educational, and useful content is the main objective of content writing. It entails creating sentences with the intention of persuading, educating, entertaining, or telling a tale.

dataentry #data #dataentryoffline #dataentryprovidercompany #dataprivacy #publicdata #datacenter #datascience #datamining #datavisualization #entry #dataanalysis #dataentryprojects #businesssupport #smallbusinesssupport #datascientists #entryscene #emailmanagement #socialmediacontent #freewriting #writinginspiration #contentmarketing #creativewriting #contentcreators #blogwriting #contentpromotion #contentcreator #digitalcontentcreator #essaywriting #contentmarketer #mediamarketing #contentstrategist #onlinemarketing
#content marketing#internet marketing#digital marketng#lead generation#business#education#data entry
0 notes
Text
UK Infographic
This weeks project was to make an info graphic in which the theme is the UK and its specific Regions. The theme could either be: Arts/Cultural UK Food UK Weird/strange/Unknown UK Historical UK. I was given Historical UK and began to generate ideas.

My initial idea was British music through the decades, where I would show the popularity of chart topping songs. I then considered the Medical history and how healthcare has advanced in the last decade as I thought that fit into the historical theme better.
Another idea was the number of historical buildings in each region of the UK, but after thinking this idea through I couldn’t figure out how I could make the design engaging or appealing to look at. The large bubbles represent the highest selling hits of that particular decade whereas the smaller bubbles show the highest selling songs of a singular year (1963 for example) I did begin my music concept and was fond of the overall theme I was going with, however, I quickly found I had jumped into the design before the actual point I was trying to convey, the whole point of the info graphic was to represent each band or artist with their logo as to avoid using text (which would clutter the design), though I soon realised there were hardly any chart topping singles by bands or artists with no-text logos (such as the Rolling Stones tongue or The Who’s red white and blue logo) that I could use and was therefore left with no option but to find a more informative and graphic based subject as opposed to text based information, this decision was made because I felt I needed to test my abilities as a designer through visual imagery.

Eventually, I came to the conclusion of the UK’s history of population growth which I thought would be a perfect theme to represent in the form of an info graphic. This was a completely different theme to my original music idea, this is because I took a lot more time and consideration when planning out what message and information I was planning to represent.
I decided to use a colour key to draw attention to the UK’s different regional populations as well as preserving a consistent colour scheme.While the line graph was based off of readily compiled data and then constructed solely in illustrator, the pie chart was made by collecting each regions population individually and then feeding the figures into an excel spreadsheet which left me with my desired results. I then took the pie chart and created a much more visually pleasing adaptation.

I found similar info graphics to my idea and implemented certain features into my own design.

https://www.123rf.com/photo_37256740_stock-vector-uk-population-infographic-with-map-and-icons.html
In order to show a some what notable change in the country's population, I decided to start from the 1950′s to 2017 as that was as recent as the information was. The sources I used for reference are listed below:
Sources

https://www.nrscotland.gov.uk/research/guides/census-records/1911-census
1950s population UK
www.worldometers.info/world-population/uk-population/
https://www.telegraph.co.uk/comment/columnists/philipjohnston/6413232/Britains-population-is-booming-how-many-more-people-can-we-take.html
Modern Day UK Population
https://www.google.co.uk/publicdata/explore?ds=d5bncppjof8f9_&met_y=sp_pop_totl&hl=en&dl=en#!ctype=l&strail=false&bcs=d&nselm=h&met_y=sp_pop_totl&scale_y=lin&ind_y=false&rdim=country&idim=country:GBR&ifdim=country&hl=en_US&dl=en&ind=false
INDIVIDUALS
SCOTLAND: https://www.nrscotland.gov.uk/news/2017/scotlands-population-is-increasing
Wales:
https://www.statista.com/statistics/294681/population-england-united-kingdom-uk-regional/
4 notes
·
View notes
Photo

#CorpMedia #Idiocracy #Oligarchs #MegaBanks vs #Union #Occupy #NoDAPL #BLM #SDF #DACA #MeToo #Humanity #DemExit #FeelTheBern
[UPDATE] ACTUAL U.S. U6 TABLE UNEMPLOYMENT RATE 4 NOV 2022 6.8%* [W/LTU 24.5]
http://research.stlouisfed.org/fred2/series/U6RATE
http://www.bls.gov/news.release/empsit.t15.htm
http://www.economicpopulist.org/content/never-ending-little-changed-unemployment-figures-january-2013
http://www.economicpopulist.org/content/april-unemployment-rate-lowest-may-2007-6106
*Does NOT Include Long-Term Unemployment (Total 24.5% - See Below)
http://www.shadowstats.com/alternate_data/unemployment-charts
UNEMPLOYMENT RATES IN PROGRESSIVE/SOCIAL DEMOCRACIES
DENMARK 2.5%
NORWAY*** 3.2%
ICELAND*** 3.6%
NETHERLANDS 3.8%
GERMANY 5.5%
EUROPEAN UNION 6.0%
***ICELAND AND NORWAY NOT E.U. MEMBERS
https://tradingeconomics.com/country-list/unemployment-rate?continent=europe
https://ec.europa.eu/eurostat/databrowser/view/tipsun30/default/table?lang=en
NEW ZEALAND 3.3%
AUSTRALIA 3.5%
https://tradingeconomics.com/country-list/unemployment-rate?continent=australia
https://www.stats.govt.nz/
https://www.abs.gov.au/
HOW IT'S DONE - WHAT THESE COUNTRIES HAVE IN COMMON
Higher Minimum-Wage/Prevailing Wage Than U S
https://stats.oecd.org/Index.aspx?DataSetCode=RMW
https://en.wikipedia.org/wiki/List_of_minimum_wages_by_country
http://www.nationmaster.com/country-info/stats/Labor/Salaries-and-benefits/Minimum-wage
https://glabor.org/wp/platform/data/
https://wageindicator.org/salary/minimum-wage
Green Economic And Social Policies (Environmental Performance Index)
https://epi.envirocenter.yale.edu/
https://epi.yale.edu/epi-results/2022/component/epi
https://epi.envirocenter.yale.edu/results-overview
Socialized Higher Education (Free Post-Secondary Education)
https://en.wikipedia.org/wiki/Free_education#List_of_countries_with_free_post-secondary_education
High Trade/Labor Union Participation
https://stats.oecd.org/Index.aspx?DataSetCode=CBC
https://stats.oecd.org/Index.aspx?DataSetCode=TUD
http://www.nationmaster.com/country-info/stats/Labor/Trade-union-membership
High Government Transparency Ratings (Less Corruption)
https://www.transparency.org/en/cpi/2021
Equitable Distribution Of Income
http://en.wikipedia.org/wiki/List_of_countries_by_income_equality
Universal Healthcare
http://en.wikipedia.org/wiki/Universal_health_coverage_by_country
http://www.quora.com/What-countries-offer-universal-health-care-and-free-college-education
Longevity
http://en.wikipedia.org/wiki/List_of_countries_by_life_expectancy
Universal Literacy
http://en.wikipedia.org/wiki/List_of_countries_by_literacy_rate
https://www.cia.gov/the-world-factbook/references/guide-to-country-comparisons/
Lower Crime Rate
https://www.numbeo.com/crime/rankings_by_country.jsp
Lower Homicide Rate
https://en.wikipedia.org/wiki/List_of_countries_by_intentional_homicide_rate
Farthest Right U S State VS Furthest Left U S State
https://www.google.com/publicdata/explore?ds=z1ebjpgk2654c1_#!ctype=l&strail=false&bcs=d&nselm=h&met_y=unemployment_rate&fdim_y=seasonality:S&scale_y=lin&ind_y=false&rdim=country&idim=country:US&idim=state:ST4800000000000:ST5000000000000&ifdim=country&hl=en_US&dl=en_US&ind=false
https://www.google.com/publicdata/explore?ds=c8op9mhgodplq_&ctype=l&met_y=median_income_current#!ctype=l&strail=false&bcs=d&nselm=h&met_y=median_income_current&scale_y=lin&ind_y=false&rdim=country&idim=country:US&idim=region:northeast:south:midwest:west&ifdim=country&hl=en_US&dl=en_US&ind=false
https://www.google.com/publicdata/explore?ds=b1tlmra7lb7a9_#!ctype=l&strail=false&bcs=d&nselm=h&met_y=crime_rate&fdim_y=crime_type:violent&scale_y=lin&ind_y=false&rdim=country&idim=state:TX:VT&ifdim=country&hl=en_US&dl=en_US&ind=false
https://en.wikipedia.org/wiki/List_of_U.S._states_by_homicide_rate
SEE A PATTERN? FORWARD AND TO THE LEFT, PLEASE...
*JUST SO WE’RE CLEAR, I SPENT AN AFTERNOON WATCHING FAUX NEWS (SHUDDER) AND RECORDING ALL OF THE THINGS THAT REPUBLICANS SAY KILL JOBS, AND THEN DID THE RESEARCH TO SEE IF ANY OF THEIR CLAIMS HOLD UP IN THE REAL WORLD.
WHAT I FOUND WAS THAT THE OPPOSITE IS TRUE. IN FACT, THOSE COUNTRIES WHICH TOOK THESE POLICIES TO THE FURTHEST EXTREMES ALL SEEMED TO OUTPERFORM THE US WHEN IT COMES TO EMPLOYMENT.
SO I CREATED A SURVEY OF ONLY THOSE COUNTRIES, EXCLUDING ANY THAT DID NOT FIT ALL OF THE CRITERIA. FOR EXAMPLE, I EXCLUDED BELGIUM, BECAUSE, EVEN THOUGH THEY FIT MOST CRITERIA, THEIR ENVIRONMENTAL RECORD IS ACTUALLY WORSE THAN OURS, HOWEVER, IN CASE YOU WERE CURIOUS, THEIR UNEMPLOYMENT RATE WAS STILL LOWER.
I ALSO FOUND THAT THEY BEAT US WHEN IT CAME TO EVERY OTHER SOCIAL MEASURE I COULD THINK OF...?
Actually, North American unemployment stats are pretty misleading and don't report the real jobless rate and the poverty it creates.
http://www.shadowstats.com/alternate_data/unemployment-charts
For example, European countries measure their real unemployment far more honestly and comprehensively than the US [which is what I'm referring to. Bill Clinton had the long-term unemployed removed from the Dept Of Labor's stats in 1994]
For example, in France now the official jobless rate is 7.5%—that’s quite a bit higher than the US, which has an official rate of 3.7%.
However, France, like Italy and Germany, which all have a 35-hour regular work week, consider anyone working less than 11 hours a week to be unemployed, and adult full-time post-secondary students training in a recognized profession are considered part of the work force and therefore unemployed as well—in addition to employable welfare recipients.
http://tinyurl.com/2exnpzx http://www.eurofound.europa.eu/.../feature/fr0103138f.html https://www.eurofound.europa.eu/publications/article/2001/unemployment-rate-falls http://tinyurl.com/34yk4e4
The US does not include students and has no minimum hours provisions in its calculations. By these standards, if you worked, even an hour in a week during the federal survey, you’re considered employed. If you didn’t work and hadn’t looked for a job in four weeks, you’re not considered part of the work force. Non-disabled adult welfare recipients and the huge chronic poor populations, especially in urban areas, aren’t considered either. Canada is similar.
So if you apply US-style measures to France, the rate turns out to be 4%. Now, if you apply French measures to the US, the rate jumps to a whopping 24.6%—that’s largely because of the huge under-employed low-paid part-time work force in the US, and the huge number of employable welfare recipients and chronic poor.
16 notes
·
View notes
Photo
ACTUAL U.S. U6 TABLE UNEMPLOYMENT RATE 1 APR 2022 6.9%* [W/LTU 24.6%]
http://research.stlouisfed.org/fred2/series/U6RATE
http://www.bls.gov/news.release/empsit.t15.htm
http://www.economicpopulist.org/content/never-ending-little-changed-unemployment-figures-january-2013
http://www.economicpopulist.org/content/april-unemployment-rate-lowest-may-2007-6106
*Does NOT Include Long-Term Unemployment (Total 24.6% - See Below)
http://www.shadowstats.com/alternate_data/unemployment-charts
UNEMPLOYMENT RATES IN PROGRESSIVE/SOCIAL DEMOCRACIES
DENMARK 2.5%
NORWAY*** 3.4%
NETHERLANDS 3.4%
ICELAND*** 4.5%
GERMANY 5.0%
FINLAND 6.7%
EUROPEAN UNION 6.8%
***ICELAND AND NORWAY NOT E.U. MEMBERS
https://tradingeconomics.com/country-list/unemployment-rate?continent=europe
https://ec.europa.eu/eurostat/databrowser/view/tipsun30/default/table?lang=en
NEW ZEALAND 3.2%
AUSTRALIA 4.0%
https://tradingeconomics.com/country-list/unemployment-rate?continent=australia
https://www.stats.govt.nz/
https://www.abs.gov.au/
HOW IT'S DONE - WHAT THESE COUNTRIES HAVE IN COMMON
Higher Minimum-Wage/Prevailing Wage Than U S
https://stats.oecd.org/Index.aspx?DataSetCode=RMW
https://en.wikipedia.org/wiki/List_of_minimum_wages_by_country
http://www.nationmaster.com/country-info/stats/Labor/Salaries-and-benefits/Minimum-wage
https://glabor.org/wp/platform/data/
https://wageindicator.org/salary/minimum-wage
Green Economic And Social Policies (Environmental Performance Index)
https://epi.envirocenter.yale.edu/
https://epi.yale.edu/epi-results/2020/component/epi
https://epi.envirocenter.yale.edu/results-overview
Socialized Higher Education (Free Post-Secondary Education)
https://en.wikipedia.org/wiki/Free_education#List_of_countries_with_free_post-secondary_education
High Trade/Labor Union Participation
https://stats.oecd.org/Index.aspx?DataSetCode=CBC
https://stats.oecd.org/Index.aspx?DataSetCode=TUD
http://www.nationmaster.com/country-info/stats/Labor/Trade-union-membership
High Government Transparency Ratings (Less Corruption)
https://www.transparency.org/en/cpi/2021
Equitable Distribution Of Income
http://en.wikipedia.org/wiki/List_of_countries_by_income_equality
Universal Healthcare
http://en.wikipedia.org/wiki/Universal_health_coverage_by_country
http://www.quora.com/What-countries-offer-universal-health-care-and-free-college-education
Longevity
http://en.wikipedia.org/wiki/List_of_countries_by_life_expectancy
Universal Literacy
http://en.wikipedia.org/wiki/List_of_countries_by_literacy_rate
https://www.cia.gov/the-world-factbook/references/guide-to-country-comparisons/
Lower Crime Rate
https://www.numbeo.com/crime/rankings_by_country.jsp
Lower Homicide Rate
https://en.wikipedia.org/wiki/List_of_countries_by_intentional_homicide_rate
Farthest Right U S State VS Furthest Left U S State
https://www.google.com/publicdata/explore?ds=z1ebjpgk2654c1_#!ctype=l&strail=false&bcs=d&nselm=h&met_y=unemployment_rate&fdim_y=seasonality:S&scale_y=lin&ind_y=false&rdim=country&idim=country:US&idim=state:ST4800000000000:ST5000000000000&ifdim=country&hl=en_US&dl=en_US&ind=false
https://www.google.com/publicdata/explore?ds=c8op9mhgodplq_&ctype=l&met_y=median_income_current#!ctype=l&strail=false&bcs=d&nselm=h&met_y=median_income_current&scale_y=lin&ind_y=false&rdim=country&idim=country:US&idim=region:northeast:south:midwest:west&ifdim=country&hl=en_US&dl=en_US&ind=false
https://www.google.com/publicdata/explore?ds=b1tlmra7lb7a9_#!ctype=l&strail=false&bcs=d&nselm=h&met_y=crime_rate&fdim_y=crime_type:violent&scale_y=lin&ind_y=false&rdim=country&idim=state:TX:VT&ifdim=country&hl=en_US&dl=en_US&ind=false
https://en.wikipedia.org/wiki/List_of_U.S._states_by_homicide_rate
SEE A PATTERN? FORWARD AND TO THE LEFT, PLEASE...
*JUST SO WE’RE CLEAR, I SPENT AN AFTERNOON WATCHING FAUX NEWS (SHUDDER) AND RECORDING ALL OF THE THINGS THAT REPUBLICANS SAY KILL JOBS, AND THEN DID THE RESEARCH TO SEE IF ANY OF THEIR CLAIMS HOLD UP IN THE REAL WORLD.
WHAT I FOUND WAS THAT THE OPPOSITE IS TRUE. IN FACT, THOSE COUNTRIES WHICH TOOK THESE POLICIES TO THE FURTHEST EXTREMES ALL SEEMED TO OUTPERFORM THE US WHEN IT COMES TO EMPLOYMENT.
SO I CREATED A SURVEY OF ONLY THOSE COUNTRIES, EXCLUDING ANY THAT DID NOT FIT ALL OF THE CRITERIA. FOR EXAMPLE, I EXCLUDED BELGIUM, BECAUSE, EVEN THOUGH THEY FIT MOST CRITERIA, THEIR ENVIRONMENTAL RECORD IS ACTUALLY WORSE THAN OURS, HOWEVER, IN CASE YOU WERE CURIOUS, THEIR UNEMPLOYMENT RATE WAS STILL LOWER.
I ALSO FOUND THAT THEY BEAT US WHEN IT CAME TO EVERY OTHER SOCIAL MEASURE I COULD THINK OF...?
Actually, North American unemployment stats are pretty misleading and don't report the real jobless rate and the poverty it creates.
http://www.shadowstats.com/alternate_data/unemployment-charts
For example, European countries measure their real unemployment far more honestly and comprehensively than the US [which is what I'm referring to. Bill Clinton had the long-term unemployed removed from the Dept Of Labor's stats in 1994]
For example, in France now the official jobless rate is 7.4%—that’s quite a bit higher than the US, which has an official rate of 3.6%.
However, France, like Italy and Germany, which all have a 35-hour regular work week, consider anyone working less than 11 hours a week to be unemployed, and adult full-time post-secondary students training in a recognized profession are considered part of the work force and therefore unemployed as well—in addition to employable welfare recipients.
http://tinyurl.com/2exnpzx http://www.eurofound.europa.eu/.../feature/fr0103138f.html http://tinyurl.com/34yk4e4
The US does not include students and has no minimum hours provisions in its calculations. By these standards, if you worked, even an hour in a week during the federal survey, you’re considered employed. If you didn’t work and hadn’t looked for a job in four weeks, you’re not considered part of the work force. Non-disabled adult welfare recipients and the huge chronic poor populations, especially in urban areas, aren’t considered either. Canada is similar.
So if you apply US-style measures to France, the rate turns out to be 4%. Now, if you apply French measures to the US, the rate jumps to a whopping 24.6%—that’s largely because of the huge under-employed low-paid part-time work force in the US, and the huge number of employable welfare recipients and chronic poor.

240 notes
·
View notes
Link
Alice was Jack Watt’s maternal grandmother, and Harriet was his great aunt.
1 note
·
View note
Text
Under the pull-down menu at the left, choose any public health data that interests you. The website will prompt you to select the X and Y axes. Also be sure to select several regions of the world to compare.
Under the pull-down menu at the left, choose any public health data that interests you. The website will prompt you to select the X and Y axes. Also be sure to select several regions of the world to compare.
In this assignment, you’ll get the chance to experiment with Google’s graph-making technology, which harnesses all of the public data available from the World Bank, World Development Indicators.Visit this website. https://www.google.com/publicdata/explore?ds=d5bnc… Click the “Explore the data” button. Under the pull-down menu at the left, choose any public health data that interests you.…
View On WordPress
0 notes
Text
Under the pull-down menu at the left, choose any public health data that interests you. The website will prompt you to select the X and Y axes. Also be sure to select several regions of the world to compare.
Under the pull-down menu at the left, choose any public health data that interests you. The website will prompt you to select the X and Y axes. Also be sure to select several regions of the world to compare.
In this assignment, you’ll get the chance to experiment with Google’s graph-making technology, which harnesses all of the public data available from the World Bank, World Development Indicators.Visit this website. https://www.google.com/publicdata/explore?ds=d5bnc… Click the “Explore the data” button. Under the pull-down menu at the left, choose any public health data that interests you.…
View On WordPress
0 notes