#Rtts scud
Explore tagged Tumblr posts
Visit Tumblr Blog
Explore Tumblr blogs with no restrictions, modern design and the best experience.
Last Seen Tumblr Blogs


Fun Fact
Tumblr has a 66 index score for customer satisfaction in the US.
Text
First artfight attack of the year was my mass attack to make sure I didn’t run out of time :)
Rtts lovelies

See the post on af > here < to find all the owners of the characters
I’ll be doing smaller attacks for the next two weeks. Hoping to do at least 14 but my first goal is a simple 6.
#artfight#artfight seafoam#Rtts#runaway to the stars#rtts centaurs#rtts avian#Rtts scud#rtts bug ferret#spec bio#speculative biology#alien#aliens
129 notes
·
View notes
Text
youtube
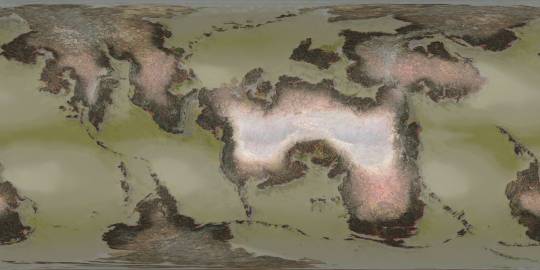
This video showcases my Blender model of the planet that the Scud aliens call home, the fourth and final world I've mapped out for @jayrockin's "Runaway to the Stars" project. A *lot* of maps were created in service of this final render, and also in service of presenting the special qualities of this planet. I intend to show you as many of these as I can under the cut, and also in subsequent posts focusing on some of the more interstitial, ancillary maps and figures that played a part in producing the primary maps you'll see in this main post.
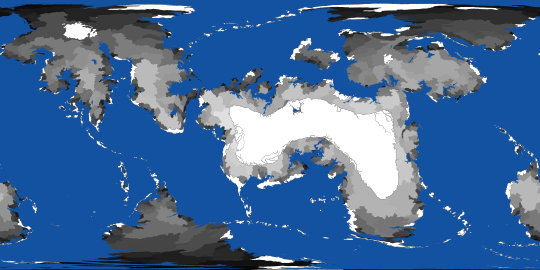
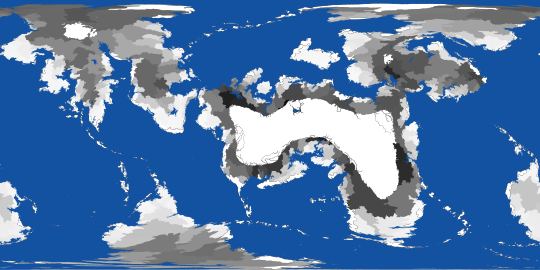
Before I show the first maps I made for this project, what you see below are the satellite-style maps for the Equinoxes and Solstices, in order of (Northern) Spring, Summer, Fall, and Winter, the latter serving as the texture for the Blender object you saw in the video.


__________
With that matter covered, our next focus is this project's foundation: Geology. While I didn't spin as elaborate a tectonic history for this planet as I did for the Ayrum commission, I did work out as much detail as I could for the more recent geological activity, to set the stage for the elevation data - including a narrower focus on the coastal shallows that host the Scud populations.


__________
Once I could move on to climate, my first step was finding this planet's relative Insolation, which I managed thanks to @reversedumbrella's code and coaching. With an obliquity of only 16 degrees, this planet's yearly maximum Insolation levels stick close to the equator, compared to pole-to-pole oscillation we see on Earth

__________
Having a rough sense of where heat would concentrate seasonally and how the landmasses would deflect water in light of the planet's retrograde spin, I was able to set down the bi-annual ocean currents (Northern Summer above and Northern Winter below), then the monthly water temperatures pushed around by said currents, and finally -after factoring in many other considerations- the monthly land temperatures as well (combined in the second gif)


__________
Next came the seasonal air pressure maps and subsequent wind patterns (my first time creating those from scratch), which later factored into the precipitation maps. The incredible temperatures at the largest continent's interior make a desert of most of it, and the other interiors are fairly dry too, but all that heat on the equatorial ocean generates a *lot* of evaporation which ends up coming down elsewhere.


__________
With temperatures and precipitation mapped out for each month, I was able to find how the accumulation and melt of ice and snow played out, too. Given such a hot equator it's surprising to see freezing temperatures hold out in some places, but low obliquity and high elevation shield what areas they can, it seems.


__________
All this monthly data was then painstakingly combined and compared and plugged into equations to produce maps of discrete climate zones, using both the Köppen (left) and Trewartha (right) classification systems. The higher latitudes see some overlap with Earth's conditions, but the Tropics...


__________
I never really finished the map I wanted to make with my own loosely customized classification system, but I *did* get as far as this breakdown of the areas that sometimes surpass 56.7 degrees Celsius, Earth's record for highest surface temperature ever directly measured. And as you can see, that earthly record is broken by a *significant* fraction of this planet's surface, and far exceeded by the equatorial continent's deep interior

__________
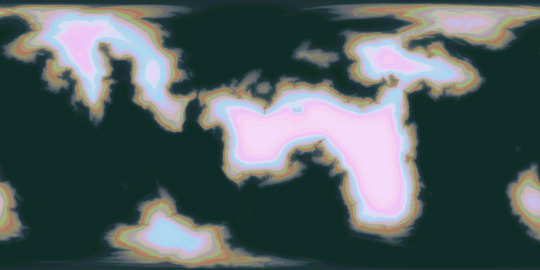
The final phase of this project dealt with creating satellite maps of this planet's surface (which you saw at the top of this post), which started with a map of dry and submerged substrate, then a density map of the vegetation that sits atop it, then the colors of that vegetation under annual average conditions (demonstrating how they would appear in-person, rather than the area's appearance from orbit), and finally plant colors under seasonal conditions (same conceit as previous). In concert with the seasonal ice and snow maps, it was the four maps in the last sequence which were overlaid on the Substrate map, using the plant density map as raster masks, to produce the final Satellite-Style maps.


__________
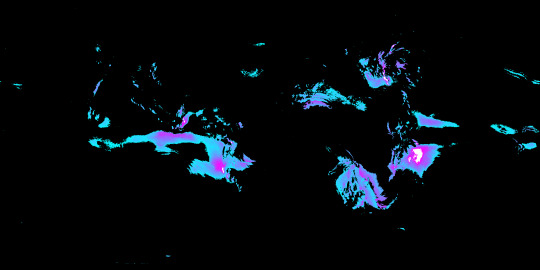
This planet's sophonts being a marine species, it was then worth focusing on the conditions underwater, which included monthly seafloor temperatures (first gif), annual discharge of sediment from rivers (magenta in the 2nd gif), and seasonal upwelling of nutrients from deeper water (blue in the 2nd gif).


The creation of all my maps seen in this post was possible thanks to Photopea, which has been my go-to for several years now. The resolution kinda got crunched when I uploaded these here, so when I share them on Reddit later I'll add those links under this. These have also already been posted on Twitter, which you can see here if you like. Thanks for scrolling all the way down here!
#digital painting#Photopea#digital 3d#Blender#mapmaking#imaginary maps#Runaway to the Stars#Rtts Scuds#speculative planetology#speculative geology#speculative climatology#alien planet#major post#commission#christopher maida artwork#Youtube
771 notes
·
View notes
Text

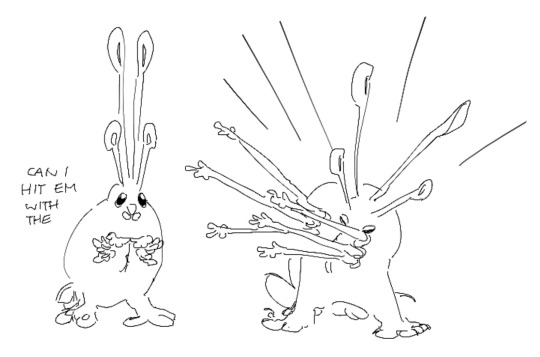
I have made a fan oc for @jayrockin's Runaway to the Stars! And also invented an underwater cigarette! (It's just a lil bug that's got mild poison that you chew on.) I just love scuds so much they are so shaped....
194 notes
·
View notes
Text
Transformers characters but their robot forms are based on spec-bio aliens instead of humans
Ft. crown Soundwave and skimmer avian Starscream
And yes, they still turn into Earth vehicles, because there aren’t any avian plane designs and like hell I’m designing that!


Some extra doodles of Skywarp and Thundercracker, based on Diver and Polar avians respectively, and scud Bumblebee, which I didn’t feel like finishing


Only “lore” I’ve got for this lol

I’m considering this my compromise for going from one of the harder sci-fi genres out there to freaking Transformers, the alien car robot franchise from the 80s that runs entirely on Rule of Cool and The Vibes.
Crowns by @charseraph, avians and scuds by @jayrockin
#I was afraid that crownwave was turning out a little uncanny but I think I clutched it#maybe I’ll design the cassettes if I feel like it#I couldn’t think of an alien I wanted Optimus Prime to be#I feel like I’ve let my chief blorbo down#mashing my interests together like Barbie dolls#my art#spec bio#speculative biology#runaway to the stars#rtts#rtts avians#rtts scuds#crowns#transformers#soundwave#starscream#bumblebee#thundercracker#skywarp#macaddam#maccadam
131 notes
·
View notes
Text

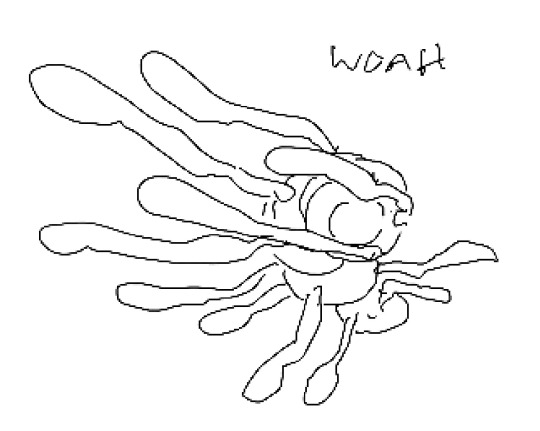
Designed a scud character (by @/jayrockin) last month for art fight. It was my first time drawing a scud and I was going for a swimmer-type. I like the colors but I'm not sure how I feel about the blue.
#he's based of a shrimp character I've already designed#so most of his personality has just been transplanted#he enjoys taking care of small critters and is a generally caring dude#my art#rtts scuds
6 notes
·
View notes
Text

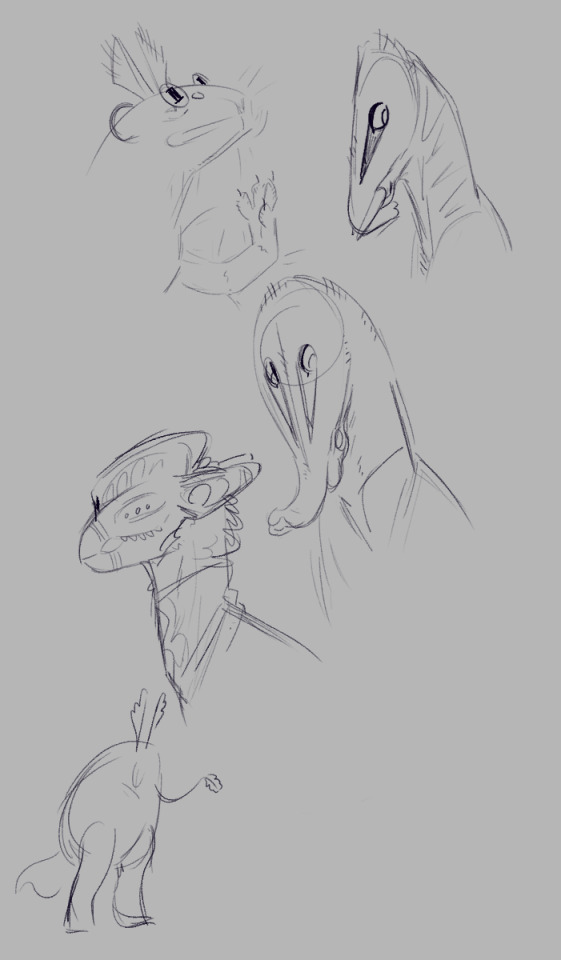

I was wanting to do some rtts fanart the other day and ran out of time. Then just now I found some old doodles from 2021 I barely remember making!
[ID: Some digital sketches of aliens from Runaway to the Stars. Image 1: A couple loose centaur alien sketches. Image 2: Bust sketches of a bug ferret, 2 centaurs and an avian. Plus a little vague scud outline. Image 3: A sketch of 3 centaurs looking down at a human, then coloured bust sketches of each of them. The first is reddish brown with trunk piercings, the second light beige with a lip plate type piercing, and the third is dark brown with white scars across the face. End ID]
#rtts#rtts centaurs#I love rtts so much#I can't believe this is pretty much the only rtts related stuff I've drawn#I need to fix that
25 notes
·
View notes
Text
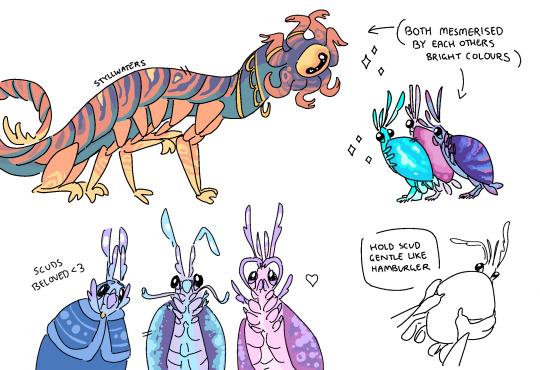
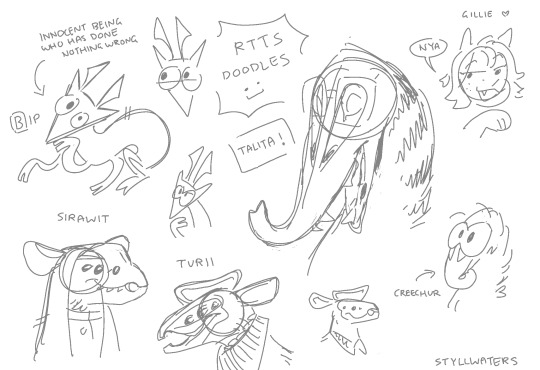
It is a crime that I have not drawn fanart for @jayrockin until now. Their stuff is the COOLEST (its what got me into spec bio in the first place!!)
Here we have some doodles of Scuds! (+ a Sea Crawler because I realized that they would probably get along, being vibrant crustacean-esque scavenger aliens and whatnot)
Below that, little sketches of some rtts characters :>
-
⚠️ Old sea crawler design // Do not reblog ⚠️
#speculative biology#rtts#runaway to the stars#jay eaton#spec bio#art#speculative zoology#talita#scuds#rtts centaurs#rtts avians#fanart#my art#old vivere 44#sea crawlers#speculative evolution
844 notes
·
View notes
Text

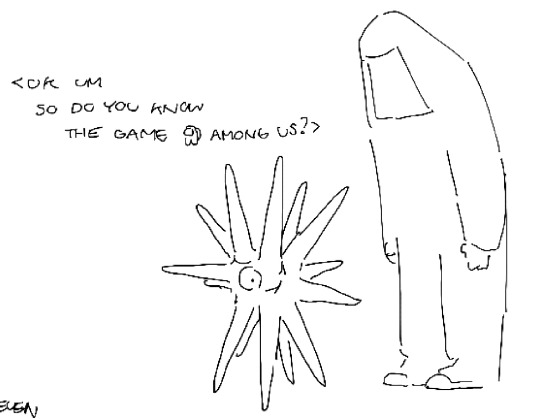
@yellosnacc @jayrockin
#my art#uniima#towers#post-integration elementary school boy type tower#wards#speculative biology#rtts scuds
354 notes
·
View notes
Text
Big ole’ spec bio doodle dump
I’m not entirely sure how old these all are, my best guess is 2024 or maaaaaybe 2023. (probably should click on these for full aspect ratio)


Four below I very much used existing art as a reference for, mostly just for anatomy practice.


In some of these you might catch some of my concepts for my own alien species, which are definitely very outdated at this point.


Doodle of a centaur muppet, and a chibi avian! And, uh, Amogus Crown


Centaurs, scuds, and bug ferrets by @jayrockin and crowns by @charseraph
#my art#speculative biology#spec bio#speculative evolution#aliens#rtts#runaway to the stars#rtts scuds#rtts bug ferret#rtts centaurs#rtts bug ferrets#crowns#doodle#doodle dump
93 notes
·
View notes
Text

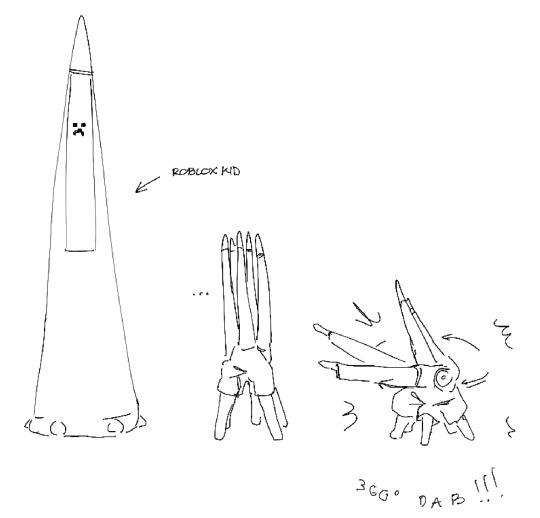
Doodled a bunch of spec-bio aliens as cartoon green aliens. Centaurs, avians, bug ferrets, and scuds by @jayrockin, crowns and boxkites by @charseraph, and birgs by @iguanodont.
#speculative biology#spec bio#alien#aliens#green alien#rtts centaurs#rtts avians#rtts bug ferret#rtts scuds#birgs#crowns#boxkites#my art#geez I already drew it small but tumblr made the quality even worse if you don’t click on it
144 notes
·
View notes
Text
I finally got around to compiling some of the extraneous, in-service-of-the-main-feature maps for the "Runaway to the Stars" Scud-planet commission that I thought were also worth showing, some because they reveal something unique about this planet's qualities, others because they're pretty, and mostly both. There's a good handful of those and a *lot* of explanatory text, so that's all below the cut.
First we have the maps that bridge the gap between wind data and precipitation. This pair of animated maps demonstrates, first, the Orographic effect that would theoretically result from winds blowing in each of the eight cardinal directions across the planet's whole surface, and, second, the Orographic effects which are actually produced by the local prevailing winds for each season. For both of these, darker values mark where the topography prevents moist air from precipitating (a rain shadow, on the leeward side of a raised terrain feature) and lighter values show where the topography catches most of the airborne moisture before the wind blows over it (a rain-highlight, on the windward side of a raised feature).
__________
The first static map, looking like a meticulously customized Jawbreaker, roughly represents the inland distance over which air has to travel from various bodies of water (also accounting for vertical distance in the form of mountains and the sizes of the bodies of water providing the moist air), which is another factor in where rain is able to fall.
__________
Another static map, included entirely for aesthetic reasons, demonstrates (in white) where at least ten times as much rain falls in the wettest month of summer as in the driest month of winter. The cyan end of the gradient represents where only 3 times as much rain falls, in that comparison. This was a step in figuring out what areas would qualify as Dry Winter (climate type Cw) in the climate zone maps, which ended up being completely nonexistent once all the other requirements of that climate type were measured for. All of the areas marked in white (meeting that 10x ratio requirement for Dry Winter) ended up falling under Arid or Semiarid instead.
__________
For comparison, *this* map shows (in cyan through magenta) where there is at least three times as much precipitation in the wettest month of winter as in the driest month of summer, one of the requirements for Mediterranean climate (or Dry Summer, climate type Cs). Not all of the marked areas ended up meeting all requirements for the final climate zone map, either, but at least *some* did, falling just outside the Arid/Semiarid areas.

__________
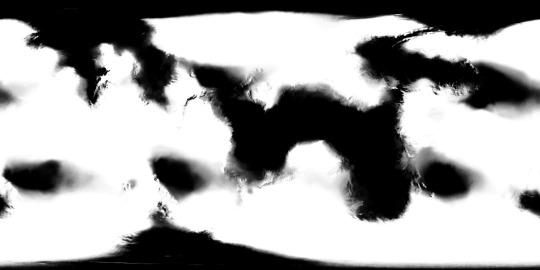
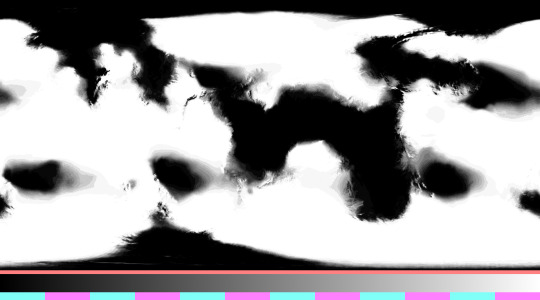
Another precipitation-related map, this one instrumental in figuring out vegetation density, demonstrates the reliability of significant rainfall. Specifically, this represents how many months in a row a given area receives at least 60 millimeters of precipitation per month, with areas in white receiving this amount for every month of the year, areas in black experiencing no months with that much rainfall, and shades of grey showing where this much rainfall persists for anywhere from one to eleven months in a row. The second map attached here shows that data broken down for the exact number of months.
__________
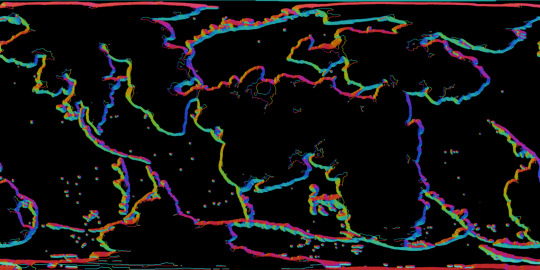
Next, here is a map that helped me find where Upwelling would occur seasonally. Since material from deeper waters is brought to the surface by the general movement of water *away from* the coasts, and since water is moved in that direction by winds blowing *perpendicular to* the coasts (counterclockwise for the northern hemisphere on a retrograde-spin planet like this, and clockwise for its southern hemisphere), it was crucial that I first determine what directions the coasts themselves were facing, with red marking coasts that face north, yellow for coasts that face west, cyan for coasts facing south, and blue for those facing east. This particular map was produced by taking a blurred elevation map of the shallows, using it as the displacement texture for a flat Plane in Blender, and pointing different colored lights at it from the eight cardinal directions.
__________
One of the very last elements that I mapped out for this planet was the discharge of sediments from the rivers into seas and terminal lakes, which required a *lot* of steps. The first of these was to isolate the different major drainage basins that would deliver water to various sections of the coastal shallows, as seen in the first, multicolored map. In the second map, we see the surface areas of each of the drainage basins, in the third map we see the average density of vegetation within each basin, and in the final map I've combined this data to show the overall total amount of vegetation in each basin, which should roughly correlate with how much organic material ends up washing out to sea, since river discharge volume and vegetation density are both (largely) contingent on the same factor: precipitation.


All told this is only a tiny fraction of the maps that were part of the overall pipeline. On Reddit you should be able to see these images in higher resolution, so I'm including a link to the corresponding post here
#digital painting#Photopea#mapmaking#imaginary maps#Blender#speculative climatology#Runaway to the Stars#RttS Scuds#alien planet#major post#commission#christopher maida artwork
19 notes
·
View notes
Text
youtube
I have just now finished a video where I played some of the animated maps for this project on a globe in Blender, so here's that now too! Since the first published aspect of this project was a video, it's only fair that a video should be the *last* thing I share about it. Just the wonderful continuity of a bookend. Animated maps exported from Photopea, edited together in ClipChamp, used as textures for a sphere in Blender, from which I directly exported video elements, and, finally, spliced and narrated and captioned in ClipChamp once again. 2024
youtube
This video showcases my Blender model of the planet that the Scud aliens call home, the fourth and final world I've mapped out for @jayrockin's "Runaway to the Stars" project. A *lot* of maps were created in service of this final render, and also in service of presenting the special qualities of this planet. I intend to show you as many of these as I can under the cut, and also in subsequent posts focusing on some of the more interstitial, ancillary maps and figures that played a part in producing the primary maps you'll see in this main post.
Before I show the first maps I made for this project, what you see below are the satellite-style maps for the Equinoxes and Solstices, in order of (Northern) Spring, Summer, Fall, and Winter, the latter serving as the texture for the Blender object you saw in the video.
__________
With that matter covered, our next focus is this project's foundation: Geology. While I didn't spin as elaborate a tectonic history for this planet as I did for the Ayrum commission, I did work out as much detail as I could for the more recent geological activity, to set the stage for the elevation data - including a narrower focus on the coastal shallows that host the Scud populations.
__________
Once I could move on to climate, my first step was finding this planet's relative Insolation, which I managed thanks to @reversedumbrella's code and coaching. With an obliquity of only 16 degrees, this planet's yearly maximum Insolation levels stick close to the equator, compared to pole-to-pole oscillation we see on Earth
__________
Having a rough sense of where heat would concentrate seasonally and how the landmasses would deflect water in light of the planet's retrograde spin, I was able to set down the bi-annual ocean currents (Northern Summer above and Northern Winter below), then the monthly water temperatures pushed around by said currents, and finally -after factoring in many other considerations- the monthly land temperatures as well (combined in the second gif)
__________
Next came the seasonal air pressure maps and subsequent wind patterns (my first time creating those from scratch), which later factored into the precipitation maps. The incredible temperatures at the largest continent's interior make a desert of most of it, and the other interiors are fairly dry too, but all that heat on the equatorial ocean generates a *lot* of evaporation which ends up coming down elsewhere.
__________
With temperatures and precipitation mapped out for each month, I was able to find how the accumulation and melt of ice and snow played out, too. Given such a hot equator it's surprising to see freezing temperatures hold out in some places, but low obliquity and high elevation shield what areas they can, it seems.
__________
All this monthly data was then painstakingly combined and compared and plugged into equations to produce maps of discrete climate zones, using both the Köppen (left) and Trewartha (right) classification systems. The higher latitudes see some overlap with Earth's conditions, but the Tropics...
__________
I never really finished the map I wanted to make with my own loosely customized classification system, but I *did* get as far as this breakdown of the areas that sometimes surpass 56.7 degrees Celsius, Earth's record for highest surface temperature ever directly measured. And as you can see, that earthly record is broken by a *significant* fraction of this planet's surface, and far exceeded by the equatorial continent's deep interior
__________
The final phase of this project dealt with creating satellite maps of this planet's surface (which you saw at the top of this post), which started with a map of dry and submerged substrate, then a density map of the vegetation that sits atop it, then the colors of that vegetation under annual average conditions (demonstrating how they would appear in-person, rather than the area's appearance from orbit), and finally plant colors under seasonal conditions (same conceit as previous). In concert with the seasonal ice and snow maps, it was the four maps in the last sequence which were overlaid on the Substrate map, using the plant density map as raster masks, to produce the final Satellite-Style maps.
__________
This planet's sophonts being a marine species, it was then worth focusing on the conditions underwater, which included monthly seafloor temperatures (first gif), annual discharge of sediment from rivers (magenta in the 2nd gif), and seasonal upwelling of nutrients from deeper water (blue in the 2nd gif).
The creation of all my maps seen in this post was possible thanks to Photopea, which has been my go-to for several years now. The resolution kinda got crunched when I uploaded these here, so when I share them on Reddit later I'll add those links under this. These have also already been posted on Twitter, which you can see here if you like. Thanks for scrolling all the way down here!
#video#Blender#animated maps#mapmaking#imaginary maps#runaway to the stars#rtts scuds#Photopea#youtube#video editing#voiceover#my voice#christopher maida artwork#Youtube
771 notes
·
View notes