#TableauDashboard
Text
Tableau: Display Top N & Bottom N Customers using FIRST() and LAST()
Discover the step-by-step process of displaying both the top n and bottom n customers on a single sheet. Utilize the power of FIRST and LAST functions to efficiently showcase your data and gain valuable insights.
#analyticspro#analytics#dataAnalytics#dataViz#scenario#interview#visualization#vizualization#dashboard#bi#businessintelligence#reporting#tableau#tableaudeveloper#Tableaudesktop#tableauinterview#tableautips#datavisualization#tableaudashboard#bar#chart#topn#top5#bottomn#bottom5#data#first#last#function
0 notes
Text
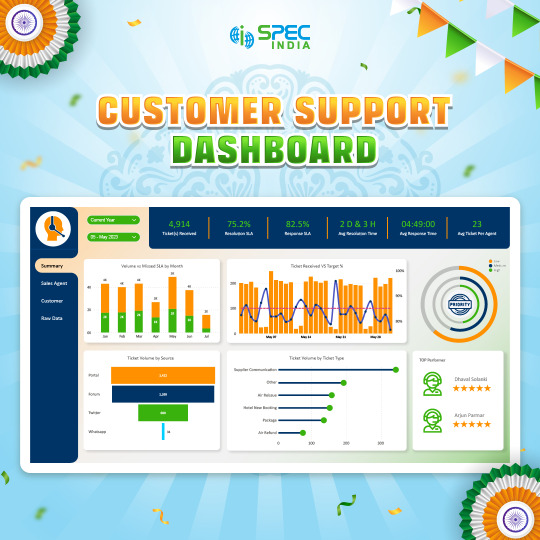
Businesses face various challenges to achieve adequate customer support due to challenges like unable to measure performance, inconsistency of information, high volume inquiries during peak periods, delayed resolution of escalated cases, lack of variety of communication channels, and more.
SPEC INDIA's Customer Support Dashboard is your ultimate solution!
Better manage valuable information collected from your customers with a striking real-time visual data format. Our dashboard not only provides you a bird’s eye view of KPIs like avg. resolution time, avg. response time, and more, would help create better strategies and make insightful business decisions.
Check our Dashboards by visiting our Live Visualizations Page
0 notes
Photo

Create a variety of fully interactive and actionable Tableau dashboards that will inform and impress your audience! Enhance your skills in Tableau Give a call now for a free demo at 9966085577 or Visit: https://skildgrad.com/courses/tableau/ #SkildGrad #onlinecourse #onlinetraining #TableauSoftware #Tableau #dataanalysis #dataanalyst #businessanalysis #TableauWorkshop #TableauDesktop #TableauServer #TableauOnline #tableaudashboard #dashboard #tableau #dashboardlayout #dashboardlayout #analyzing https://www.instagram.com/p/CjSY_v1vRhm/?igshid=NGJjMDIxMWI=
#skildgrad#onlinecourse#onlinetraining#tableausoftware#tableau#dataanalysis#dataanalyst#businessanalysis#tableauworkshop#tableaudesktop#tableauserver#tableauonline#tableaudashboard#dashboard#dashboardlayout#analyzing
0 notes
Link
Data Analytics OEM Strategy- Infometry helps SaaS customers in building Cloud Data Integration (CDI) platform and analytics solution by OEM’ing industry leader solutions like Informatica Cloud, Dell Boomi, Tableau, Looker. Our team work closely with product marketing, product management, solution architects and support team to build re-usable components, security implementation, seamless deployment, and support process. Contact Us :- [email protected]
1 note
·
View note
Photo

Portal Development and Tableau Dashboard Integration
Tableau BI Integration with Web Portal to publish various Analytics through Dashboards - A US Based Healthcare Service Provider.
https://goo.gl/8Ix6AJ
Make your next BEST business decision with Tableau BI.
#tableau#tableaudashboard#tableaubi#tableaubusinessintelligence#tableaudashboards#tableaubidashboard#tableaubidashboards#businessintelligence#bi#bidashboard#bidashboards#businessintelligencedashboards#zend#zend framework#php
0 notes
Photo

Build a Stacked Donut Chart in Tableau http://ehelpdesk.tk/wp-content/uploads/2020/02/logo-header.png [ad_1] You ever wanted to stack 4 pie c... #agile #amazonfba #analysis #analytics #anthonysmoak #business #businessfundamentals #businessintelligence #datavisualization #excel #financefundamentals #financialanalysis #financialmodeling #forex #investing #microsoft #pmbok #pmp #realestateinvesting #sql #stocktrading #tableau #tableaubarchart #tableaucharts #tableaudashboard #tableaupublic #tableausaleschart #tableautips #tableautraining #tableauyoutube
0 notes
Link
0 notes
Video
youtube
Tableau Live - 1 | Tableau Dashboard Tutorial | Tableau Tutorial | #Tableau #Edureka #DataScience #DataAnalytics #Tableau #TableauEdureka #TableauDashboard #TableauTraining #TableauTutorial #TableauCertification #TableauArchitecture 🔥Edureka Tableau Certification Training: Edureka Tableau Dashboard Tutorial (Tableau Dashboard Blog: helps you understand how to make visualizations and create a Tableau Dashboard.
#dashboard in tableau#data visualization tutorial#edureka#Tableau#tableau cerification#tableau dashboard#tableau dashboard actions#tableau dashboard containers#tableau dashboard creation tutorial#tableau dashboard demo#tableau dashboard design#tableau dashboard examples#tableau dashboard tutorial#tableau desktop#tableau edureka#tableau public#tableau reader#tableau server#tableau training for beginners#tableau tutorial#tableau tutorial for beginners#yt:cc=on
0 notes
Text
Tableau: Dynamically Switch / Swap Sheets using Parameter
Allow users to switch / swap displayed sheets, visuals or charts within a Tableau dashboard based on their selection using parameters.
#analyticspro#analytics#dataAnalytics#dataViz#visualization#vizualization#dashboard#bi#businessintelligence#reporting#tableaudashboard#tableau#tableaudeveloper#Tableaudesktop#tableauinterview#tableautips#datavisualization#dynamic#switch#swap#line#bar#map#sales#charts#chart#data#sql#parameter#sheets
0 notes
Text
Tableau: Data visualization with PIE chart
#analyticspro#analytics#dataAnalytics#dataViz#visualization#vizualization#dashboard#bi#businessintelligence#reporting#tableaudashboard#tableau#tableaudeveloper#Tableaudesktop#tableauinterview#tableautips#datavisualization#pie#charts#chart#data#tableautricks#youtube#video#sql
0 notes
Text
Tableau: Top N & Bottom N Customers using RANK_DENSE() & WINDOW_MAX()
Discover the step-by-step process of displaying both the top n and bottom n customers on a single sheet. Utilize the power of rank and window_max functions to efficiently showcase your data and gain valuable insights.
#analyticspro#analytics#dataAnalytics#dataViz#scenario#interview#visualization#vizualization#dashboard#bi#businessintelligence#reporting#tableau#tableaudeveloper#Tableaudesktop#tableauinterview#tableautips#datavisualization#tableaudashboard#rank#dense#window#max#bar#chart#topn#top5#bottomn#bottom5#data
0 notes
Text
Tableau: Pie Chart with Top Segments and 'Others'
Watch how Tableau transforms complex customer sales data into a clear and concise Pie Chart, highlighting top segments and grouping the rest as 'Others.'
#analyticspro#analytics#businessintelligence#data#tableau#visualization#dataAnalytics#dataViz#vizualization#dashboard#bi#reporting#tableaudashboard#tumblr#tableaudeveloper#Tableaudesktop#tableauinterview#tableautips#tableautricks#datavisualization#sales#chart#visual#scenario#interview#pie#top10#others#Top11to50#youtube
1 note
·
View note
Photo

This data visualisation tool has been utilised by the business intelligence sector ever since it was first developed. Tableau is widely used by businesses like Amazon, Walmart, Accenture, Lenovo, and others. Follow us for more interesting tips career If you wants to excel your career in Tableau, give a call now for a free demo Contact: 9966085577 or Visit: https://skildgrad.com/courses/tableau/ #SkildGrad #onliencourse #TableauSoftware #Tableau #datarock #data #datalover #dataanalytics #dataanalysis #dataanalyst #businessanalysis #businessanalytics #businessanalyst #businessintelligence #datarockstar #datahero #TableauWorkshop #TableauDesktop #TableauServer #TableauOnline #datavizualisation #tableaudashboard https://www.instagram.com/p/CiRsCtGvCXJ/?igshid=NGJjMDIxMWI=
#skildgrad#onliencourse#tableausoftware#tableau#datarock#data#datalover#dataanalytics#dataanalysis#dataanalyst#businessanalysis#businessanalytics#businessanalyst#businessintelligence#datarockstar#datahero#tableauworkshop#tableaudesktop#tableauserver#tableauonline#datavizualisation#tableaudashboard
0 notes
Photo
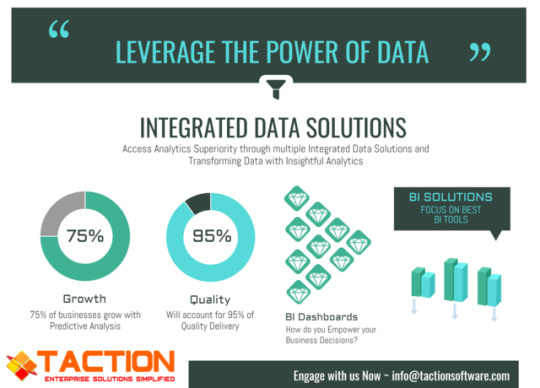
Leverage the Power of Data! Empower your Business Decisions with Insightful Data Driven BI Dashboards.
Access Analytics Superiority through Multiple Integrated Data Solutions - https://goo.gl/cIKiyk
Engage with us Now - https://goo.gl/PgrWZu
#tableau#businessintelligence#bi#dashboard#bidashboard#tableaudashboard#oraclebi#pentaho#pentaho development#data analysis#data and analytics#data analytics
0 notes
Photo

Use Parameters to Custom Sort a Tableau Dashboard http://ehelpdesk.tk/wp-content/uploads/2020/02/logo-header.png [ad_1] In this tutorial we'll create a ... #agile #amazonfba #analysis #analytics #anthonysmoak #business #businessfundamentals #businessintelligence #datavisualization #excel #financefundamentals #financialanalysis #financialmodeling #forex #investing #microsoft #pmbok #pmp #realestateinvesting #sql #stocktrading #tableau #tableaubarchart #tableaucharts #tableaudashboard #tableaudashboardactions #tableaudashboarddesign #tableaupublic #tableautips #tableautraining #tableauyoutube
0 notes
Photo

Tableau Dashboard Design | Coronavirus Analysis http://ehelpdesk.tk/wp-content/uploads/2020/02/logo-header.png [ad_1] TABLEAU DASHBOARD DESIGN | CORON... #agile #amazonfba #analysis #business #businessfundamentals #coronavirusdata #covid-19 #dashboarddesign #dataanalysis #datavisualization #excel #financefundamentals #financialanalysis #financialmodeling #forex #investing #microsoft #pmbok #pmp #realestateinvesting #sql #stocktrading #tableau #tableaudashboard #tableaudashboarddesign #tableausoftware #thecareerforce
0 notes
Last Seen Blogs


yellowberkeleycabusa
Yellow Berkeley Cab

todaysspain
Today’s Spain

frail-fern
FRAILFERN

largando
Untitled