#tableaudesktop
Explore tagged Tumblr posts
Text
Industry-Leading Visualization with Tableau Data Visualization

1. User-Friendly Interface: The intuitive design allows anyone to easily start visualizing data.
2. Seamless Integration: Connects easily with various data sources for efficient analysis.
3. Quick Insights: Generate actionable insights within minutes.
4. Integrated Collaboration Tools: Share dashboards and insights with your team effortlessly.
5. Regular Updates: Tableau continuously evolves with new features and improvements.
Want to take your skills to the next level? Join our 1-day Tableau Bootcamp on 2nd November (Online)!
#tableau#tableau software#data visualization#data visualisation#dataviz#software#technology#cavillion#cavillion learning#data analytics#data#tableau online training#tableaudesktop#tableau dashboard#big data#business analytics#data analysis#data science#tableau course#salesforce#Tableau Tutorial#Tableau Visualization#Tableau Training#learn tableau#tableau certification#Tableau Visualisation
1 note
·
View note
Text
Tableau: Display Top N & Bottom N Customers using FIRST() and LAST()
Discover the step-by-step process of displaying both the top n and bottom n customers on a single sheet. Utilize the power of FIRST and LAST functions to efficiently showcase your data and gain valuable insights.
#analyticspro#analytics#dataAnalytics#dataViz#scenario#interview#visualization#vizualization#dashboard#bi#businessintelligence#reporting#tableau#tableaudeveloper#Tableaudesktop#tableauinterview#tableautips#datavisualization#tableaudashboard#bar#chart#topn#top5#bottomn#bottom5#data#first#last#function
0 notes
Text
Tableau certification with training in Noida
A computer science study at Stanford that sought to enhance the flow of analysis and increase data accessibility for individuals led to the founding of Tableau in 2003. Tableau’s core technology, VizQL, was created and patented by its co-founders Chris Stolte, Pat Hanrahan, and Christian Chabot. VizQL visually expresses data by converting drag-and-drop operations into data queries via an intuitive interface. Since our founding, we have consistently made unmatched investments in research and development, creating solutions to assist anyone working with data in finding answers more quickly and discovering unexpected insights.
One of the most well-liked tools for business intelligence and data visualization that aids in seeing and comprehending data is Tableau. To gain meaningful insight from the data, it is helpful to develop interactive graphs and charts in the form of a dashboard and spreadsheet. It enables us to quickly assess trends graphically and decide. Its primary applications are: 1. Data exploration and analysis 2. Development of dashboards 3. Production of reports 4. Data storytelling 5. Predictive modelling 6. Joint analysis of data 7. Data visualisation 8. Analyzing data in real-time
From past few years, APPWARS Technologies has been regarded as Noida’s top Tableau training facility. It aims to provide high-quality training in various situations. Consequently, joining APPWARS Technologies will be a wise career decision if you too want to learn more in-depth knowledge about Tableau. You can learn how to create graphics and organize data using their Tableau certification program. You will be able to make more insightful business selections if you use these abilities. Tableau is a fantastic tool for visualizing data, and this course will teach you how to map data. Additionally, you will comprehend how ideas like statistics and data mapping relate to Tableau and how they might enhance your proficiency with it.
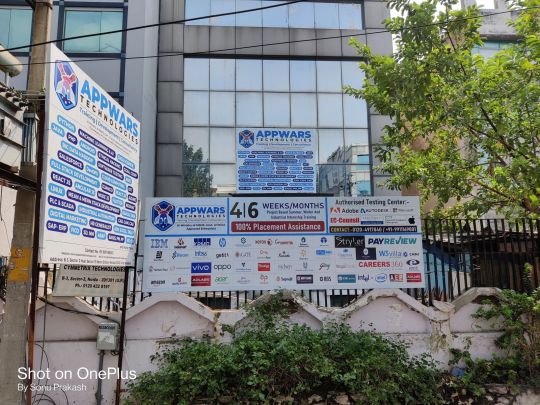
Here is the link to connect with APPWARS Technologies :- https://appwarstechnologies.com/tableau-training-in-noida/
#TableauSoftware#Tableau#datarock#data#datalover#dataanalytics#dataanalysis#dataanalyst#bitool#businessanalysis#businessanalytics#businessanalyst#businessintelligence#datarockstar#datahero#TableauConference#TableauWorkshop#TableauDesktop#TableauServer#TableauOnline#dataviz#datavizualisation#TableauDashboard#Dashboard#vizable#viz#bigdata#datapluswoman#womanindata
0 notes
Photo
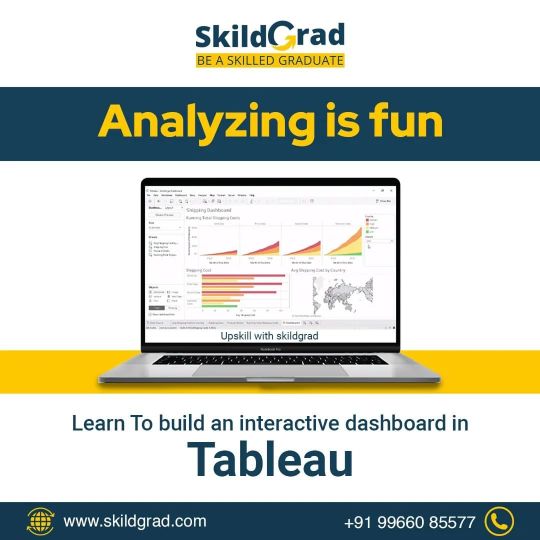
Create a variety of fully interactive and actionable Tableau dashboards that will inform and impress your audience! Enhance your skills in Tableau Give a call now for a free demo at 9966085577 or Visit: https://skildgrad.com/courses/tableau/ #SkildGrad #onlinecourse #onlinetraining #TableauSoftware #Tableau #dataanalysis #dataanalyst #businessanalysis #TableauWorkshop #TableauDesktop #TableauServer #TableauOnline #tableaudashboard #dashboard #tableau #dashboardlayout #dashboardlayout #analyzing https://www.instagram.com/p/CjSY_v1vRhm/?igshid=NGJjMDIxMWI=
#skildgrad#onlinecourse#onlinetraining#tableausoftware#tableau#dataanalysis#dataanalyst#businessanalysis#tableauworkshop#tableaudesktop#tableauserver#tableauonline#tableaudashboard#dashboard#dashboardlayout#analyzing
0 notes
Text

Many people say Tableau is the best tool to master data visualization. Although debatable, they are right! Tableau is quick, easy to learn, and has an incredible UI. The tool’s creative features allow you to get invaluable insight from data that would drive key business decisions. To learn how to master in Tableau,
Contact info:
Call: +1 732-485-2499
Email: [email protected] | WhatsApp: https://wa.me/17324852499
#hachion#tableau#tableauonlinetraining#tableautraining#tableaucourse#tableaudeveloper#tableaudesktop#usa#usaindians
0 notes
Photo
Tableau 10 Advanced Training: Master Tableau in Data Science.Tableau 10 in Data Science by solving Real-Life Analytics Problems. Learn Visualisation and Data Mining by doing!The basic course "Tableau 10 A-Z: Hands-On Tableau Training For Data Science!" is a pre-requisite. Interested people can share me your details. Check our Info : www.incegna.com Reg Link for Programs : http://www.incegna.com/contact-us Follow us on Facebook : www.facebook.com/INCEGNA/? Follow us on Instagram : https://www.instagram.com/_incegna/ For Queries : [email protected] #tableau,#datascience,#businessanalyst,#powerbi,#visualization.#datamining,#tableaudesktop,#tableaucalculationfilters,#python,#datavisualization,#dynamicsets,#microsoftpowerbidesktop https://www.instagram.com/p/B8OclIXA_2a/?igshid=1a4ryt2dir3z0
#tableau#datascience#businessanalyst#powerbi#visualization#datamining#tableaudesktop#tableaucalculationfilters#python#datavisualization#dynamicsets#microsoftpowerbidesktop
0 notes
Text
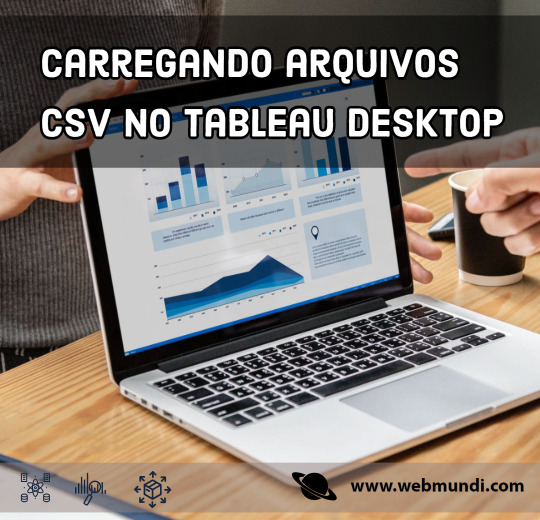
Carregando arquivos CSV no Tableau Desktop
https://www.webmundi.com/banco-de-dados/carregando-arquivos-csv-no-tableau-desktop/
#bigdata #datascience #ai#ia #machinelearning #analytics #BI #bigdata #BusinessIntelligence #data #dataanalysis #dataanalytics #datascientist #datavisualization #Developer #inteligenciadenegocios #TableauDesktop #Tableau
0 notes
Photo

✍️Enroll Now: https://forms.gle/6PA5g9JfKNqH5dhM7 🔥Special Offer Rs. 8,000/- Only 👉Attend Online Demo on Tableau By Real-Time Expert | Sriman IT 📅Start Date: 30th August @ 8:00 PM IST For More Details: Call: +91-9985014433 WhatsApp: 9985024433 📪Email: [email protected] 🌐Website: www.srimanit.com 📩Join us on Telegram : https://t.me/sriman_it 📩Subscribe Our YouTube Channel : https://www.youtube.com/channel/UC26qAebkJyZ-e7k26refLVA 📩Join us on Facebook : https://www.facebook.com/SrimaniTech/ 📩Join us on Instagram : https://www.instagram.com/sriman_it/ 📩 Join us on Twitter : https://twitter.com/sriman_it 💥Features of Online Training ✅ Real-Time Oriented Training ✅ Live Training Sessions ✅ Interview Preparation Tips ✅ FAQ’s #tableau #tableaututorial #tableaututorialfromscratch #tableautraining #tableautrainingforbeginners #tableauonlinetraining #tableauinterviewquestions #tableaucourse #tableauproject #tableauforbeginner #tableaubasics #tableauserver #tableauservertraining #tableaucertification #tableaucertificationtraining #datarock #datalover #dataanalytics #dataanalysis #dataanalyst #bitool #businessanalysis #businessanalytics #businessanalyst #businessintelligence #tableauconference #tableworkshop #tableaudesktop #tableauserver #tableauonline (at Hyderabad) https://www.instagram.com/p/CTHhWDipH5O/?utm_medium=tumblr
#tableau#tableaututorial#tableaututorialfromscratch#tableautraining#tableautrainingforbeginners#tableauonlinetraining#tableauinterviewquestions#tableaucourse#tableauproject#tableauforbeginner#tableaubasics#tableauserver#tableauservertraining#tableaucertification#tableaucertificationtraining#datarock#datalover#dataanalytics#dataanalysis#dataanalyst#bitool#businessanalysis#businessanalytics#businessanalyst#businessintelligence#tableauconference#tableworkshop#tableaudesktop#tableauonline
0 notes
Photo

What is Tableau? | A Tableau Overview http://ehelpdesk.tk/wp-content/uploads/2020/02/logo-header.png [ad_1] Tableau helps people see and und... #agile #amazonfba #analysis #analytics #analyticsplatform #business #businessanalysis #businessanalysistool #businessanalytics #businessanalyticsplatform #businessdashboards #businessfundamentals #businessintelligence #cloudapplication #dataanalysis #dataanalytics #dataanalyticstool #datavisualization #excel #financefundamentals #financialanalysis #financialmodeling #forex #investing #microsoft #pmbok #pmp #realestateinvesting #sql #stocktrading #tableau #tableaudesktop #tableauonline #tableauoverview #tableauprep #tableauserver #tableausoftware #visualanalytics #visualdata #whatistableau
0 notes
Text
Tech Tip Tuesday: Boost Tableau Performance with Context Filters

Boost the performance of your Tableau dashboards by using Context Filters! ⚡ This trick helps you manage multiple filters more efficiently, making your data visualisations faster and smoother.
#tableau#tableau dashboard#tableau software#data visualization#data analytics#software#big data#dataviz#technology#cavillion#cavillion learning#data#tableaudesktop#tableau online training#tech tip tuesday#tech tips#tableau course#tableau certification#data visualisation#Tuesday Tip#salesforce
1 note
·
View note
Text
Tableau: Dynamically Switch / Swap Sheets using Parameter
Allow users to switch / swap displayed sheets, visuals or charts within a Tableau dashboard based on their selection using parameters.
#analyticspro#analytics#dataAnalytics#dataViz#visualization#vizualization#dashboard#bi#businessintelligence#reporting#tableaudashboard#tableau#tableaudeveloper#Tableaudesktop#tableauinterview#tableautips#datavisualization#dynamic#switch#swap#line#bar#map#sales#charts#chart#data#sql#parameter#sheets
0 notes
Video
youtube
#Tableau Tutorial for Beginners | Tableau Introduction | Session 1
Hi Friends,
If you are a graduate, fresher or a experienced professional , thinking to learn latest technologies , then this is an awesome chance for you. Because am going to share a beginner and advanced course for free here regularly on Tableau. Wonder what Tableau is 1 Tableau is a business intelligence tool which helps us to plot numbers in to visuals and helps us understand millions of records at a glance. Why late ? Start clicking the link and get started with your journey of learning the cutting edge technology.
Feel free to post your questions or doubts in the comments section. Don’t forget to like, share and subscribe.
Thanks for watching. Have a nice day and check this space often :)
#youtube#tableau#salesfore#excel#tableau training#tableausoftware#tableaudesktop#business intelligence#data analysis#data analyst course#bi tools#data#data visualization#viz#interview tips for freshers#fresherjobs#freecourses#freecourse
1 note
·
View note
Text
UDEMY Tableau Desktop Specialist Certification Practice Tests 2020 for FREE
New Post has been published on https://netsmp.com/2020/07/14/udemy-tableau-desktop-specialist-certification-practice-tests-2020-for-free/
UDEMY Tableau Desktop Specialist Certification Practice Tests 2020 for FREE
https://www.udemy.com/course/tableaudesktop/?couponCode=FREE2020 https://www.udemy.com/course/tableaudesktop/?couponCode=FREE2020
0 notes
Photo
This data visualisation tool has been utilised by the business intelligence sector ever since it was first developed. Tableau is widely used by businesses like Amazon, Walmart, Accenture, Lenovo, and others. Follow us for more interesting tips career If you wants to excel your career in Tableau, give a call now for a free demo Contact: 9966085577 or Visit: https://skildgrad.com/courses/tableau/ #SkildGrad #onliencourse #TableauSoftware #Tableau #datarock #data #datalover #dataanalytics #dataanalysis #dataanalyst #businessanalysis #businessanalytics #businessanalyst #businessintelligence #datarockstar #datahero #TableauWorkshop #TableauDesktop #TableauServer #TableauOnline #datavizualisation #tableaudashboard https://www.instagram.com/p/CiRsCtGvCXJ/?igshid=NGJjMDIxMWI=
#skildgrad#onliencourse#tableausoftware#tableau#datarock#data#datalover#dataanalytics#dataanalysis#dataanalyst#businessanalysis#businessanalytics#businessanalyst#businessintelligence#datarockstar#datahero#tableauworkshop#tableaudesktop#tableauserver#tableauonline#datavizualisation#tableaudashboard
0 notes
Text

Many people say Tableau is the best tool to master data visualization. Although debatable, they are right! Tableau is quick, easy to learn, and has an incredible UI. The tool’s creative features allow you to get invaluable insight from data that would drive key business decisions. To learn how to master in Tableau,
Contact info:
Call: +1 732-485-2499
Email: [email protected] | WhatsApp: https://wa.me/17324852499
#hachion#tableau#tableauonlinetraining#tableautraining#tableaucourse#tableaudeveloper#tableaudesktop#usa#usaindians
0 notes
Photo

Tableau for Beginners: Get Certified,Jump into data visualization with hands-on exercises.Create bar charts, pie charts, and line graphs.Create trend lines and understand the relevant statistical metrics such as p-value and R-squared.Create a dynamic dashboards combining multiple worksheets. Interested People can share me your details. Check our Info : www.incegna.com Reg Link for Programs : http://www.incegna.com/contact-us Follow us on Facebook : www.facebook.com/INCEGNA/? Follow us on Instagram : https://www.instagram.com/_incegna/ For Queries : [email protected] #tableau,#datavisualization,#barcharts,#piecharts,#datasources,#dataanalysis,#statistical,#pvalued,#Rsquare,#DataAggregation,#tableaudesktop,#WebAuthoring,#datablending https://www.instagram.com/p/B60Fi-agt5S/?igshid=1m7wep4cf3xdk
#tableau#datavisualization#barcharts#piecharts#datasources#dataanalysis#statistical#pvalued#rsquare#dataaggregation#tableaudesktop#webauthoring#datablending
0 notes