#Technical Indicator Analysis
Text
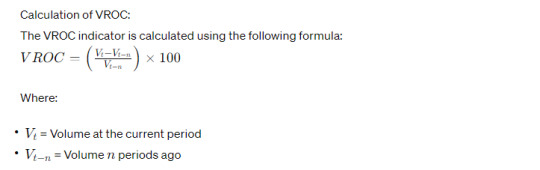
Understanding the Volume Rate of Change (VROC) Indicator: A Powerful Tool for Traders
Introduction to Volume Rate of Change:
In the world of financial markets, traders are constantly seeking ways to gain insights into market movements and make informed decisions.
Among the plethora of technical indicators available, the Volume Rate of Change (VROC) stands out as a powerful tool for analyzing volume dynamics. In
this blog post, we will delve into what the VROC indicator is, how…
View On WordPress
#Advanced Trading Indicators#Breakout Trading#Market Analysis#Market Momentum Signals#Momentum Oscillator#Price movements#Price Volume Relationship#technical analysis#Technical Indicator Analysis#Trading Indicators#Trading Signals Interpretation#Trading Strategies#Trading Volume Dynamics#Trend reversals#Volume Analysis Strategies#Volume Analysis Techniques#Volume Based Trading#Volume Rate of Change#Volume Rate of Change Strategy#VROC
0 notes
Note
wanna ask how you feel about the eridan bpd headcanon/theory(?? not sure what to call it!) you're so good at your character analysis and i'd love to see your outlook on it
Since I don't have a degree or any formal training in psychology, I feel deeply uncomfortable diagnosing characters. I've made an autism joke before but only because I'm on the spectrum. He's definitely traumatized and anxious, but I mean those as descriptors of his behavior rather than capital-D Diagnoses. I try to focus on those when I can - the cause and effect of cognition, self-image, and behavior - and those factors may very well match up with DSM criteria, but I try not to touch an actual diagnosis with a ten foot pole unless the author has explicitly stated that X character has Y condition.
#there's a variety of reasons for this#part of it is that im GROSSLY unqualified to be handing out diagnoses when it takes a full on PhD to do that in real life#part of it is that psychology is inchoate and we are still very much in murky waters#for example: complex ptsd isn't even IN the DSM yet#and iirc my therapist told me it was because theyre still figuring out how to classify it (attachment disorder? trauma disorder? etc.)#part of it is that (from my limited and undereducated understanding) there are diagnoses that you can assign by completing a checklist...#but some that require a hell of a lot more testing and ruling out other potential causes#and the cluster-b personalities are (IIRC) not even ones you're supposed to diagnose minors with#bc of fears of self fulfilling prophecy and because minors in general are still developing personalities In General#and like the fact that i can't say that with authority speaks to how unqualified i am to do any diagnosing right? hahaha#and part of it is just because like#unless the story is specifically About That and the author has stated so explicitly#i think diagnosing characters tends to put blinders on analysis#like if i were to seriously go 'eridan is autistic' then it would massively bias my reading and understanding of his character#and we have 0 indication that eridan was ever explicitly intended to be autistic or that the author was trying to do an autism specifically#that doesn't mean that the reading is invalid because like thats what death of the author means#all readings are technically valid including stuff the author didn't necessarily intend#but that's just not the way i like to engage with media and not the way i like to approach character analysis#because PERSONALLY it just feels kind of reductive - but also -#i'd wager MOST of us don't have degrees in psychology#so when i say 'X character has Y condition' it might mean something totally different to somebody reading my analysis#even people who have Y condition aren't exempt because a lot of mental illnesses differ from person to person#whereas if i explain “X character has Y thoughts and Z behaviors” there's no ambiguity in that#eridan struggles with noticing that people are suffering and with realizing that he should care#at least part of this is due to his horrific murder-filled upbringing which rendered empathy a detriment & so he learned to ignore it#it could be autism - but it could also be trauma -#or he might just be Like That without actually meeting the diagnostic criteria for autism#& you can't even technically be diagnosed with C-PTSD#or maybe he has a burgeoning personality disorder but you aren't supposed to DX those too early anyway#or maybe hes just 13. see what i mean hahaha. ive reached the 30 tag limit
24 notes
·
View notes
Text
Importance of chart analysis for equity investments
Image by freepik
Chart analysis, or technical analysis, can be quite helpful for equity investment in the Indian stock market. Here are several reasons why it is beneficial:
Benefits of Chart Analysis in the Indian Stock Market
1.Trend Identification
The Indian stock market, like any other, exhibits trends over time. Chart analysis helps in identifying these trends, allowing investors to ride…
#chart analysis#equity investment#Financial Markets#Indian stock market#investment strategies#market analysis#Market Sentiment#Stock Charts#Stock Market#Stock Trading#Support and Resistance#Technical Analysis#Technical Indicators#Trading Patterns#Trend Identification#Volume Analysis
3 notes
·
View notes
Text
Volume Indicators: How to Use Them in Trading
Volume indicators are essential tools for traders seeking to understand market activity and potential price movements. These indicators provide insights into the strength and direction of trends by analyzing trading volume. This article explores how volume indicators work, their benefits, and how traders can effectively use them in their strategies.
What Are Volume Indicators?
Volume indicators…
#Downtrend#Entry and Exit Points#Liquidity#Market Analysis#Market Conditions#Market Sentiment#OBV#On-Balance Volume#Price Action#Price Movement#Price Movements#Profitability#Risk Management#Security#Stop-Loss#Technical Analysis#Trading Decisions#Trading Strategies#Trading Volume#Trend Confirmation#Volume Analysis#Volume Indicator
2 notes
·
View notes
Link
Demystifying MACD: Mastering Momentum Analysis
"Mastering MACD Indicator for Informed Trading"
This article unveils the powerful MACD (Moving Average Convergence Divergence) indicator, an essential tool for traders and investors in deciphering market trends and momentum. Developed by Gerald Appel in the 1970s, MACD uses the difference between two Exponential Moving Averages (EMAs) to identify potential shifts in price trends and velocity. The article delves into the key components of MACD – the MACD Line, Signal Line, and Histogram – and provides their respective formulas and interpretations. By highlighting practical applications such as trend following, detecting overbought/oversold conditions, and utilizing various signal crossovers, the article equips readers with valuable insights into making informed investment decisions.
Whether for newcomers or experienced traders, the comprehensive understanding of MACD's components, usage scenarios, limitations, and tips for successful implementation enhances one's technical analysis toolkit, offering a robust foundation for strategic trading.
2 notes
·
View notes
Text
WILLIAMS %R
Williams %R is a technical analysis indicator that measures overbought or oversold conditions in a market. It was developed by Larry Williams and is also known as Williams Percent Range. The indicator is commonly used by traders and investors to help identify potential buying and selling opportunities in financial markets.
The Williams %R indicator is calculated using the following formula:
%R…

View On WordPress
3 notes
·
View notes
Text
"100% Pole Follow Through: A Powerful Bearish Pattern in Technical Analysis"
The 100% Pole Follow Through – Bearish pattern occurs when a stock or asset experiences a sharp, steep decline (the "pole"), followed by further downward momentum. This signals strong bearish sentiment, suggesting continued price drops or weakening support levels.
0 notes
Text

Happy Tuesday
I woke up late today but was only focused on the downside as planned. Glad the move didn’t happen while I was asleep lol. 2-0 on the day. I could have definitely held my first position longer but I wanted to take my base hit. Definitely had to get the jitters out because I loaded the account with 2.5k.
2nd trade was continuation on the downside. We hit my levels. Overall I give today 8.9/10 only improvement was to zoom out and trust the trade a bit more.
#s&p 500#options#stock market#option trading#puts#stock trading#investing stocks#webull#robin hood#degenerate#ict#price action#trading indicators#technical analysis
0 notes
Text
without taking any risks and using a consistently successful strategy? What are some strategies or tools that can achieve this?
Leverage Key Levels and Signals with (EzyAlgo) Premium Indicator for AUD/JPY Trading Success!-Full Strategy Explained in Details
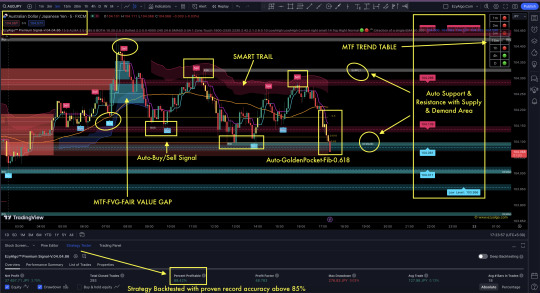
Key Insights:
Support and Resistance Levels: Support: Key levels where AUD/JPY might find buying interest and halt its decline. Resistance: Levels where selling pressure might emerge, potentially stopping upward movement.
Trend Analysis: Indicates if AUD/JPY is in an upward (bullish), downward (bearish), or sideways (consolidating) trend.
Trading Signals: Buy Signal: Indicates a potential upward movement, suggesting entering long positions.Sell Signal: Indicates a potential downward movement, suggesting entering short positions.
Volatility Insights: Provides information on expected price volatility to help manage risk and position sizes.
Timeframe Consideration: Signals are relevant to specific timeframes (e.g., intraday, daily, weekly) and should align with your trading strategy.
EzyAlgo Premium Indicator Singly Proven & Backtested with above 80–85% accuracy always, regardless of whether the market is sideways or trending. It offers perfect entry after detecting major key levels at confluence points. Here are the rules:
Key Levels:
Buy/Sell Signal must be generated.
Signal must be above Demand Area with POI (Point of Interest) Level.
Identified Swing High/Low to determine the trend.
Wait for Trend Tracker Confirmation with Color change or signal candle closing above Tracker.
Green Dot must be generated nearby within 1–3 candles in our EzyAlgo Trend Oscillator.
Extra Key Levels:
Trendline support.
Auto Golden Pocket Area (-0.618) met in the same place.
If all these conditions are met, it constitutes a 90% accurate signal. Otherwise, no trades are initiated. The indicator also highlights key levels for additional confirmation.
This strategy aims to provide a robust framework for identifying trading opportunities and optimizing trades
Get Access to EzyAlgo indicators: https://ezyalgo.com/Join our Free Telegram Channel: https://t.me/EzyAlgoSolutionsJoin our WhatsApp Channel: https://wa.me/message/HTHBVTMYZRJEO1
#forexsignals#forex trading#forex market#forex education#forex indicators#tradingview#tradingviewindicator#indicator#technical analysis#volume profile#candlestick#stock market
0 notes
Text
Supply and Demand Indicator: A Trader's Toolkit for Price Action Mastery
As a trader navigating the ever-changing seas of the financial markets, I'm constantly on the lookout for tools that can sharpen my analysis and give me an edge. That's why I'm excited to share my experience with the Supply and Demand Indicator (SDI), a digital product that has become an integral part of my trading arsenal.


Unveiling Hidden Order Flow: A Game Changer
One of the biggest challenges for traders, especially beginners, is deciphering the underlying sentiment behind price movements. The SDI tackles this head-on by utilizing a unique approach to highlight areas of supply and demand in the market. These zones, traditionally identified through complex order book analysis, become readily apparent with the indicator's visual representation. This allows me to quickly gauge where potential buying and selling pressure might be concentrated, informing my entry and exit points for trades.
Beyond the Basics: A Customisable Powerhouse
The beauty of the SDI lies in its customizability. The indicator offers a variety of settings that cater to different trading styles and preferences. I can adjust the timeframe, display density, and even the color scheme to perfectly align with my trading strategy. This level of control empowers me to tailor the indicator's output to my specific needs, ensuring it seamlessly integrates with my existing technical analysis toolkit.
Seamless Integration for a Streamlined Workflow
The digital format of the SDI is another major plus. As a member of the membership area, I have instant access to the indicator, allowing me to use it across various charting platforms. This eliminates the need for cumbersome downloads or installations, keeping my workflow efficient and streamlined. Additionally, the membership area provides ongoing support and educational resources, ensuring I can continuously improve my understanding and utilization of the SDI.
A Catalyst for Confidence and Profitability
Since incorporating the SDI into my trading routine, I've noticed a significant improvement in my ability to identify high-probability trade setups. The indicator's clear visualization of supply and demand zones has instilled a greater sense of confidence in my trading decisions. This newfound confidence has translated into more consistent profitability, making the SDI a valuable asset in my trading journey.
In Conclusion: An Investment in Your Trading Success
If you're a trader looking to elevate your technical analysis and gain a deeper understanding of price action, then the Supply and Demand Indicator is a product worth considering. While I cannot speak to the effectiveness of other products you've used, the combination of clear visualization, customizable settings, and seamless integration makes the SDI a standout choice for traders of all experience levels. The indicator, coupled with the educational resources offered through the membership area, empowers you to take control of your trading journey and unlock your full trading potential. Consider the SDI as an investment in your trading success, and I believe you'll find it to be a valuable addition to your trading toolkit.
#Supply and Demand Trading#Price Action Indicator#Technical Analysis Tool#Trading Education#Membership Area#Customisable Settings#Streamlined Workflow#Profitability
1 note
·
View note
Text
The benefits and drawbacks of being a solo vs part of a team in the industry
DOES TEAMWORK PAY?
In the professional world, there are two primary work styles: working solo or being a part of a team. Each work style has its own benefits and drawbacks depending on the industry, personality, and preferences of the worker. Some people thrive in a solitary environment where they can work independently, while others prefer to be surrounded by colleagues and actively collaborate…

View On WordPress
#Automated trading#CFD Trading#Currency Exchange#Currency trading#Forex analysis#Forex brokers#Forex charts#Forex education#Forex market#Forex Market Hours#Forex Market Trends#Forex news#Forex signals#Forex strategies#Forex Tips#Forex trading#Forex trading software#Forex Trading Strategies#Forex trading systems#Fundamental analysis#Indicators#Online Forex Trading#Price Action#Psychology#Risk Management#Technical analysis#Trading Forex#Trading platforms#Trading Psychology#Trading robots
1 note
·
View note
Text
Weighted Moving Average (WMA): Forex Trading Indicator Explained
In the dynamic world of Forex trading, the Weighted Moving Average (WMA) stands out as a crucial tool for traders. Unlike the Simple Moving Average (SMA), the WMA assigns more significance to recent data points, providing a clearer and more accurate reflection of market trends. Understanding how to use the WMA effectively can significantly enhance your trading strategy.
What is a Weighted Moving…
#Financial Markets#Forex Trading#Market Analysis#Moving Averages#Technical Analysis#Trading Indicators#Trading Strategies#Trend Identification#Weighted Moving Average#WMA
2 notes
·
View notes
Text
Stock Market and Crypto Analysis: Dow Jones, S&P 500, Nasdaq, Bitcoin, Ethereum


Explore the latest market insights: Dow Jones, S&P 500, Nasdaq, Bitcoin, Ethereum, and more. Detailed analysis includes moving averages, indicators, and summaries for informed trading decisions.
#Market Insights#Dow Jones#S&P 500#Nasdaq#Bitcoin#Ethereum#Moving Averages#Trading Indicators#Market Analysis#Trading Summaries#Informed Trading Decisions#Cryptocurrency Analysis#Stock Market Analysis#Technical Analysis#Financial Markets
0 notes
Text
Top 20 Trading Indicators: A Professional Guide :
If you are interested in trading, you must have heard of trading indicators. Trading indicators are mathematical calculations that are based on the price and/or volume of a security. These indicators are used to analyze the market and to identify potential trading opportunities. There are many trading indicators available, and choosing the right ones can be challenging. In this article, we will discuss the top 20 trading indicators that you can use to improve your trading strategy.
Technical analysis is an important aspect of trading, and trading indicators play a crucial role in it. Technical analysis is the study of historical prices and volumes of a security to identify patterns and trends. Trading indicators are used to analyze these patterns and trends and to predict future price movements. By using trading indicators, you can identify potential entry and exit points for your trades. Trading indicators can also help you to manage your risk by setting stop-loss orders and take-profit orders.
0 notes
Text
"XO AMA Indicator: Adaptive Moving Averages for Trend Precision and Market Volatility Insights"
The XO AMA (Exponential Optimization Adaptive Moving Average) is a dynamic trend-following indicator that adjusts its sensitivity to market volatility. It filters noise in sideways markets and reacts quickly in trending markets, enhancing trading accuracy.
0 notes
Text
Aiming Higher: Uniswap's UNI Token Gathers Steam, Eyes 15% Price Increase
Uniswap's native cryptocurrency, UNI, has recently exhibited a robust bullish trend, surging past key resistance levels at $6.00 and $6.20. The token's ascent above $6.50, accompanied by a 5% growth, has ignited discussions among investors and traders regarding a potential rally toward the $8.00 mark.
The breakthrough of a critical bearish trend line, formerly a stronghold near $6.60, has injected optimism into UNI's market dynamics. The token's steady climb above the $6.75 resistance level signifies its strong upward momentum, with attention now turning to the next significant obstacle at the $7.25 resistance.
As of the latest update, UNI is valued at $6.82, reflecting a modest 0.51% increase in the past 24 hours and a weekly gain exceeding 10%. The ongoing battle between bears and bulls has shaped UNI's price action, with the bulls currently seeking to surpass the resistance at $6.90.
Detailed analysis of UNI's technical indicators adds further weight to its bullish stance. The 4-hour MACD signals a growing bullish momentum, complemented by an RSI firmly above 50, indicative of a robust market sentiment favoring the bulls. The token's consistent performance above the 100 simple moving average further strengthens the positive outlook for UNI's short-term trajectory.
Uniswap's dominance in the Ethereum ecosystem throughout 2023, marked by substantial transaction volume and efficient gas processing, has translated into UNI's notable price movement. A 28% increase following the launch of new initiatives and expansions underscores the platform's influence in the decentralized finance (DeFi) space, contributing to UNI's current upward trajectory.
#UNI token#Uniswap#cryptocurrency#DeFi space#bullish trend#resistance levels#technical indicators#price analysis#UNI/USD#CoinMarketCap#MACD#RSI#Cryptotale
0 notes
Last Seen Blogs

bruknapt
Untitled

zhibeque
At the Bar


xivil91
XIVIL's Blog

eastcoastblood
exploitative; performative