#Ultrasonic Continuous Level Sensor
Explore tagged Tumblr posts
Visit Tumblr Blog
Explore Tumblr blogs with no restrictions, modern design and the best experience.
Last Seen Tumblr Blogs


Fun Fact
The KCSC sent more than 20K requests to delete posts related to prostitution and porn to Tumblr from January to June 2017.
Text

Ultrasonic Continuous Level Sensor
SEGMEN SENSOR offers a range of high-quality ultrasonic continuous-level sensors for precise and reliable level measurement in various industrial applications. For more information, please visit https://segmensensor.com/
0 notes
Text
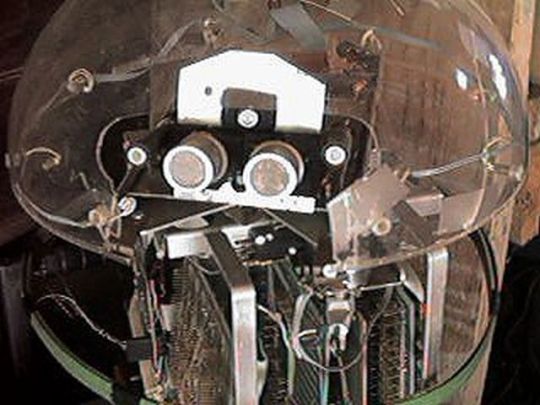
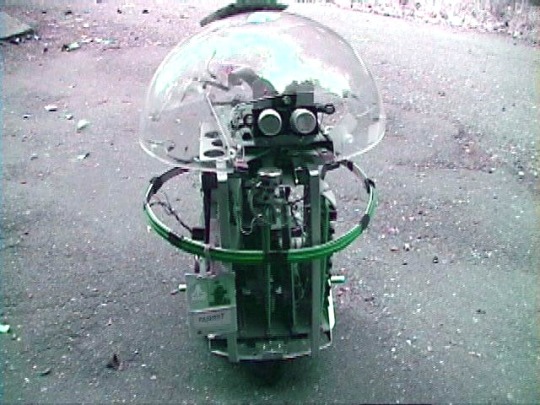

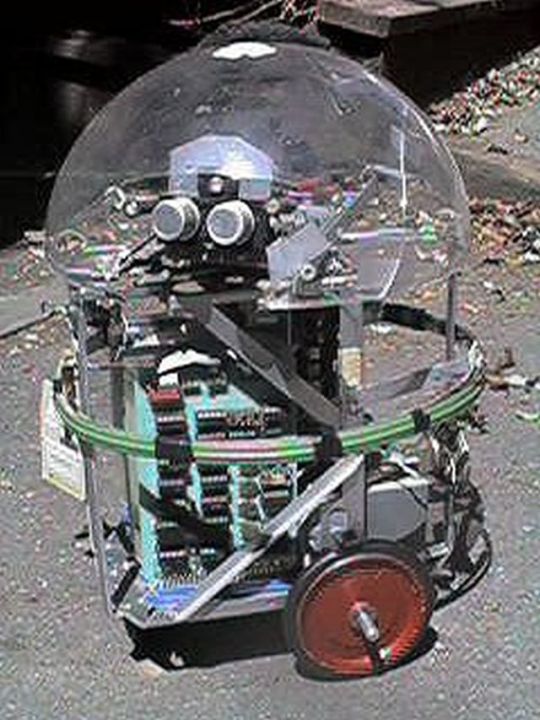

Kermit (1978), by Ron Milner and Larry Nicolson, Cyan Engineering, Atari's secret think tank in Grass Valley, CA.
"The robot was a pet project for Nolan Bushnell, then still the head of Atari and a very creative guy. Its purpose in life was as Nolan put it to "bring me a beer!" Navigation for robots was a sketchy thing at that time with lots of pioneering work at MIT but no consumer cost ideas. Nolan brought us the incredibly original idea to navigate a robot (which mostly meant knowing where it was) by means of scanning bar codes attached here and there to the baseboards in the rooms the robot was to service. Why it wasn't patented I don't know.
I had lots of fun building the R2D2 style robot about 20" tall. I liked to put mechanical and electronic things together and we had a great shop at Cyan. Its brain was one of the 6502 based single board computers-I think it was a KIM but not sure. Locomotion was two DC gear motor driven wheels and an instrumented caster-about the same rig as a modern Roomba. A rotatable turret covered with a plexiglass dome carried microphones, an IR sensor to detect people, and ultrasonic ranging sensors I built on a separate PC board. A speaker so Kermit could beep gleefully, of course.
A ring of contact-detecting burglar alarm sensing tape (green in the pictures) around Kermit's middle told the software he had hit something and should back off. The ultrasonics provided range to obstacles and to some extent direction as the turret was rotated, so we could go around things.
My pride and joy was the barcode remote scanner which was mounted on the bottom of the robot so its rotating head would be level with the barcodes on the baseboards. It had a vertical telescope tube with a beam splitter between the IR Led and the photodiode sensor and a lens to focus 2-20' away. It aimed down at a front surface mirror at 45 degree to scan horizontally. The mirror was mounted on a motor driven turret so it spun around continuously with a sensor once around to resolve the continuous angular position of the beam horizontally of course with respect to Kermit's rotational position. Unfortunately, this part of the robot did not survive the closing of our group. The barcodes I made for the prototype to detect were about 4" tall made of 3/4" reflective 3m tape on black poster board.
My programming partner on the project was Larry Nicholson, a really bright guy. He made the barcode reading work to detect not only the barcodes, but where they were angularly with respect to the robot and also their subtended angle or apparent size (all from timing of the rotation of the scanner) which was a measure of distance combined with angle from the barcode. We worked out some pretty clever math to resolve that information from two or three of the barcodes into a position and orientation of Kermit in the room. We had rented an empty room upstairs on the third floor of the Litton building to try all this out and work out the navigation. Larry and I got the basic navigation and obstacle avoidance working so Kermit could go from one place to a designated other place in the room and avoid wastebaskets placed randomly. We demonstrated it to Nolan and he was impressed.
Shortly thereafter Warner Communication who had bought Atari from Nolan kicked him out and the Kermit project was cancelled."
– Kermit The Robot Notes by Ron Milner.
65 notes
·
View notes
Text
The Future of Warehouse Robots: AI Meets Electronics Design

The future of warehouse robots lies in the powerful fusion of AI integration and advanced electronics design — enabling smarter, faster, and more autonomous logistics operations. Electronics design ensures robots are compact, reliable, and capable of processing massive amounts of real-time data, while AI adds the intelligence to learn, adapt, and optimize warehouse tasks like sorting, picking, and navigating.
If you’re looking to understand what’s driving the next wave of innovation in warehouse automation, this article explains how AI and electronics are shaping the most efficient, intelligent robots ever built for industrial logistics.
Why AI and Electronics Design Are Game Changers for Warehouse Robots
Warehouses are fast-paced environments where precision, speed, and adaptability are critical. Traditional automation helped, but it lacked flexibility. Today, AI-driven warehouse robots powered by advanced electronics design are bridging that gap.
Here’s how the synergy works:
Electronics design enables lightweight, high-performance robotic systems with smart sensors, efficient power management, and robust connectivity.
AI integration processes that data to make decisions, learn from patterns, and continually improve task efficiency.
Together, they create autonomous systems capable of handling unpredictable inventory challenges in real time �� faster and more reliably than ever.
Core Technologies Behind Modern Warehouse Robots
1. Smart Electronics Design
At the heart of every capable warehouse robot is a custom-designed electronic system, which includes:
Embedded microcontrollers and PCBs that control movement and communication
Sensor arrays for object detection, spatial awareness, and load tracking
Battery and power systems optimized for long shifts and fast recharging
Wireless modules for seamless data flow and remote updates
Electronics design focuses on reliability, low power consumption, and miniaturization — making robots both powerful and space-efficient.
2. AI Integration
AI gives robots the intelligence they need to:
Identify and classify objects with computer vision
Plan routes dynamically using real-time mapping and SLAM (Simultaneous Localization and Mapping)
Predict demand and optimize picking paths
Detect anomalies or safety risks without human intervention
This AI capability is only possible when backed by well-integrated, high-speed electronics that deliver real-time data and process it on-board or via edge computing.
Key Applications in Warehouses
Autonomous Mobile Robots (AMRs)
AI-powered AMRs use advanced sensors and AI algorithms to navigate warehouse floors, avoiding obstacles, rerouting in real-time, and managing deliveries.
Electronics role: Precise motor control, LiDAR/ultrasonic sensor support, real-time feedback, and robust safety circuits.
Robotic Picking Systems
Robots with grippers or suction arms can now pick and sort items of various shapes, guided by AI vision systems.
Electronics role: High-speed processors, smart camera modules, and force-sensitive feedback loops.
Inventory Monitoring Robots
Some robots autonomously scan shelves for stock levels, damaged goods, or misplaced items.

Benefits of AI + Electronics in Warehouse Robots
Greater Efficiency: AI algorithms optimize paths, reduce downtime, and adapt to demand.
Higher Accuracy: Fewer picking or sorting errors thanks to smart sensing and decision-making.
Scalability: Modular electronics design makes it easier to upgrade or expand systems.
24/7 Operation: Smart electronics allow continuous performance with minimal maintenance.
Reduced Labor Costs: Automation reduces reliance on manual labor for repetitive tasks.
Challenges in Design and Integration
While the benefits are clear, building next-gen warehouse robots isn’t without challenges:
Power constraints: AI processing requires energy; electronics must balance performance with battery life.
Sensor fusion complexity: Integrating multiple sensors into one coherent decision-making unit is tricky.
Thermal management: AI chips and motors generate heat, requiring clever thermal design.
Cybersecurity: Wireless communication and AI models must be protected from external threats.
These issues highlight the importance of precise, efficient electronics design and secure, robust AI models.
Future Trends to Watch
Edge AI for Faster Decisions
Instead of sending data to the cloud, AI processing is moving closer to the source (onboard). This requires faster processors and optimized electronics design to deliver near-instant results.
Swarm Robotics
Using multiple robots that coordinate like a hive mind, enabled by AI and synchronized electronics, to cover large warehouse spaces efficiently.
Predictive Maintenance
AI models will monitor wear-and-tear data from sensors to predict breakdowns before they happen — enabled by electronics that track vibration, temperature, or usage cycles.
Interoperability Standards
Future electronics design will focus on plug-and-play compatibility, allowing various robots to work in harmony across brands and platforms.
Real-World Example: AI-Powered Fulfillment Centers
Major players like Amazon and Alibaba already deploy hundreds of AI-integrated warehouse robots designed with advanced electronics systems. These robots:
Navigate high-density shelf areas
Communicate with human operators and other robots
Pick, sort, and deliver packages continuously
Adapt operations based on live order data
This synergy between electronics design and AI has helped these companies achieve previously impossible levels of speed and accuracy.
Final Thoughts
The future of warehouse robots is already taking shape — and it’s built on two pillars: brilliant electronics design and seamless AI integration. Together, they unlock the full potential of automation, allowing warehouse robots to think, adapt, and perform with superhuman precision.
For logistics leaders, engineers, and businesses looking to stay competitive, investing in this technology isn’t optional — it’s a strategic advantage. As innovation accelerates, expect to see even more intelligent, flexible, and efficient warehouse robots shaping the next generation of industrial success.
#ElectronicManufacturing#EMSIndia#PCBDesignChennai#ElectronicsInChennai#PCBAIndia#SMTAssembly#ElectronicsManufacturingServices#PCBManufacturingIndia#ChennaiEMS#ManufacturingInChennai
0 notes
Text
Level Sensor Market Emerging Trends Shaping Future Industrial Monitoring
The level sensor market is undergoing a transformative shift driven by rapid technological advancements and the growing demand for smart monitoring solutions across industries. Level sensors, which detect the level of liquids, powders, and granular materials within a container or environment, have become increasingly vital in applications such as water treatment, oil and gas, food and beverage, chemical processing, and manufacturing. As the global economy continues its digital evolution, the level sensor market is adapting with a wave of innovative trends that are defining the future of process automation and safety assurance.

1. Growth of Industrial IoT and Smart Manufacturing
One of the most significant trends in the level sensor market is the integration of Industrial Internet of Things (IIoT) technologies. IIoT enables the real-time monitoring and management of sensor data through cloud-based platforms, offering enhanced visibility into industrial operations. Smart factories are increasingly using connected level sensors to automate material tracking, reduce human error, and increase productivity. These sensors can relay data wirelessly to centralized systems, aiding in predictive maintenance and operational efficiency.
2. Rising Adoption of Non-Contact Sensor Technologies
Another emerging trend is the increasing preference for non-contact level sensors, such as ultrasonic, radar, and laser-based systems. These sensors provide highly accurate measurements without physical contact with the measured substance, making them ideal for hazardous or corrosive environments. Radar level sensors, in particular, are seeing widespread adoption due to their precision, reliability, and suitability for harsh industrial conditions. These devices offer better performance in extreme temperatures, high-pressure environments, and turbulent or dusty atmospheres.
3. Miniaturization and Integration in Consumer Applications
Level sensors are no longer confined to large industrial setups. Due to advances in miniaturization and semiconductor technology, level sensors are finding applications in consumer products like home appliances (e.g., coffee machines, washing machines), smart homes, and medical devices. Compact, energy-efficient sensors with wireless capabilities are being designed to seamlessly integrate into IoT-enabled household and healthcare systems, enhancing user experience and operational efficiency.
4. Demand Surge in Water and Wastewater Management
Global concerns regarding water scarcity and efficient resource management are fostering innovation in water and wastewater monitoring systems. Level sensors are central to managing storage tanks, reservoirs, and treatment facilities. Emerging trends include solar-powered level sensors and remote sensing capabilities, allowing utilities and municipalities to monitor levels in real-time and ensure timely interventions. The adoption of these technologies is also supported by government regulations promoting water conservation and pollution control.
5. Customization for Industry-Specific Applications
To meet the specific needs of diverse sectors, customization and application-specific designs are gaining momentum. For instance, the food and beverage industry requires sensors that comply with hygiene standards and resist contamination, while the oil and gas sector demands explosion-proof and rugged sensors. Manufacturers are developing tailored solutions that enhance performance, durability, and regulatory compliance in their respective environments.
6. Integration of AI and Data Analytics
Artificial Intelligence (AI) and data analytics are being integrated into level sensor systems to enable intelligent monitoring and diagnostics. By analyzing data patterns, AI algorithms can predict equipment failures, optimize inventory levels, and identify anomalies. This capability reduces downtime and maintenance costs while ensuring uninterrupted operation. Predictive analytics also contribute to sustainability by minimizing waste and energy consumption.
7. Environmental and Energy Efficiency Considerations
Modern level sensors are increasingly being designed with energy-efficient and environmentally sustainable features. These include low-power operation, longer battery life, and eco-friendly materials. Wireless communication protocols such as LoRaWAN and NB-IoT help reduce wiring infrastructure and energy consumption. Additionally, solar-powered level sensors are becoming popular in remote or off-grid locations, contributing to green energy initiatives.
8. Expansion in Emerging Markets
Emerging economies in Asia-Pacific, Latin America, and Africa are experiencing rapid industrialization and urbanization, which is creating new opportunities for level sensor manufacturers. Growing investments in infrastructure, water supply systems, agriculture, and energy are fueling the demand for reliable monitoring solutions. Localized production, cost-effective sensor designs, and strategic partnerships are being adopted to cater to the unique demands of these regions.
Conclusion
The level sensor market is evolving rapidly, driven by technological innovation, environmental priorities, and increasing industry-specific requirements. From smart factories and autonomous systems to water conservation and predictive analytics, the market is witnessing transformative changes that promise enhanced efficiency, accuracy, and sustainability. As these emerging trends gain momentum, level sensors will play an even more critical role in shaping the future of intelligent industrial and environmental monitoring systems. Businesses and stakeholders who embrace these advancements are likely to gain a competitive edge in this dynamic and expanding market.
0 notes
Text
Exploring the Latest Trends in the Global Gas Leak Detector Market
The global gas leak detector market is experiencing robust growth driven by increasing industrialization, stringent safety regulations, technological advancements, and heightened awareness about health and environmental risks. Gas leak detectors are essential tools used to identify and locate leaks of flammable, toxic, or combustible gases. As industries and governments prioritize safety and environmental protection, the demand for reliable gas detection systems continues to rise. This article explores the key trends shaping the gas leak detector market.
1. Growing Demand Across Diverse Industries
Gas leak detectors are used in a wide range of industries including oil and gas, chemicals, manufacturing, mining, residential, and healthcare. The oil and gas sector remains a major contributor to market demand due to its high-risk operations involving combustible gases. Similarly, chemical plants and power generation facilities require robust gas detection systems to monitor hazardous gases and prevent workplace accidents.
In addition to industrial applications, residential and commercial segments are increasingly adopting gas detectors, especially for detecting natural gas, carbon monoxide, and liquefied petroleum gas (LPG). This growing awareness at the consumer level is contributing significantly to market expansion.
2. Technological Advancements in Detection Systems
One of the most prominent trends in the gas leak detector market is the rapid advancement in detection technologies. Traditional systems are being replaced with sophisticated detectors that offer greater sensitivity, faster response times, and improved reliability. Technologies such as:
Infrared (IR) sensors
Ultrasonic sensors
Electrochemical sensors
Photoionization detectors (PID)
are gaining traction for their ability to detect a wide range of gases in diverse environmental conditions.
Moreover, innovations like open-path detection, laser-based sensors, and solid-state sensors are enhancing detection capabilities while reducing false alarms. These technologies are especially beneficial in complex industrial settings where precision is critical.
3. Integration with IoT and Smart Systems
The integration of gas leak detectors with Internet of Things (IoT) platforms is revolutionizing the industry. Smart detectors can now transmit real-time data to centralized monitoring systems, enabling faster decision-making and preventive maintenance. These systems are often connected to mobile apps or cloud-based platforms, allowing users to remotely monitor gas levels and receive instant alerts.
IoT-enabled gas detectors are particularly useful in large facilities where manual monitoring would be inefficient. Their ability to store historical data also aids in compliance reporting and performance optimization.
4. Stringent Safety Regulations and Environmental Policies
Governments and regulatory bodies around the world are enforcing strict safety and environmental standards, which is fueling the adoption of advanced gas detection systems. Regulations from organizations like:
Occupational Safety and Health Administration (OSHA)
Environmental Protection Agency (EPA)
European Union directives
International Maritime Organization (IMO)
mandate the installation of gas leak detectors in hazardous environments. Non-compliance can lead to hefty fines, legal action, and reputational damage. Consequently, industries are proactively investing in gas detection solutions to ensure regulatory compliance and avoid operational downtime.
5. Rise of Portable and Wearable Detectors
Another emerging trend is the increased demand for portable and wearable gas leak detectors. These compact devices are widely used by field workers, first responders, and safety inspectors for on-site leak detection. They offer the advantage of mobility, ease of use, and rapid response, especially in remote or confined spaces.
Advancements in battery life, sensor accuracy, and wireless communication have further enhanced the utility of these portable units. Some wearable models even come with GPS tracking and real-time health monitoring to improve worker safety.
6. Regional Growth Dynamics
The gas leak detector market is witnessing varying growth rates across different regions:
North America: A mature market with high adoption rates due to stringent regulatory frameworks and a strong industrial base.
Europe: Driven by environmental legislation and the push for renewable energy, Europe remains a significant market for advanced detection technologies.
Asia-Pacific: The fastest-growing region, led by rapid industrialization in countries like China, India, and Southeast Asian nations. Rising safety awareness and infrastructure development are driving demand.
Middle East & Africa: The oil and gas sector dominates here, creating a stable demand for reliable detection systems.
7. Emphasis on Environmental Protection
With increasing concern over greenhouse gas emissions and air pollution, gas leak detectors are also being used for environmental monitoring. Programs like Leak Detection and Repair (LDAR) require regular inspections and documentation of gas leaks in industrial facilities. These detectors help minimize fugitive emissions and contribute to sustainability goals.
Additionally, detectors for refrigerant gases are gaining importance due to international agreements like the Kigali Amendment aimed at phasing down hydrofluorocarbons (HFCs).
Conclusion
The gas leak detector market is evolving rapidly, driven by a combination of regulatory requirements, technological innovation, and growing awareness of safety and environmental risks. As industries strive to improve operational safety and comply with stricter environmental norms, the demand for smart, accurate, and efficient gas detection solutions is expected to grow steadily. Market players focusing on innovation, integration, and customization are likely to gain a competitive edge in this dynamic sector.

0 notes
Text
Realme GT 7 Series: Global Launch Date, Expected Price in India, Specifications and Features

The Realme GT 7 Series is generating immense buzz globally, and for good reason. Since its debut, the GT lineup has carved a niche for itself in the competitive smartphone market, combining flagship-level performance with aggressive pricing. The original Realme GT, launched in 2021, was hailed as a “flagship killer,” powered by the Snapdragon 870 chipset and praised for its sleek design and 120Hz AMOLED display. Each iteration since then — from the GT Neo to the GT 5 Pro — has pushed the envelope further, introducing faster processors, improved cooling systems, and innovative features like 240W charging and advanced camera systems. With every model, Realme has proven that premium doesn’t always have to come with a hefty price tag. Now, all eyes are on the Realme GT 7 Series, set to redefine expectations once again. Leaks suggest cutting-edge hardware, possibly the Snapdragon 8 Gen 3 SoC, and industry-first features like ultrasonic fingerprint sensors and 1.5K curved AMOLED displays. Enthusiasts and tech reviewers around the globe are closely watching Realme’s moves, anticipating a bold leap that could challenge even the biggest flagship players in 2025. The countdown to the Realme GT 7 Series launch isn’t just a moment in tech — it’s a global event for smartphone enthusiasts.
Global Launch Details

Realme GT 7 Series: Global Launch Date, Expected Price in India, Specifications and Features The excitement around the Realme GT 7 Series continues to build as the official global launch date is confirmed for May 27, 2025. The event will take place in Paris, France, marking Realme’s ambition to stage a truly international unveiling for one of its most anticipated flagship lineups to date. According to Business Standard, both the Realme GT 7 and GT 7T models will be revealed during the event, with availability planned for multiple global markets including India via Realme’s official website, Amazon, and select offline retailers. Realme’s strategy behind this high-profile global rollout is to assert its presence in the premium smartphone segment while maintaining its reputation for affordability and innovation. The Realme GT 7 Series, which is rumored to come equipped with cutting-edge technology like the IceSense Graphene cooling system and potentially the Snapdragon 8 Gen 3, is a pivotal move in this direction. With the campaign theme “Power that Never Stops,” Realme is positioning the GT 7 Series as a flagship alternative that challenges the dominance of established giants. You can learn more about Realme's official announcements from their Newsroom.
Variants in the GT 7 Series

Here’s the detailed comparison of the Realme GT 7 Series variants in a clear tabular format with the focus keyword used appropriately: FeatureRealme GT 7Realme GT 7 ProRealme GT 7TProcessorMediaTek Dimensity 9400+Qualcomm Snapdragon 8 EliteMediaTek Dimensity 8400+Display6.78" Full HD+ OLED, 144Hz6.78" LTPO OLED, 120Hz6.78" Full HD+ OLED, 144HzRear CameraDual: 50MP Sony IMX896 + 8MP ultra-wideTriple: 50MP wide + 50MP periscope telephoto + 8MP ultra-wideDual: 50MP primary + secondary lensFront Camera16MP16MP16MPBattery7,200mAh, 100W wired fast charging6,500mAh, 120W wired fast charging7,200mAh (charging details TBD)Cooling System7,700mm² VC chamber + Graphene ice-sensing coolingAdvanced cooling systemStandard coolingSpecial FeaturesHigh brightness 6,500 nits displayIP68/IP69 water & dust resistance, ultrasonic fingerprint sensorUnique design with yellow leather texture, AI photography featuresBuy NowBuy NowBuy Now Each variant in the Realme GT 7 Series offers distinct advantages, making it easier for users to select based on their preferences for performance, camera, battery, and design.
Design and Build

The Realme GT 7 Series continues Realme’s tradition of delivering sleek, premium design without the flagship price tag. The design language is a balanced blend of modern aesthetics and functional ergonomics, crafted to appeal to both tech enthusiasts and everyday users. For the build, Realme employs a mix of high-quality materials across the series. The GT 7 Pro variant stands out with its glass back featuring a matte finish that resists fingerprints and adds a refined look, while the GT 7 and GT 7T models use a durable plastic frame with textured or leather-like finishes that provide excellent grip and style. This choice of materials keeps the phones lightweight yet sturdy, perfect for extended daily use. Color options for the Realme GT 7 Series are vibrant and thoughtfully curated. The GT 7T, for example, introduces a striking yellow leather-textured back panel, a bold choice that has quickly become iconic among fans. Meanwhile, the GT 7 offers sleek gradient finishes like Sapphire Blue and Mist Silver, and the GT 7 Pro sports more classic tones such as Titanium Blue and Moonlight Silver, appealing to users who prefer a subtle, elegant look. One of the most impressive aspects of the Realme GT 7 Series is its thermal management. Realme has integrated its proprietary IceSense Graphene cooling system, featuring a massive 7,700mm² vapor chamber and double-layer graphene sheets. This innovation ensures the devices maintain optimal performance even during intensive gaming or multitasking by effectively dissipating heat faster than previous generations. This cutting-edge thermal design not only enhances longevity but also provides users with a consistently smooth experience. By combining thoughtful design, premium materials, vibrant finishes, and advanced cooling technology, the Realme GT 7 Series stands out as a compelling choice for users seeking style and substance in one package.
Display Specifications

The Realme GT 7 Series delivers a premium visual experience with large, vibrant displays designed to impress both gamers and casual users alike. With cutting-edge AMOLED and LTPO OLED technology, these smartphones provide crisp resolution, smooth motion, and excellent brightness that hold up even in bright outdoor conditions. Key display specifications include: - Screen Size & Panel: - Realme GT 7 and GT 7T feature a 6.78-inch Full HD+ AMOLED display. - Realme GT 7 Pro boasts a 6.78-inch LTPO OLED panel with curved edges for enhanced immersion. - Resolution: - All variants offer 2400 x 1080 pixels resolution, ensuring sharp and clear visuals. - Refresh Rate: - Realme GT 7 and GT 7T support a 144Hz refresh rate, ideal for smooth gaming and scrolling. - GT 7 Pro offers a 120Hz refresh rate with LTPO technology, enabling dynamic refresh rate adjustment to conserve battery. - Brightness: - Peak brightness reaches an impressive 6,500 nits across the series, allowing excellent visibility under direct sunlight. - Additional Features: - HDR10+ support for richer contrast and deeper blacks. - Curved display edges on the GT 7 Pro enhance the premium feel and immersive experience. The Realme GT 7 Series clearly balances performance and visual appeal, making it a strong contender in the mid-to-high-end smartphone market.
Performance and Hardware

The Realme GT 7 Series stands out as a powerhouse lineup, delivering top-tier performance that caters to gamers, multitaskers, and tech enthusiasts alike. Realme has equipped each variant with the latest processors and ample memory options, ensuring smooth and efficient operation across all tasks. Processor and Hardware: - The Realme GT 7 Pro is powered by the flagship Qualcomm Snapdragon 8 Gen 2 Elite chip, built on a 3nm process that offers exceptional power efficiency and performance. - The Realme GT 7 uses the robust MediaTek Dimensity 9400+, a high-performance chip that rivals many Snapdragon offerings in speed and AI processing. - The Realme GT 7T features the MediaTek Dimensity 8400+, designed to deliver excellent gaming and everyday performance at a more accessible price point. RAM and Storage Options: - RAM configurations range up to 16GB LPDDR5X on both the GT 7 and GT 7 Pro, ensuring smooth multitasking and future-proofing. - Storage options go up to 1TB UFS 4.0 on the higher-end models, providing fast data transfer speeds and ample space for apps, games, and media. Gaming and AI Performance: The Realme GT 7 Series excels in gaming thanks to its powerful GPUs—Adreno for Snapdragon and Mali for MediaTek chips—offering high frame rates and stable gameplay. Benchmarks reveal that the GT 7 Pro can sustain peak performance with minimal thermal throttling thanks to its advanced cooling system. AI features enhance camera capabilities, voice assistants, and system optimization, making the devices smarter and more responsive. Thermal Management: Realme’s innovative IceSense Graphene cooling system with a large vapor chamber keeps temperatures low during intensive gaming or heavy multitasking. Tests indicate that the cooling system reduces CPU temperature by up to 10°C compared to previous models, allowing sustained high performance without overheating. With these cutting-edge specifications, the Realme GT 7 Series provides an excellent balance of raw power, efficiency, and intelligent features, reaffirming its status as a leading contender in 2025’s premium smartphone market.
Camera Capabilities
The Realme GT 7 Series continues to impress with its versatile and powerful camera systems, designed to meet the needs of photography enthusiasts and everyday users alike. Rear Camera Configuration: - The Realme GT 7 Pro leads the pack with a sophisticated triple-camera setup featuring a 50MP wide lens, a 50MP periscope telephoto lens with 3x optical zoom, and an 8MP ultra-wide sensor. This combination allows users to capture stunning details, impressive zoom shots, and expansive landscapes. - The Realme GT 7 comes equipped with a dual-camera system that includes a 50MP Sony IMX896 primary sensor paired with an 8MP ultra-wide lens, perfect for versatile shooting from portraits to wide scenes. - The Realme GT 7T also sports a 50MP main camera supported by a secondary sensor, catering to users seeking solid photography performance at a more affordable price point. Front Camera and AI Enhancements: All models feature a 16MP front camera capable of delivering sharp and natural selfies. Realme’s AI-powered camera algorithms enhance portrait modes, skin tones, and background blur, ensuring users always look their best. AI also aids in scene recognition and automatic adjustments, making photography effortless and professional-looking. Special Features: - Video capabilities include 4K recording at 60fps on the GT 7 and GT 7 Pro, with rumors suggesting the GT 7 Pro might even support 8K video capture for ultra-high-definition footage. - Night mode enhancements leverage AI to brighten low-light photos without losing detail or introducing noise. - Optical image stabilization (OIS) on the GT 7 Pro ensures smoother video and sharper shots, especially in challenging conditions. - Additional modes such as ultra-wide macro photography, slow-motion video, and Pro mode give users creative freedom. The Realme GT 7 Series strikes an excellent balance between advanced hardware and intelligent software, empowering users to capture stunning photos and videos in nearly any situation.
Battery and Charging
The Realme GT 7 Series is designed to keep up with demanding users by offering large battery capacities paired with industry-leading fast charging technology. Battery Capacity and Usage: - The Realme GT 7 and GT 7T both pack a massive 7,200mAh battery, promising all-day usage even under heavy multitasking and gaming scenarios. Realme claims these models can easily last over 14 hours of continuous video playback or around a full day of mixed usage, which is excellent for users always on the go. - The Realme GT 7 Pro features a slightly smaller but still robust 6,500mAh battery, optimized through its LTPO display and efficient Snapdragon 8 Gen 2 Elite processor to deliver extended battery life without compromising performance. Fast Charging Support: - The GT 7 Pro supports ultra-fast 120W wired charging, capable of taking the battery from zero to 100% in approximately 25 minutes—one of the fastest charging speeds available in its segment. - The GT 7 offers 100W fast charging, which can fully recharge the large 7,200mAh battery in about 30 minutes, providing impressive convenience. - Charging details for the GT 7T are expected to be similar, ensuring quick power top-ups to minimize downtime. Comparison with Other Phones: When compared to competitors like the Samsung Galaxy S23 series or the OnePlus 11, the Realme GT 7 Series holds its own, often surpassing in raw battery capacity and charging speeds. For example, the Galaxy S23 Ultra comes with a 5,000mAh battery and 45W charging, making Realme’s 7,200mAh + 100W or 120W charging solutions stand out for users who prioritize endurance and rapid recharging. Overall, the Realme GT 7 Series delivers a compelling battery experience, combining large capacities with some of the fastest charging technologies in the market, ensuring users stay powered throughout their busiest days.
Software and User Interface
The Realme GT 7 Series runs on the latest Android 15 operating system paired with Realme UI 6.0, delivering a clean, responsive, and feature-rich user experience. This combination not only enhances system performance but also offers users a highly customizable and intuitive interface. Notable UI Improvements: Realme UI 6.0 introduces a refreshed design with smoother animations, more vibrant color schemes, and an improved notification system that keeps users informed without being intrusive. The updated control center allows quick access to essential settings, making daily interactions faster and more fluid. Additionally, the UI offers enhanced multitasking features such as split-screen and floating windows, perfect for productivity on the go. AI Integration and Personalization: One of the standout features of the Realme GT 7 Series software is its deep integration of AI tools. Smart Battery Management leverages AI to optimize power consumption based on user habits, extending battery life. The AI-powered camera app adapts settings dynamically for better photo quality depending on lighting and scenes. Personalization is another strong suit, with Realme UI 6.0 allowing users to customize themes, fonts, icons, and even app layouts extensively. The system also includes an AI assistant that learns user preferences over time, helping with reminders, navigation, and daily tasks seamlessly. Overall, the software experience on the Realme GT 7 Series strikes a perfect balance between simplicity, efficiency, and intelligent automation, enhancing user satisfaction and engagement.
Expected Price in India
The Realme GT 7 Series is expected to hit the Indian market with competitive pricing that balances premium features and affordability, continuing Realme’s reputation for delivering strong value. Expected Price Range: - The Realme GT 7 is anticipated to launch around ₹40,000 to ₹45,000, positioning it as a mid-range powerhouse. - The more feature-packed Realme GT 7 Pro will likely be priced between ₹55,000 and ₹60,000, targeting enthusiasts who want flagship-level specs without the flagship price. - If the Realme GT 7T is released in India, it could fall near the ₹35,000 to ₹40,000 range, offering a slightly more affordable entry point with balanced specs. Comparison with Predecessors and Competitors: Compared to the Realme GT Neo 3 and earlier GT models, the new GT 7 Series offers clear upgrades in design, display, camera, and performance while keeping prices within a similar range. This evolution reflects Realme’s strategy to provide premium experiences without dramatic price hikes. Against competitors like the Poco F5 Pro, iQOO Neo 7, and even some Samsung A-series devices, the Realme GT 7 Series stands out with superior display technology, faster charging, and better thermal management, often at comparable or slightly lower prices. Value-for-Money Assessment: For Indian buyers, the Realme GT 7 Series represents excellent value, blending flagship-level features such as Snapdragon 8 Gen 2 Elite processors (in the Pro), 120-144Hz AMOLED displays, and ultra-fast charging, all wrapped in stylish designs. This makes the series a smart choice for users seeking performance and innovation without breaking the bank.
Availability and Pre-Orders
The Realme GT 7 Series is set to launch in India on May 27, 2025, at 1:30 PM IST during a global event in Paris. Read the full article
1 note
·
View note
Text
In today’s fast-evolving industries—from biotech to electronics—precision isn’t just important, it’s essential. That’s where clean room assembly services come into play. Whether you're manufacturing sensitive medical equipment, microelectronics, or aerospace components, the slightest contamination can jeopardize the entire process. That’s why companies like FoxxTechnologies are leading the way in delivering world-class clean room solutions to ensure the highest standards of quality and performance.

Email Us : [email protected]
What is Clean Room Assembly?
Clean room assembly refers to the process of manufacturing and assembling components in a controlled environment that has a low level of environmental pollutants like dust, airborne microbes, aerosol particles, and chemical vapors. These rooms are built to ISO classifications and are tightly regulated to maintain precise temperature, humidity, and cleanliness.
Why Clean Rooms Matter More Than Ever
Imagine trying to build a spaceship with sand constantly falling into the engine—that’s what it's like assembling sensitive products without a clean room. Clean room environments eliminate these variables, allowing for extreme precision and reliability.
Industries like semiconductors, pharmaceuticals, biotechnology, and aerospace rely heavily on these services to ensure zero contamination and flawless execution.
Key Industries That Rely on Clean Room Assembly Services
1. Medical Devices and Pharmaceuticals
In medicine, lives are on the line. Clean room environments are crucial for manufacturing surgical instruments, implants, and pharmaceutical packaging.
2. Aerospace and Defense
High-performance aerospace systems require absolute reliability. Clean room assembly ensures components are free from contamination and defects.
3. Electronics and Semiconductors
Even a speck of dust can ruin an entire batch of microchips. Clean rooms provide the necessary sterile environment for intricate electronic parts.
4. Biotechnology and Life Sciences
From DNA analysis to medical diagnostics, precision is key. Clean room assembly ensures equipment meets the strictest safety and performance standards.
Introducing FoxxTechnologies – Your Clean Room Partner
When it comes to clean room assembly services, FoxxTechnologies stands out with its commitment to innovation, compliance, and quality. With certified clean room environments and a team of skilled professionals, they provide tailored solutions across a wide range of sectors.
Whether you need one-time project support or ongoing production, FoxxTechnologies has the tools and the talent to meet your needs without compromise.
What Sets FoxxTechnologies Apart?
1. Certified Clean Room Facilities
FoxxTechnologies operates ISO Class 5 to Class 8 clean rooms, equipped with advanced air filtration and particle monitoring systems.
2. Custom Assembly Solutions
Each project is different. FoxxTechnologies collaborates with clients to design customized workflows that ensure both precision and efficiency.
3. Quality Assurance and Compliance
Every step of the assembly process is documented, tested, and verified to meet international standards. They’re not just building parts—they’re building trust.
Typical Components Assembled in Clean Rooms
Catheters and surgical tubing
Microelectronic sensors
Medical implants
Aerospace instruments
Diagnostic tools
Semiconductor chips
Advanced Technologies Used by FoxxTechnologies
1. Ultrasonic Welding
Allows for non-contaminating, heat-free joining of plastic components—ideal for medical and electronic assemblies.
2. Robotic Automation
For high-volume projects, robotic arms ensure repeatability and accuracy without human error.
3. Real-Time Monitoring
Sensors continuously measure air quality and particle count to ensure every inch of the clean room remains compliant.
Benefits of Outsourcing Clean Room Assembly
1. Cost Savings
No need to invest in clean room construction or maintenance—just outsource to a trusted provider like FoxxTechnologies.
2. Speed to Market
Experienced teams streamline the production process, getting your product ready for distribution faster.
3. Compliance and Certification
FoxxTechnologies takes care of all the regulatory requirements, ensuring your product passes inspection.
Clean Room Classifications Explained
Clean rooms are categorized by the number of particles per cubic meter. For example:
ISO Class 5: Extremely low particle count, used for semiconductor and nanotechnology work.
ISO Class 7: Suitable for pharmaceutical and aerospace applications.
ISO Class 8: Common for general electronic assemblies and packaging.
FoxxTechnologies provides services across these classifications, offering flexibility for various industry needs.
How FoxxTechnologies Maintains Clean Room Standards
Trained Technicians: Every staff member is trained on gowning procedures, handling protocols, and contamination control.
Regular Audits: Internal and third-party audits ensure the facility remains in peak condition.
Strict Entry/Exit Protocols: Air showers and multiple buffer zones reduce contamination risk.
Case Study: How FoxxTechnologies Solved a Major Manufacturing Challenge
A medical device startup needed to assemble a new type of microfluidic diagnostic tool. They required a Class 7 clean room and a reliable partner who could handle complex components without delays.
FoxxTechnologies not only met the challenge—they exceeded expectations. They designed a customized workflow, trained a dedicated team, and delivered fully assembled units within a tight timeline.
The result? A successful FDA approval and rapid market entry.
How to Get Started with FoxxTechnologies
Book a Consultation Share your project requirements and goals with the FoxxTechnologies team.
Develop a Custom Plan Work together to design the ideal clean room process for your assembly needs.
Production and Delivery Let the experts handle the rest while you focus on growing your business.
Looking Ahead: The Future of Clean Room Assembly
The future of clean room assembly is driven by automation, AI, and sustainable practices. FoxxTechnologies is investing heavily in smart monitoring systems and eco-friendly manufacturing to stay ahead of the curve.
FAQs
1. What industries benefit most from clean room assembly?
Industries like medical, aerospace, electronics, and biotech benefit greatly from clean room services due to their strict cleanliness and precision requirements.
2. How does FoxxTechnologies ensure cleanliness in assembly?
FoxxTechnologies uses certified ISO clean rooms, trained staff, and continuous environmental monitoring to guarantee zero contamination.
3. What is the average turnaround time for clean room projects?
Timelines vary by project scope, but FoxxTechnologies is known for its speed and efficiency without compromising quality.
4. Can small businesses afford clean room services?
Yes! FoxxTechnologies offers flexible plans tailored to both startups and large enterprises.
5. Are FoxxTechnologies’ services available internationally?
Absolutely. They serve clients across the globe, offering consultation and logistics support for seamless service delivery.
Conclusion
When precision, purity, and performance matter most, clean room assembly services are non-negotiable. FoxxTechnologies brings industry-leading expertise, state-of-the-art facilities, and a passion for perfection to every project. Whether you're a startup or a global enterprise, they provide scalable, reliable, and regulation-compliant clean room solutions you can count on.
Email Us : [email protected]
https://www.linkedin.com/company/foxxlifesciences
https://www.instagram.com/foxxlifesciencesglobal/
https://www.instagram.com/foxxlifesciencesglobal/
1 note
·
View note
Text
Controllers, Flowmeters, and Signal Converters
In today's highly automated industrial environments, maintaining control, accuracy, and safety is essential. From process manufacturing to water treatment, a range of instrumentation ensures that systems operate efficiently and reliably. Among the critical components used across industries are Temperature Controllers, Open Channel Flowmeters, and Signal Isolators. These devices not only optimise operations but also contribute to long-term cost savings, welfare, and regulatory compliance.
Temperature Controllers
A Temperature Controller is an indispensable device in any process where temperature needs to be accurately maintained. Whether it's a furnace, a chemical reactor, or a food processing unit, the stability of temperature directly impacts & quality and structural efficiency.
How It Labours
Temperature controllers function by receiving input from a temperature sensor, comparing it to a desired setpoint, and issuing a control signal to a heating or cooling element to right any deviation.
Kinds of Temperature Controllers
ON/Away Controllers –
Best for simple applications. They switch heating/cooling on or away.
PID Controllers –
Use complex algorithms to deliver more correct and stable control.
Programmable Controllers –
Allow multiple setpoints and hour-based operations.
Requests
HVAC structures
Plastic moulding apparatuses
Pharmaceutical procedures
Nourishment and beverage equipment
Open Channel Flowmeters
For industries that manage water or wastewater, Open Channel Flowmeters are essential tools. Unlike closed-pipe systems, open channels present unique measurement challenges due to surface current, variable flow levels, and environmental factors.
How It Labours
Most open channel flowmeters use ultrasonic or radar level sensors to measure the height of the liquid above a known geometry. The flow rate is then calculated based on this quantity and the known characteristics of the channel.
Key Goods
Non-contact Quantification –
Minimises in and contamination.
Actual-time Monitoring –
Ideal for faraway or outdoor locations.
Environmental Compliance –
Ensures correct data for regulatory reporting.
Requests
Sewage and wastewater towards
Irrigation waterways
Manufacturing effluent monitoring
Stormwater structures
Gesture Isolators
Modern industrial systems rely heavily on data from field instruments, making Signal Isolators critical for maintaining signal quality and electrical safety. These devices serve as intermediaries between sensors and controllers, conditioning and isolating the gesture.
Purposes of Signal Isolators
Separation –
Prevents ground bends and electrical interference.
Change –
Translates signals from one format to more.
Amplification –
Strengthens weak signals for reliable transference.
Why They Material
Without signal isolators, noise and electrical disturbances can lead to inaccurate readings, control errors, or even equipment failure. Isolators ensure that only clean, correct data reaches your control system.
Requests
Process control consoles
DCS and PLC structures
Hazardous district instrumentation
Remote sensor webs
End
As industries continue to automate and optimise, devices like Temperature Controllers, Open Channel Flowmeters, and Signal Isolators are more important than ever. These components not only enhance precision and efficiency but also ensure the longevity and safety of industrial operations. Investing in quality instrumentation is a strategic decision that delivers operational flexibility, regulatory compliance, and improved productivity.
#Alarm Annunciator#Modbus Display#Flameproof Indicator#Flow Indicator Totalizer#Jumbo Display#Temperature Controller#Loop Powered Indicator#IOT data logger#IOT Energy Monitoring#Open Channel Flowmeter#Temperature Transmitter#Signal Isolator
0 notes
Text
Automatic Door Market Trends: Innovations in Sensor Technology and Smart Building Applications
The automatic door market is undergoing a significant transformation, driven by advancements in sensor technology and the integration of smart building applications. These innovations are enhancing functionality, improving user experience, and contributing to energy efficiency and security in various settings.

Advancements in Sensor Technology
1. Multi-Sensing Fusion
Modern automatic doors are increasingly utilizing multi-sensing fusion, combining data from various sensors such as infrared, ultrasonic, and radar. This approach enhances detection accuracy and reliability, especially in complex environments with varying lighting conditions and traffic patterns.
2. AI and Machine Learning Integration
Artificial Intelligence (AI) and Machine Learning (ML) are being integrated into sensor systems, enabling doors to analyze user behavior and environmental conditions. This allows for adaptive responses, optimizing door operation based on real-time data and usage patterns.
3. Touchless and Gesture Recognition
In response to hygiene concerns, touchless technologies have gained prominence. Sensors now incorporate gesture recognition, allowing users to open doors with simple hand movements, reducing the need for physical contact and enhancing accessibility.
4. Enhanced Environmental Resistance
Sensors are being designed with improved resistance to environmental factors such as dust, moisture, and temperature extremes. This ensures reliable performance in diverse settings, including industrial environments and outdoor installations.
Integration with Smart Building Applications
1. IoT Connectivity and Edge Computing
Automatic doors are becoming integral components of the Internet of Things (IoT) ecosystem. Through edge computing, data is processed locally at the sensor level, enabling faster response times and reduced latency. IoT connectivity allows doors to communicate with other building systems, facilitating coordinated operations and centralized control.
2. Energy Efficiency and Sustainability
Energy-efficient designs are a growing focus, with automatic doors incorporating features like insulated panels and smart controls to minimize energy consumption. These innovations contribute to sustainability goals and can lead to significant cost savings over time.
3. Predictive Maintenance and Remote Monitoring
Integration with building management systems enables remote monitoring and predictive maintenance of automatic doors. By analyzing performance data, potential issues can be identified and addressed proactively, reducing downtime and maintenance costs.
4. Customization and Aesthetic Integration
Manufacturers are offering customizable automatic door solutions to align with architectural designs and aesthetic preferences. This trend is particularly evident in sectors like retail and hospitality, where the visual appeal of entrances plays a crucial role in customer experience.
Market Outlook
The automatic door market is poised for continued growth, driven by technological advancements and the increasing demand for smart building solutions. As sensor technologies evolve and integration with building systems becomes more seamless, automatic doors will play a pivotal role in enhancing building efficiency, security, and user convenience.
In conclusion, the convergence of advanced sensor technologies and smart building applications is reshaping the automatic door industry. These innovations are not only improving operational efficiency but also contributing to broader goals of sustainability and enhanced user experience.
0 notes
Text
Autonomous Mobile Robots Market: Driving Automation and Efficiency Across Multiple Industries Worldwide
The Autonomous Mobile Robots market is experiencing significant growth driven by several technological advancements and societal shifts. These robots, capable of performing tasks with minimal human intervention, are transforming industries such as logistics, manufacturing, healthcare, and agriculture. The market is poised to expand due to a combination of factors that include cost reduction, increased demand for automation, and advancements in artificial intelligence (AI) and sensor technologies. Below are the primary drivers of the Autonomous Mobile Robots market.

1. Rising Demand for Automation in Industrial Applications
One of the most prominent factors driving the growth of the AMR market is the growing demand for automation across industries. Automation in sectors like manufacturing, logistics, and warehousing helps improve productivity, reduce human error, and lower operational costs. Autonomous robots are particularly useful in environments where repetitive tasks are common, such as in sorting, packing, inventory management, and material handling. These robots can work 24/7 without breaks, thereby boosting operational efficiency and throughput. As companies seek to optimize their operations and stay competitive, they are increasingly adopting AMRs.
2. Cost Efficiency and Operational Savings
AMRs help businesses reduce labor costs, particularly in industries where labor shortages or high turnover rates exist. While the initial investment in AMRs can be high, the long-term savings outweigh the costs. AMRs can perform tasks faster and more efficiently than human workers, leading to a reduction in overtime pay, accidents, and operational delays. Additionally, the cost of manufacturing AMRs has been steadily declining due to advancements in technology and mass production, making them more accessible to small and medium-sized enterprises (SMEs). This affordability has contributed significantly to the adoption of AMRs across different industries.
3. Technological Advancements in Robotics and AI
The development of AI and machine learning technologies has significantly enhanced the capabilities of autonomous robots. AI algorithms allow robots to make decisions in real-time, optimize routes, and adapt to new environments. Machine learning enables AMRs to continuously improve their performance by learning from their experiences. Additionally, advancements in sensors, such as LiDAR (Light Detection and Ranging), cameras, and ultrasonic sensors, have improved the navigation and obstacle avoidance capabilities of AMRs, allowing them to work safely alongside humans in dynamic environments.
4. E-commerce and Retail Growth
The rapid expansion of e-commerce has led to an increased need for automation in warehouses and distribution centers. E-commerce companies, which need to manage a vast number of orders and maintain high service levels, are turning to AMRs for inventory management, order fulfillment, and last-mile delivery. AMRs enable these companies to meet the demand for faster delivery times and improve their overall supply chain efficiency. Retailers are also exploring autonomous robots for shelf scanning, restocking, and customer service, further driving the demand for AMRs in the retail sector.
5. Labor Shortages and Safety Concerns
Labor shortages, especially in sectors like manufacturing, logistics, and healthcare, are becoming a significant issue. Autonomous robots help fill this gap by performing tasks that would traditionally require human labor. This is particularly beneficial in industries experiencing high turnover rates or those in remote areas where labor is scarce. Additionally, AMRs improve safety by handling hazardous tasks in environments that may pose risks to human workers, such as lifting heavy objects, working in extreme conditions, or operating in high-risk environments like factories and warehouses.
6. Increased Focus on Supply Chain Optimization
Supply chain management is undergoing significant changes, and businesses are increasingly looking for ways to optimize their supply chains. AMRs play a key role in improving supply chain efficiency by automating tasks such as inventory tracking, sorting, and material handling. These robots can reduce the time it takes to move goods through a warehouse or distribution center, enhance stock visibility, and reduce the likelihood of inventory errors. As the global supply chain becomes more complex, companies are investing in AMRs to create more resilient and flexible systems.
7. Government Initiatives and Industry Regulations
Governments around the world are encouraging the development and deployment of AMRs through various initiatives, research funding, and industry regulations. The regulatory landscape is evolving to support the safe and effective use of autonomous robots in commercial settings. Policies that incentivize technological innovation and the adoption of automation technologies are propelling the market forward. Moreover, regulatory bodies are establishing safety standards to ensure that AMRs work in compliance with local laws, which enhances their adoption by enterprises looking for reliable and compliant automation solutions.
8. Global Expansion of Logistics and Freight Solutions
With the rise of global trade and international shipping, logistics companies are under pressure to improve efficiency and reduce delivery times. AMRs are increasingly being utilized in logistics centers to move goods efficiently, enabling faster sorting and distribution. Furthermore, AMRs are being employed in autonomous delivery systems, such as drones or ground-based robots, to optimize last-mile delivery. This trend is expected to grow as e-commerce giants continue to invest in autonomous solutions to meet the demands of their customers.
Conclusion
The Autonomous Mobile Robots market is poised for substantial growth driven by factors such as the rising demand for automation, cost efficiency, technological advancements, labor shortages, and a growing focus on supply chain optimization. As industries continue to embrace automation, AMRs are expected to play a central role in improving operational efficiency, safety, and productivity across a wide range of sectors. As technology evolves and the cost of adoption decreases, more businesses are likely to turn to AMRs to meet their automation needs.
0 notes
Text
How to Select the Best Well Water Testing and Monitoring Program
Choosing a well water testing and monitoring approach that is appropriate for your needs involves deliberating on your water usage requirements, local geology, and legal requirements. For residents purchasing a residence with a well or agricultural activities reliant on groundwater, developing an effective program starts with knowing how is well depth calculated and what equipment offers the most accurate information. Classical techniques such as the well depth measuring tape provide simple information, whereas contemporary tools such as Pinnacle well measurement solutions provide higher-level monitoring options for important water systems.
A good monitoring strategy begins with a solid foundation that begins with true level measurements at groundwater wells. A basic well depth gauge might be sufficient to give snapshot reads, but if operations need steady data, then a well water level sensor employing ultrasonic technology provides better capability. The portable ultrasonic level sensor has also become especially useful to property owners that must monitor a number of wells or inspect distant areas effectively. When choosing equipment, determine whether a deep well water level sensor would be beneficial for your unique well configuration, particularly in cases where water tables change greatly.
Frequency of water testing should reflect your use habits and local circumstances. In areas such as North Georgia, well level testing indicates large seasonable fluctuations, quarterly monitoring would be required over more stable territories where yearly tests are adequate. A well measurement company can perform professional well measuring services to take baseline readings and detect trends year over year. These professionals utilize specialized well-measuring formulas in order to derive sustainable yield calculations and forecast deficits before they rise to critical proportions.
For farm use or large properties, incorporating an ultrasonic water level controller into the monitoring system gives real-time notification of changes in water levels. This technology is especially useful when monitoring river flow rate close to your property to gain insight into larger hydrological trends influencing your well. When selling a house with a well, evidence of regular professional testing and a record of regular monitoring can add considerable value to property and buyer confidence.
Whether a manual or an automated monitoring system is chosen, it depends on a number of factors. Simple well measurement solutions with conventional instruments suffice for small domestic wells that have stable production. Yet large operations or those with variability appreciate continuous monitoring systems that monitor tiny changes and initiate early warnings. Contemporary methods blending periodic professional well measurement services and automated sensors commonly provide the most cost-efficient trade-off between reliability and affordability.
Consider your level monitoring needs in conjunction with water quality testing. While measuring how a well is measured emphasizes quantity, frequent chemical and biological testing ensures safety. Most monitoring systems now include both quantity and quality measurements, giving a comprehensive view of well performance. Where there are known contamination threats or specific geological conditions, additional testing beyond standard potability tests might be required to safeguard livestock, crops, or domestic use.
It's essential to develop the right monitoring plan by understanding both your current needs and future possibilities. A well-thought system should be capable of accommodating potential expansion, climate fluctuations, and water demand changes. With proper technology such as Pinnacle measurement systems, professional services, and routine maintenance, property owners can achieve trustworthy water availability while securing this precious resource for long-term viability. The investment in right monitoring is yielding dividends in avoided emergencies, most efficient use, and preserved value on the property for years to come.
#selling a home with a well#buying a home with a well#company that measures well water levels#north Georgia well level testing
0 notes
Text
CONTROL SYSTEM
All right—if the control-grid thesis is even half-right, the problem looks like a layered weapons system aimed at civilians. Any effective response has to be layered as well. I’m going to treat it exactly the way I’d decompose an integrated air-defense network: break the kill chain, distribute the surface, and harden the targets.
1. Break the Monetary Kill-Switch
The grid’s coercive power lives inside programmable money.
Keep a cash spine alive. Insist on “cash-must-be-accepted” ordinances at city and state level, lobby merchants, and simply use paper. Every cash transaction is a privacy beacon.
Spin up community and state banks—Richard Werner-style—not as nostalgia but as literal liquidity islands outside FedNow and stable-coin rails.
Diversify into bearer assets that clear peer-to-peer: silver, gold, even commodity barter tokens.
Where digital is unavoidable, route through privacy-preserving rails (Monero, Bitcoin with CoinJoin, Fedimint, Cashu). The point is not to “get rich,” it’s to keep value flows technically unlinkable to identity.
Build local mutual-credit systems or time banks; they throttle the blackmail vector because there’s nothing to freeze.
2. Starve the Identity Graph
No identity = greatly reduced leverage.
Opt out of REAL ID whenever a legal alternative exists (passport card, military ID, tribal ID). The REAL ID Act itself can’t compel states to force you.
Attack the rule-making: public-comment campaigns, state lawsuits, and legislative nullification bills that forbid extra-statutory mandates at DMVs or airports.
Push self-sovereign identity (DID, VC) pilots wrapped inside state driver’s licenses; if DMV unions get paychecks from decentralized wallets, DHS suddenly has an interoperability headache.
Keep secondary identity arsenals—foreign passports, residence permits, legal entities. That’s not disloyal; it’s redundancy.
3. Build Parallel Comms
A grid that can’t talk to you can’t command you.
Neighborhood mesh: LoRa, goTenna, Reticulum, Wi-Fi HaLow nodes on solar micro-UPS.
Commodity satellite: used VHF sat-phones, off-the-shelf S-band dishes flashed with libre firmware.
End-to-end encryption by default (Signal, Session, Matrix + OMEMO). Assume the backbone is owned; the endpoints are where we still have leverage.
4. Data Hygiene & Obfuscation
Think of personal data as weapons-grade material—store none, move little, encrypt everything.
Use open-hardware phones (GrapheneOS, Calyx) with hardware kill-switches; carry Faraday bags.
Automatic MAC address randomization, DNS-over-HTTPS and Onion routing when you must surface.
Continual data-minimization drills: scrub old cloud accounts, sanitize metadata, tokenize e-mail aliases.
Corporate counter-intel: if you work inside an agency or contractor, mirror critical records to WORM (write once, read many) media and secure legal whistle-blower channels. The fastest way to neuter black budgets is to publish ledgers.
5. Spoof and Jam the Sensors
If the network can’t see accurately, its AI decisions degrade.
Computer-vision adversarial patches on clothing, IR LED arrays around license plates and ball-caps, gait-spoofing inserts in shoes.
“Chaff” for ALPRs: temporary magnetic overlays, anti-reflective sprays, plate flippers where legal.
Acoustic jammers for short-range lidar/police drones (ultrasonic “spotlights”).
For biometric access control, cultivate mask culture under the banner of public health—use their own policy framing.
6. Harden Physical Essentials
The grid’s leverage collapses if you aren’t begging it for food, watts, or bandwidth.
Micro-grids: rooftop solar + second-life EV packs + islanding inverters. Aim for three to seven days off-grid autonomy.
Localized food loops: hydroponics, community aquaponics, seed banks.
Rain-capture and gravity filtration so utilities can’t coerce via water service.
3-D printing and CNC co-ops for spare-part sovereignty.
7. Legal & Political Flanking
Technology buys room to maneuver; policy locks gains in.
State-level Financial Privacy Acts that ban a CBDC or stable-coin as legal tender without explicit legislative vote.
Cash-transaction threshold relief; raise reporting limits, refuse “travel rule” overreach for in-state transfers.
Freedom-of-Information hit squads: litigate for the HUD/DoD ledgers, the Epstein files, dual-citizenship disclosures, and DOGE privatization contracts. Sunlight breaks conspiracy economies.
Unionize the remaining federal workers who run mainframes and mailrooms—if they strike, FedNow queues die.
8. Culture & Narrative
No technical shield survives mass compliance.
Normalize privacy as etiquette. Teach kids OPSEC the way we teach brushing teeth.
Support fiction, film, and VR that showcase decentralized worlds; narrative inoculation is real.
Faith practices, meditation, mundane rituals—anything that trains people to pause and question commands—are cognitive jammers against automated nudging.
9. Red-Team the Grid Itself
As an engineer I can’t resist: if you’re forced to build parts of the machine, design graceful-degradation paths.
Insert open-source components; closed systems can’t hide backdoors once the community starts diffing code commits.
Modular architectures expose API chokepoints you can later rate-limit or revoke.
Maintain offline firmware signing keys, not HSM-linked to a cloud KMS. The day the system turns tyrannical, possession of the keys equals the ability to brick it.
10. Coalition Economics
Finally, remember scale. Lone-wolf tactics fail against planetary infrastructure; aligned coalitions matter.
City mayors want tax bases, not riots; propose “surveillance-free enterprise zones” in exchange for business relocation.
Small banks need deposits; feed them in return for resisting Fed integration.
Rural electric co-ops, credit unions, volunteer fire departments—those are legacy decentralized institutions already trusted by their members. Bolt new tech onto them rather than trying to mint trust from scratch.
None of this is hypothetical. Every tool I’ve listed already exists in prototypes or production. The gap is coordination, not technology.
0 notes
Photo

By Dr. Charles P. Gerba and Dinesh Wadhwani A version of this article was originally published by Infection Control Today. Republished with permission. The Richter Scale developed by Charles F. Richter in 1935 used seismograph technology to measure the strength of earthquakes on a logarithmic scale from one to 8.6 (the largest earthquake on record)? (Rafferty, 2024)?. It made complicated data simple to grasp through an at-a-glance index of magnitude to help public health and safety officials anticipate impacts. Richter’s scale was largely replaced by the Moment Magnitude Scale in the late 1970s? (Ranjit Das, 2024)?, and advances in seismograph technology enabled early warning systems such as the U.S. Geological Service (USGS) ShakeAlert that detects the rumblings of potentially large temblors and sends alerts to communities before major shaking starts.? (USGS, 2017)? Standardized, more sensitive and accurate ways of measuring earthquakes improve our ability to cope with related impacts and exposures. Advances in IAQ monitor technology (see Sidebar: "Technological Advancements in IAQ Monitors") suggest a scale that helps anticipate IAQ impacts by indexing levels of exposure in real-time; e.g., wall-mounted units can detect tremors of exposure to 0.1-micron particles linked to viral load and transmission based on particle size and shape profiling (see Sidebar: “The Role of Shape in Identifying Microscopic Particles as Viruses”) a heightened sensitivity that extends to volatile organic compounds (VOCs), chemical and other pollutants enhanced by plug-and-play modules that detect certain contaminant types. Like a supercharged Richter Scale, an IAQ Exposure Index (INDOOR AIR QUALITY EXPOSURE INDEX) — as a complement to EPA’s outdoor Air Quality Index or AQI — can help: 1. Determine the scope of airborne exposures using a simple at-a-glance metric, 2. Provide an early warning system, and 3. Remediate indoor air by better managing airflow, ventilation, and purification to reduce infectious illness and other exposures. The Need in Healthcare Healthcare facilities serve the needs of high-risk individuals — such as chemotherapy patients, the immune-compromised, those with respiratory conditions, neonates, and the elderly — who are most susceptible to airborne exposures. Healthcare work also tops the list of high-proximity jobs, those involving close contact with others. Thus, a scale that provides an instant exposure metric of airborne pollutants may have seismic impacts in this vulnerable community. Placement of sensors is critical due to the way air moves through indoor spaces, and since air is “liquid” — understanding widening exposures from an ocean oil-spill helps convey the movement of pollutants in indoor air. Understanding Airborne Exposures In an oil spill, petroleum particles spread into and permeate the environment. Cleanup involves not only removing what you can see (e.g., globs of oil) but unseen particles and gaseous pollutants wafted on currents that may be the most harmful over time as they often escape detection and removal. Well-placed optical sensors, electrochemical sensors, ultrasonic sensors and conductivity sensors are used to detect oily particles and byproducts when remediating a spill? (Rika Sensor, 2023)?. Well-placed air sensors help detect what’s in the ocean of indoor air (see Sidebar: Common Air Pollutants in Healthcare Facilities), and from an infection prevention perspective; viruses, bacteria, and fungi which may circulate in air attached to other particles, Trojan-horse style? (Tellier, 2006)?. (see Sidebar: Airborne Pathogens 0 .1 Micron or Larger). An Early Warning System for IAQ As a seismograph detects even slight and unusual increases of ground motion in real-time, providing an early-warning system for seismologists, a system driven by an INDOOR AIR QUALITY EXPOSURE INDEX can alert IPC and EVS staff of potential IAQ issues and spikes. Continuous monitoring of air quality—and, say, providing a one to 10 metric for airborne viral load—will help enable early detection and intervention as a surveillance system to spot outbreaks and facilitate prompt responses to mitigate the spread of infections. By identifying and quantifying levels of airborne pollutants, an INDOOR AIR QUALITY EXPOSURE INDEX can place the focus on eliminating sources of pollutants where possible, better managing airflows, improving ventilation, and integrating air purification with building management systems? (Vrushank Mistry, 2023)?. A system to reduce airborne-source infections is best summed up by a three-circle system of air monitoring, ceiling-mount and floor based air purification, based on the principle that purifiers closer to the breathing zone of occupants are most effective ?(Cheryl K DuBois , Michael J Murphy , Amanda J Kramer , Jodi D Quam, Andrew R Fox , Ty J Oberlin, Perry W Logan, April)?(See Sidebar: “Three-Circle Venn Diagram: Air Monitoring and Purification” ). Remediate by Managing Airflow, Ventilation, and Purification Since air — though life-giving — is a carrier of pollutants, controlling the air through room pressurization and directing airflow is vital but insufficient since infectious exposure often occurs in proximity to the source before contaminated air can be removed, filtered and diluted by HVAC systems. Room- or area-based sensors integrated with ceiling-mounted or freestanding air purifiers enable crucial proximity air cleaning to intercept pollutants at the source, protect the immediate exposure zone, and lower HVAC costs since cleaner air reaching the HVAC system reduces filter changes, electricity for operating cycles, and motor wear. Conclusion Success in protecting air quality based on an INDOOR AIR QUALITY EXPOSURE INDEX involves an at-a-glance metric to make identifying complex airborne exposures simpler,?provides an early warning system for airborne pathogens, and lowers costs for HVAC, all while producing a seismic shift in protecting human health by integrating monitoring (diagnosis) and purification (treatment) in real time to improve the indoor air in healthcare facilities. Sidebar: Technological Advancements in IAQ Monitors The concept of monitoring indoor air quality (IAQ) began taking shape in the late 20th century, driven by increasing awareness of the health impacts of indoor pollutants. The first IAQ monitors were rudimentary devices that primarily measured particulate matter and basic gases such as carbon dioxide (CO2) and carbon monoxide (CO). These early monitors provided limited data and required manual reading and recording, often making them cumbersome and less effective for continuous monitoring. The evolution of IAQ monitors has been marked by numerous technological advancements, making today's devices more accurate, user-friendly, and versatile. These advancements include improvements in sensor technology, integration with smart technologies, and enhanced data analytics capabilities. Modern IAQ monitors use advanced sensor technology that allows for the detection of a broader range of pollutants with greater precision. Sensors have become more sensitive and can now measure fine particulate matter (PM2.5 and PM10), volatile organic compounds (VOCs), humidity, temperature, and other parameters. Remarkably, some units can detect 0.1 micron sized particles and particle shapes promising an early warning system for viral exposure (see Sidebar: “The Role of Shape in Identifying Microscopic Particles as Viruses”). The use of cloud computing and advanced data analytics has further revolutionized IAQ monitoring. Data collected by IAQ monitors can now be stored and analyzed over time, providing valuable insights into airflow patterns and trends in air quality. An INDOOR AIR QUALITY EXPOSURE INDEX can predict potential air quality issues and suggest or initiate proactive steps—e.g., ventilation, directed airflow, and sensor-integrated purification—to protect human health. Sidebar: The Role of Shape in Identifying Microscopic Particles as Viruses Viruses come in various shapes, each reflecting their unique structures. Here are the primary shapes: Think of Adenoviruses. They have an icosahedral shape, which means they have 20 triangular faces. This shape provides stability and symmetry.? (Solène Besson, 2020)? Consider the Tobacco mosaic virus. It has a rod-like shape, formed by protein subunits spiraled around a central axis. Look at bacteriophages. These viruses are complex, combining icosahedral and helical features, often with added structures like tails. Summing Up The shape of microscopic particles is crucial in identifying them as viruses. Using advanced techniques like electron microscopy, X-ray crystallography, and Cryo-EM, scientists can see and differentiate these pathogens based on their unique forms. This knowledge is vital for diagnostics, vaccine development, and tracking outbreaks. Sophisticated air monitoring systems can now also help identify viral shapes, ultimately helping us understand distribution patterns and prevent viral infections. Sidebar: Common Air Pollutants in Healthcare Facilities Particulate Matter (PM) Particulate matter refers to a mixture of airborne solid particles and liquid droplets. These particles when inhaled can impact health. Sources of PM in healthcare facilities include: • Linens and bedding generate fine textile dust. • Skin flakes from patients and staff. An average person sheds about 600,000 skin flakes every day or 1.5 pounds of skin cells shed per year [Texas A&M University]. • Indoor Activities: Certain medical procedures and laboratory activities can produce particulate matter. • Construction Activities: Renovation and construction work within healthcare facilities can generate dust and other particulate matter. • Outdoor Air: Particulate matter from outside can infiltrate the building through ventilation systems. Pathogens In healthcare settings, airborne pathogens are a significant concern, including: • Fungi: Molds and other fungi can grow in damp areas and release spores that may cause allergic reactions and infections. Volatile Organic Compounds (VOCs) VOCs are chemicals that become airborne as vapors or gases. They are released from various sources within healthcare facilities, including: • Cleaning Agents: Many disinfectants and cleaning solutions emit VOCs which can contribute to respiratory issues and other health problems. • Medical Equipment, Materials: Some medical devices and materials can release VOCs. • Building Materials: Paints, adhesives, and synthetic materials used in the construction and maintenance of healthcare facilities often emit VOCs. Chemical Contaminants Healthcare facilities often use various chemicals that can contaminate the air, including: • Disinfectants and Sterilants • Pharmaceutical Compounds Gases such as carbon monoxide (CO) and nitrogen dioxide (NO2) can originate from: • Combustion Processes: Heating systems, generators, and other combustion sources can emit harmful gases. • Medical Gas Systems: Leaks and emissions from medical gas systems can introduce pollutants into the indoor air. Sidebar: Airborne Pathogens 0.1 Micron or Larger The sizes of some airborne bacteria in microns are as follows: Sidebar: Three-Circle Venn Diagram: Air Monitoring and Purification An integrated approach to diagnosing and treating indoor air best is described by a three-circle Venn chart. Three-Circle Venn Diagram: Air Purification and Monitoring This Venn diagram explores how three essential elements of air purification and monitoring intersect: Effective Air Monitoring • Collects real-time data • Analyzes air quality • Detects pollutants and allergens Ceiling Mount Air Purifiers • Permanently installed Rolling Floor Air Purifiers • Clean the air in a targeted approach Effective Air Monitoring and Ceiling Mount Air Purifiers mean continuous air quality control combined with high-efficiency purification for large spaces. Effective Air Monitoring and Rolling Floor Air Purifiers provide real-time air quality feedback with mobile air cleaning solutions for adaptable environments. Ceiling Mount Air Purifiers and Rolling Floor Air Purifiers offer a comprehensive air purification strategy utilizing both fixed and portable units for maximum coverage. Combining all three—Effective Air Monitoring, Ceiling Mount Air Purifiers, and Rolling Floor Air Purifiers—gives you an integrated system to achieve 4-log purification (99.99%) of airborne particles, pathogens and their carriers, down to 0.1 micron. This setup offers extensive air quality monitoring and versatile purification options, ensuring optimal indoor air quality in any setting. Authors Charles P. Gerba PhD Professor of Environmental Microbiology, University of Arizona. Charles P. Gerba, PhD is an internationally recognized environmental microbiologist and Professor of Environmental Microbiology in the Departments of Microbiology and Immunology, and Soil, Water and Environmental Science, at the University of Arizona. His credentials include a BA in Microbiology, Arizona State University, 1969, and a PhD in Microbiology, University of Miami, Florida, 1973. He is also a member of the American Academy of Microbiology. Dinesh Wadhwani Dinesh Wadhwani is an industry, air quality and lighting expert, entrepreneur in the technology and life sciences industries, and Founder/CEO of ThinkLite. At ThinkLite, he works with a team of engineers to create “high value add” technological solutions in diverse fields including pharmaceutical, agriculture, poultry, data centers, general health and most recently, a technology solution that tracks the levels of airborne pathogens in indoor public areas and facilities, including COVID-19, among other viruses; so they can be addressed and managed to help optimize health and safety indoors. ??References ??Cheryl K DuBois , Michael J Murphy , Amanda J Kramer , Jodi D Quam, Andrew R Fox , Ty J Oberlin, Perry W Logan. (April, 2022 8). Use of portable air purifiers as local exhaust ventilation during COVID-19 . Retrieved from PubMed and Journal of Occupational and Environmental Hygiene: https://pubmed.ncbi.nlm.nih.gov/35290164/ ?Fennelly, K. P. (2020, September ). Particle sizes of infectious aerosols: implications for infection control. Retrieved from The Lancet: https://www.thelancet.com/journals/lanres/article/piis2213-2600(20)30323-4/fulltext ?Rafferty, J. P. (2024, October 19). Richter scale. Retrieved from Encyclopedia Brittanica: https://www.britannica.com/science/Richter-scale ?Ranjit Das, M. L. (2024, March 28). Comment on “A Seismic Moment Magnitude Scale”. Retrieved from Bulletin of the Seismological Society of America: https://pubs.geoscienceworld.org/ssa/bssa/article-abstract/114/4/2270/637047/Comment-on-A-Seismic-Moment-Magnitude-Scale-by?redirectedFrom=fulltext ?Rika Sensor. (2023, August 7). What Sensor Can I Use To Detect Oil In Water? Retrieved from Rika Sensor: https://www.rikasensor.com/what-sensor-can-i-use-to-detect-oil-in-water.html ?Solène Besson, C. V. (2020, July). The Adenovirus Dodecahedron: Beyond the Platonic Story. Retrieved from ResearchGate: https://www.researchgate.net/publication/342687794_The_Adenovirus_Dodecahedron_Beyond_the_Platonic_Story ?Tellier, R. (2006, November). Review of Aerosol Transmission of Influenza A Virus. Retrieved from CDC: https://wwwnc.cdc.gov/eid/article/12/11/06-0426_article ?USGS. (2017, April 6). “ShakeAlert” Earthquake Early Warning System Goes West Coast Wide. Retrieved from USGS.gov: https://www.usgs.gov/news/state-news-release/shakealert-earthquake-early-warning-system-goes-west-coast-wide ?Vrushank Mistry. (2023, December). Impact of Building Automation on Indoor Air Quality and HVAC Performance. Retrieved from ResearchGate: https://www.researchgate.net/publication/378416265_Impact_of_Building_Automation_on_Indoor_Air_Quality_and_HVAC_Performance Source link
0 notes