#Visual Web Scraping Tool
Explore tagged Tumblr posts
Visit Tumblr Blog
Explore Tumblr blogs with no restrictions, modern design and the best experience.
Last Seen Tumblr Blogs


Fun Fact
Tumblr has a 66 index score for customer satisfaction in the US.
Link
0 notes
Text
Regardless of what companies and investors may say, artificial intelligence is not actually intelligent in the way most humans would understand it. To generate words and images, AI tools are trained on large databases of training data that is often scraped off the open web in unimaginably large quantities, no matter who owns it or what biases come along with it. When a user then prompts ChatGPT or DALL-E to spit out some text or visuals, the tools aren’t thinking about the best way to represent those prompts because they don’t have that ability. They’re comparing the terms they’re presented with the patterns they formed from all the data that was ingested to train their models, then trying to assemble elements from that data to reflect what the user is looking for. In short, you can think of it like a more advanced form of autocorrect on your phone’s keyboard, predicting what you might want to say next based on what you’ve already written and typed out in the past. If it’s not clear, that means these systems don’t create; they plagiarize. Unlike a human artist, they can’t develop a new artistic style or literary genre. They can only take what already exists and put elements of it together in a way that responds to the prompts they’re given. There’s good reason to be concerned about what that will mean for the art we consume, and the richness of the human experience.
[...]
AI tools will not eliminate human artists, regardless of what corporate executives might hope. But it will allow companies to churn out passable slop to serve up to audiences at a lower cost. In that way, it allows a further deskilling of art and devaluing of artists because instead of needing a human at the center of the creative process, companies can try to get computers to churn out something good enough, then bring in a human with no creative control and a lower fee to fix it up. As actor Keanu Reeves put it to Wired earlier this year, “there’s a corporatocracy behind [AI] that’s looking to control those things. … The people who are paying you for your art would rather not pay you. They’re actively seeking a way around you, because artists are tricky.” To some degree, this is already happening. Actors and writers in Hollywood are on strike together for the first time in decades. That’s happening not just because of AI, but how the movie studios and steaming companies took advantage of the shift to digital technologies to completely remake the business model so workers would be paid less and have less creative input. Companies have already been using AI tools to assess scripts, and that’s one example of how further consolidation paired with new technologies are leading companies to prioritize “content” over art. The actors and writers worry that if they don’t fight now, those trends will continue — and that won’t just be bad for them, but for the rest of us too.
286 notes
·
View notes
Text
In the subject of data analytics, this is the most important concept that everyone needs to understand. The capacity to draw insightful conclusions from data is a highly sought-after talent in today's data-driven environment. In this process, data analytics is essential because it gives businesses the competitive edge by enabling them to find hidden patterns, make informed decisions, and acquire insight. This thorough guide will take you step-by-step through the fundamentals of data analytics, whether you're a business professional trying to improve your decision-making or a data enthusiast eager to explore the world of analytics.
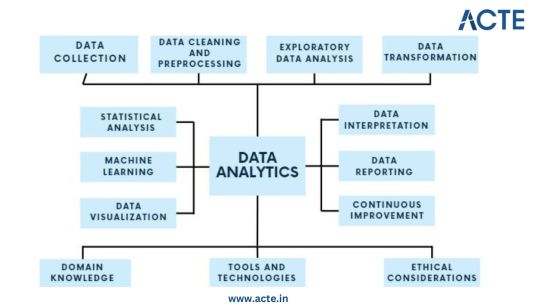
Step 1: Data Collection - Building the Foundation
Identify Data Sources: Begin by pinpointing the relevant sources of data, which could include databases, surveys, web scraping, or IoT devices, aligning them with your analysis objectives. Define Clear Objectives: Clearly articulate the goals and objectives of your analysis to ensure that the collected data serves a specific purpose. Include Structured and Unstructured Data: Collect both structured data, such as databases and spreadsheets, and unstructured data like text documents or images to gain a comprehensive view. Establish Data Collection Protocols: Develop protocols and procedures for data collection to maintain consistency and reliability. Ensure Data Quality and Integrity: Implement measures to ensure the quality and integrity of your data throughout the collection process.
Step 2: Data Cleaning and Preprocessing - Purifying the Raw Material
Handle Missing Values: Address missing data through techniques like imputation to ensure your dataset is complete. Remove Duplicates: Identify and eliminate duplicate entries to maintain data accuracy. Address Outliers: Detect and manage outliers using statistical methods to prevent them from skewing your analysis. Standardize and Normalize Data: Bring data to a common scale, making it easier to compare and analyze. Ensure Data Integrity: Ensure that data remains accurate and consistent during the cleaning and preprocessing phase.
Step 3: Exploratory Data Analysis (EDA) - Understanding the Data
Visualize Data with Histograms, Scatter Plots, etc.: Use visualization tools like histograms, scatter plots, and box plots to gain insights into data distributions and patterns. Calculate Summary Statistics: Compute summary statistics such as means, medians, and standard deviations to understand central tendencies. Identify Patterns and Trends: Uncover underlying patterns, trends, or anomalies that can inform subsequent analysis. Explore Relationships Between Variables: Investigate correlations and dependencies between variables to inform hypothesis testing. Guide Subsequent Analysis Steps: The insights gained from EDA serve as a foundation for guiding the remainder of your analytical journey.
Step 4: Data Transformation - Shaping the Data for Analysis
Aggregate Data (e.g., Averages, Sums): Aggregate data points to create higher-level summaries, such as calculating averages or sums. Create New Features: Generate new features or variables that provide additional context or insights. Encode Categorical Variables: Convert categorical variables into numerical representations to make them compatible with analytical techniques. Maintain Data Relevance: Ensure that data transformations align with your analysis objectives and domain knowledge.
Step 5: Statistical Analysis - Quantifying Relationships
Hypothesis Testing: Conduct hypothesis tests to determine the significance of relationships or differences within the data. Correlation Analysis: Measure correlations between variables to identify how they are related. Regression Analysis: Apply regression techniques to model and predict relationships between variables. Descriptive Statistics: Employ descriptive statistics to summarize data and provide context for your analysis. Inferential Statistics: Make inferences about populations based on sample data to draw meaningful conclusions.
Step 6: Machine Learning - Predictive Analytics
Algorithm Selection: Choose suitable machine learning algorithms based on your analysis goals and data characteristics. Model Training: Train machine learning models using historical data to learn patterns. Validation and Testing: Evaluate model performance using validation and testing datasets to ensure reliability. Prediction and Classification: Apply trained models to make predictions or classify new data. Model Interpretation: Understand and interpret machine learning model outputs to extract insights.
Step 7: Data Visualization - Communicating Insights
Chart and Graph Creation: Create various types of charts, graphs, and visualizations to represent data effectively. Dashboard Development: Build interactive dashboards to provide stakeholders with dynamic views of insights. Visual Storytelling: Use data visualization to tell a compelling and coherent story that communicates findings clearly. Audience Consideration: Tailor visualizations to suit the needs of both technical and non-technical stakeholders. Enhance Decision-Making: Visualization aids decision-makers in understanding complex data and making informed choices.
Step 8: Data Interpretation - Drawing Conclusions and Recommendations
Recommendations: Provide actionable recommendations based on your conclusions and their implications. Stakeholder Communication: Communicate analysis results effectively to decision-makers and stakeholders. Domain Expertise: Apply domain knowledge to ensure that conclusions align with the context of the problem.
Step 9: Continuous Improvement - The Iterative Process
Monitoring Outcomes: Continuously monitor the real-world outcomes of your decisions and predictions. Model Refinement: Adapt and refine models based on new data and changing circumstances. Iterative Analysis: Embrace an iterative approach to data analysis to maintain relevance and effectiveness. Feedback Loop: Incorporate feedback from stakeholders and users to improve analytical processes and models.
Step 10: Ethical Considerations - Data Integrity and Responsibility
Data Privacy: Ensure that data handling respects individuals' privacy rights and complies with data protection regulations. Bias Detection and Mitigation: Identify and mitigate bias in data and algorithms to ensure fairness. Fairness: Strive for fairness and equitable outcomes in decision-making processes influenced by data. Ethical Guidelines: Adhere to ethical and legal guidelines in all aspects of data analytics to maintain trust and credibility.
Data analytics is an exciting and profitable field that enables people and companies to use data to make wise decisions. You'll be prepared to start your data analytics journey by understanding the fundamentals described in this guide. To become a skilled data analyst, keep in mind that practice and ongoing learning are essential. If you need help implementing data analytics in your organization or if you want to learn more, you should consult professionals or sign up for specialized courses. The ACTE Institute offers comprehensive data analytics training courses that can provide you the knowledge and skills necessary to excel in this field, along with job placement and certification. So put on your work boots, investigate the resources, and begin transforming.
24 notes
·
View notes
Text
Tapping into Fresh Insights: Kroger Grocery Data Scraping
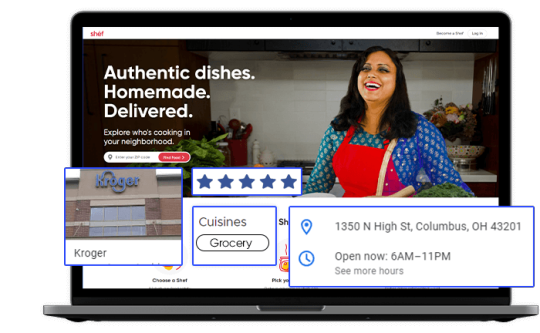
In today's data-driven world, the retail grocery industry is no exception when it comes to leveraging data for strategic decision-making. Kroger, one of the largest supermarket chains in the United States, offers a wealth of valuable data related to grocery products, pricing, customer preferences, and more. Extracting and harnessing this data through Kroger grocery data scraping can provide businesses and individuals with a competitive edge and valuable insights. This article explores the significance of grocery data extraction from Kroger, its benefits, and the methodologies involved.
The Power of Kroger Grocery Data
Kroger's extensive presence in the grocery market, both online and in physical stores, positions it as a significant source of data in the industry. This data is invaluable for a variety of stakeholders:
Kroger: The company can gain insights into customer buying patterns, product popularity, inventory management, and pricing strategies. This information empowers Kroger to optimize its product offerings and enhance the shopping experience.
Grocery Brands: Food manufacturers and brands can use Kroger's data to track product performance, assess market trends, and make informed decisions about product development and marketing strategies.
Consumers: Shoppers can benefit from Kroger's data by accessing information on product availability, pricing, and customer reviews, aiding in making informed purchasing decisions.
Benefits of Grocery Data Extraction from Kroger
Market Understanding: Extracted grocery data provides a deep understanding of the grocery retail market. Businesses can identify trends, competition, and areas for growth or diversification.
Product Optimization: Kroger and other retailers can optimize their product offerings by analyzing customer preferences, demand patterns, and pricing strategies. This data helps enhance inventory management and product selection.
Pricing Strategies: Monitoring pricing data from Kroger allows businesses to adjust their pricing strategies in response to market dynamics and competitor moves.
Inventory Management: Kroger grocery data extraction aids in managing inventory effectively, reducing waste, and improving supply chain operations.
Methodologies for Grocery Data Extraction from Kroger
To extract grocery data from Kroger, individuals and businesses can follow these methodologies:
Authorization: Ensure compliance with Kroger's terms of service and legal regulations. Authorization may be required for data extraction activities, and respecting privacy and copyright laws is essential.
Data Sources: Identify the specific data sources you wish to extract. Kroger's data encompasses product listings, pricing, customer reviews, and more.
Web Scraping Tools: Utilize web scraping tools, libraries, or custom scripts to extract data from Kroger's website. Common tools include Python libraries like BeautifulSoup and Scrapy.
Data Cleansing: Cleanse and structure the scraped data to make it usable for analysis. This may involve removing HTML tags, formatting data, and handling missing or inconsistent information.
Data Storage: Determine where and how to store the scraped data. Options include databases, spreadsheets, or cloud-based storage.
Data Analysis: Leverage data analysis tools and techniques to derive actionable insights from the scraped data. Visualization tools can help present findings effectively.
Ethical and Legal Compliance: Scrutinize ethical and legal considerations, including data privacy and copyright. Engage in responsible data extraction that aligns with ethical standards and regulations.
Scraping Frequency: Exercise caution regarding the frequency of scraping activities to prevent overloading Kroger's servers or causing disruptions.
Conclusion
Kroger grocery data scraping opens the door to fresh insights for businesses, brands, and consumers in the grocery retail industry. By harnessing Kroger's data, retailers can optimize their product offerings and pricing strategies, while consumers can make more informed shopping decisions. However, it is crucial to prioritize ethical and legal considerations, including compliance with Kroger's terms of service and data privacy regulations. In the dynamic landscape of grocery retail, data is the key to unlocking opportunities and staying competitive. Grocery data extraction from Kroger promises to deliver fresh perspectives and strategic advantages in this ever-evolving industry.
#grocerydatascraping#restaurant data scraping#food data scraping services#food data scraping#fooddatascrapingservices#zomato api#web scraping services#grocerydatascrapingapi#restaurantdataextraction
4 notes
·
View notes
Text
How Python Can Be Used in Finance: Applications, Benefits & Real-World Examples

In the rapidly evolving world of finance, staying ahead of the curve is essential. One of the most powerful tools at the intersection of technology and finance today is Python. Known for its simplicity and versatility, Python has become a go-to programming language for financial professionals, data scientists, and fintech companies alike.
This blog explores how Python is used in finance, the benefits it offers, and real-world examples of its applications in the industry.
Why Python in Finance?
Python stands out in the finance world because of its:
Ease of use: Simple syntax makes it accessible to professionals from non-programming backgrounds.
Rich libraries: Packages like Pandas, NumPy, Matplotlib, Scikit-learn, and PyAlgoTrade support a wide array of financial tasks.
Community support: A vast, active user base means better resources, tutorials, and troubleshooting help.
Integration: Easily interfaces with databases, Excel, web APIs, and other tools used in finance.
Key Applications of Python in Finance
1. Data Analysis & Visualization
Financial analysis relies heavily on large datasets. Python’s libraries like Pandas and NumPy are ideal for:
Time-series analysis
Portfolio analysis
Risk assessment
Cleaning and processing financial data
Visualization tools like Matplotlib, Seaborn, and Plotly allow users to create interactive charts and dashboards.
2. Algorithmic Trading
Python is a favorite among algo traders due to its speed and ease of prototyping.
Backtesting strategies using libraries like Backtrader and Zipline
Live trading integration with brokers via APIs (e.g., Alpaca, Interactive Brokers)
Strategy optimization using historical data
3. Risk Management & Analytics
With Python, financial institutions can simulate market scenarios and model risk using:
Monte Carlo simulations
Value at Risk (VaR) models
Stress testing
These help firms manage exposure and regulatory compliance.
4. Financial Modeling & Forecasting
Python can be used to build predictive models for:
Stock price forecasting
Credit scoring
Loan default prediction
Scikit-learn, TensorFlow, and XGBoost are popular libraries for machine learning applications in finance.
5. Web Scraping & Sentiment Analysis
Real-time data from financial news, social media, and websites can be scraped using BeautifulSoup and Scrapy. Python’s NLP tools (like NLTK, spaCy, and TextBlob) can be used for sentiment analysis to gauge market sentiment and inform trading strategies.
Benefits of Using Python in Finance
✅ Fast Development
Python allows for quick development and iteration of ideas, which is crucial in a dynamic industry like finance.
✅ Cost-Effective
As an open-source language, Python reduces licensing and development costs.
✅ Customization
Python empowers teams to build tailored solutions that fit specific financial workflows or trading strategies.
✅ Scalability
From small analytics scripts to large-scale trading platforms, Python can handle applications of various complexities.
Real-World Examples
💡 JPMorgan Chase
Developed a proprietary Python-based platform called Athena to manage risk, pricing, and trading across its investment banking operations.
💡 Quantopian (acquired by Robinhood)
Used Python for developing and backtesting trading algorithms. Users could write Python code to create and test strategies on historical market data.
💡 BlackRock
Utilizes Python for data analytics and risk management to support investment decisions across its portfolio.
💡 Robinhood
Leverages Python for backend services, data pipelines, and fraud detection algorithms.
Getting Started with Python in Finance
Want to get your hands dirty? Here are a few resources:
Books:
Python for Finance by Yves Hilpisch
Machine Learning for Asset Managers by Marcos López de Prado
Online Courses:
Coursera: Python and Statistics for Financial Analysis
Udemy: Python for Financial Analysis and Algorithmic Trading
Practice Platforms:
QuantConnect
Alpaca
Interactive Brokers API
Final Thoughts
Python is transforming the financial industry by providing powerful tools to analyze data, build models, and automate trading. Whether you're a finance student, a data analyst, or a hedge fund quant, learning Python opens up a world of possibilities.
As finance becomes increasingly data-driven, Python will continue to be a key differentiator in gaining insights and making informed decisions.
Do you work in finance or aspire to? Want help building your first Python financial model? Let me know, and I’d be happy to help!
#outfit#branding#financial services#investment#finance#financial advisor#financial planning#financial wellness#financial freedom#fintech
0 notes
Text
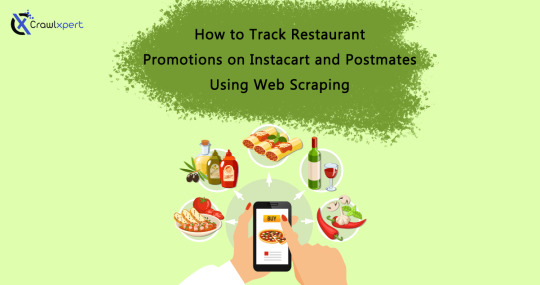
How to Track Restaurant Promotions on Instacart and Postmates Using Web Scraping
Introduction
With the rapid growth of food delivery services, companies such as Instacart and Postmates are constantly advertising for their restaurants to entice customers. Such promotions can range from discounts and free delivery to combinations and limited-time offers. For restaurants and food businesses, tracking these promotions gives them a competitive edge to better adjust their pricing strategies, identify trends, and stay ahead of their competitors.
One of the topmost ways to track promotions is using web scraping, which is an automated way of extracting relevant data from the internet. This article examines how to track restaurant promotions from Instacart and Postmates using the techniques, tools, and best practices in web scraping.
Why Track Restaurant Promotions?
1. Contest Research
Identify promotional strategies of competitors in the market.
Compare their discounting rates between restaurants.
Create pricing strategies for competitiveness.
2. Consumer Behavior Intuition
Understand what kinds of promotions are the most patronized by customers.
Deducing patterns that emerge determine what day, time, or season discounts apply.
Marketing campaigns are also optimized based on popular promotions.
3. Distribution Profit Maximization
Determine the optimum timing for promotion in restaurants.
Analyzing competitors' discounts and adjusting is critical to reducing costs.
Maximize the Return on investments, and ROI of promotional campaigns.
Web Scraping Techniques for Tracking Promotions
Key Data Fields to Extract
To effectively monitor promotions, businesses should extract the following data:
Restaurant Name – Identify which restaurants are offering promotions.
Promotion Type – Discounts, BOGO (Buy One Get One), free delivery, etc.
Discount Percentage – Measure how much customers save.
Promo Start & End Date – Track duration and frequency of offers.
Menu Items Included – Understand which food items are being promoted.
Delivery Charges - Compare free vs. paid delivery promotions.
Methods of Extracting Promotional Data
1. Web Scraping with Python
Using Python-based libraries such as BeautifulSoup, Scrapy, and Selenium, businesses can extract structured data from Instacart and Postmates.
2. API-Based Data Extraction
Some platforms provide official APIs that allow restaurants to retrieve promotional data. If available, APIs can be an efficient and legal way to access data without scraping.
3. Cloud-Based Web Scraping Tools
Services like CrawlXpert, ParseHub, and Octoparse offer automated scraping solutions, making data extraction easier without coding.
Overcoming Anti-Scraping Measures
1. Avoiding IP Blocks
Use proxy rotation to distribute requests across multiple IP addresses.
Implement randomized request intervals to mimic human behavior.
2. Bypassing CAPTCHA Challenges
Use headless browsers like Puppeteer or Playwright.
Leverage CAPTCHA-solving services like 2Captcha.
3. Handling Dynamic Content
Use Selenium or Puppeteer to interact with JavaScript-rendered content.
Scrape API responses directly when possible.
Analyzing and Utilizing Promotion Data
1. Promotional Dashboard Development
Create a real-time dashboard to track ongoing promotions.
Use data visualization tools like Power BI or Tableau to monitor trends.
2. Predictive Analysis for Promotions
Use historical data to forecast future discounts.
Identify peak discount periods and seasonal promotions.
3. Custom Alerts for Promotions
Set up automated email or SMS alerts when competitors launch new promotions.
Implement AI-based recommendations to adjust restaurant pricing.
Ethical and Legal Considerations
Comply with robots.txt guidelines when scraping data.
Avoid excessive server requests to prevent website disruptions.
Ensure extracted data is used for legitimate business insights only.
Conclusion
Web scraping allows tracking restaurant promotions at Instacart and Postmates so that businesses can best optimize their pricing strategies to maximize profits and stay ahead of the game. With the help of automation, proxies, headless browsing, and AI analytics, businesses can beautifully keep track of and respond to the latest promotional trends.
CrawlXpert is a strong provider of automated web scraping services that help restaurants follow promotions and analyze competitors' strategies.
0 notes
Text
Unlocking Data Science's Potential: Transforming Data into Perceptive Meaning
Data is created on a regular basis in our digitally connected environment, from social media likes to financial transactions and detection labour. However, without the ability to extract valuable insights from this enormous amount of data, it is not very useful. Data insight can help you win in that situation. Online Course in Data Science It is a multidisciplinary field that combines computer knowledge, statistics, and subject-specific expertise to evaluate data and provide useful perception. This essay will explore the definition of data knowledge, its essential components, its significance, and its global transubstantiation diligence.
Understanding Data Science: To find patterns and shape opinions, data wisdom essentially entails collecting, purifying, testing, and analysing large, complicated datasets. It combines a number of fields.
Statistics: To establish predictive models and derive conclusions.
Computer intelligence: For algorithm enforcement, robotization, and coding.
Sphere moxie: To place perceptivity in a particular field of study, such as healthcare or finance.
It is the responsibility of a data scientist to pose pertinent queries, handle massive amounts of data effectively, and produce findings that have an impact on operations and strategy.
The Significance of Data Science
1. Informed Decision Making: To improve the stoner experience, streamline procedures, and identify emerging trends, associations rely on data-driven perception.
2. Increased Effectiveness: Businesses can decrease manual labour by automating operations like spotting fraudulent transactions or managing AI-powered customer support.
3. Acclimatised Gests: Websites like Netflix and Amazon analyse user data to provide suggestions for products and verified content.
4. Improvements in Medicine: Data knowledge helps with early problem diagnosis, treatment development, and bodying medical actions.
Essential Data Science Foundations:
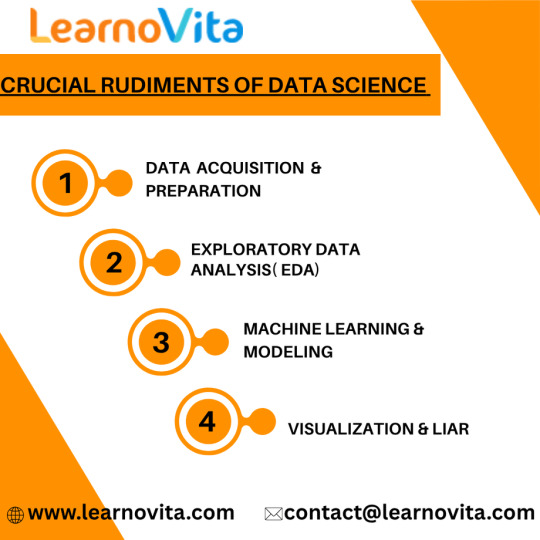
1. Data Acquisition & Preparation: Databases, web scraping, APIs, and detectors are some sources of data. Before analysis starts, it is crucial to draw the data, correct offences, eliminate duplicates, and handle missing values.
2. Exploratory Data Analysis (EDA): EDA identifies patterns in data, describes anomalies, and comprehends the relationships between variables by using visualisation tools such as Seaborn or Matplotlib.
3. Modelling & Machine Learning: By using techniques like
Retrogression: For predicting numerical patterns.
Bracket: Used for data sorting (e.g., spam discovery).
For group segmentation (such as client profiling), clustering is used.
Data scientists create models that automate procedures and predict problems. Enrol in a reputable software training institution's Data Science course.
4. Visualisation & Liar: For stakeholders who are not technical, visual tools such as Tableau and Power BI assist in distilling complex data into understandable, captivating dashboards and reports.
Data Science Activities Across Diligence:
1. Online shopping
personalised recommendations for products.
Demand-driven real-time pricing schemes.
2. Finance & Banking
identifying deceptive conditioning.
trading that is automated and powered by predictive analytics.
3. Medical Care
tracking the spread of complaints and formulating therapeutic suggestions.
using AI to improve medical imaging.
4. Social Media
assessing public opinion and stoner sentiment.
curation of feeds and optimisation of content.
Typical Data Science Challenges:
Despite its potential, data wisdom has drawbacks.
Ethics & Sequestration: Preserving stoner data and preventing algorithmic prejudice.
Data Integrity: Inaccurate perception results from low-quality data.
Scalability: Pall computing and other high-performance structures are necessary for managing large datasets.
The Road Ahead:
As artificial intelligence advances, data wisdom will remain a crucial motorist of invention. unborn trends include :
AutoML – Making machine literacy accessible to non-specialists.
Responsible AI – icing fairness and translucency in automated systems.
Edge Computing – Bringing data recycling near to the source for real- time perceptivity.
Conclusion:
Data wisdom is reconsidering how businesses, governments, and healthcare providers make opinions by converting raw data into strategic sapience. Its impact spans innumerous sectors and continues to grow. With rising demand for professed professionals, now is an ideal time to explore this dynamic field.
0 notes
Text
🏏 Cricket Meets Code: Extract IPL Player Performance Data with Python.

Want to decode what truly drives IPL success—beyond the scoreboard? This guide from RealDataAPI walks you through web scraping IPL match & player stats using Python, empowering analysts, developers, and fantasy sports enthusiasts to unlock deep performance insights from every over and innings.
📌 What You'll Learn:
🔍 How to scrape match, player, and team data from IPL sites
🧠 Python tools & libraries for fast, reliable data extraction
📈 Performance analytics for fantasy leagues, betting models & sports media
🤖 Turn scraped data into predictive insights using Pandas & visualizations
📂 Ready-to-use, structured datasets for deeper statistical modeling 📩 Contact us: [email protected]
0 notes
Text
Top 7 Use Cases of Web Scraping in E-commerce
In the fast-paced world of online retail, data is more than just numbers; it's a powerful asset that fuels smarter decisions and competitive growth. With thousands of products, fluctuating prices, evolving customer behaviors, and intense competition, having access to real-time, accurate data is essential. This is where internet scraping comes in.
Internet scraping (also known as web scraping) is the process of automatically extracting data from websites. In the e-commerce industry, it enables businesses to collect actionable insights to optimize product listings, monitor prices, analyze trends, and much more.

In this blog, we’ll explore the top 7 use cases of internet scraping, detailing how each works, their benefits, and why more companies are investing in scraping solutions for growth and competitive advantage.
What is Internet Scraping?
Internet scraping is the process of using bots or scripts to collect data from web pages. This includes prices, product descriptions, reviews, inventory status, and other structured or unstructured data from various websites. Scraping can be used once or scheduled periodically to ensure continuous monitoring. It’s important to adhere to data guidelines, terms of service, and ethical practices. Tools and platforms like TagX ensure compliance and efficiency while delivering high-quality data.
In e-commerce, this practice becomes essential for businesses aiming to stay agile in a saturated and highly competitive market. Instead of manually gathering data, which is time-consuming and prone to errors, internet scraping automates this process and provides scalable, consistent insights at scale.
Before diving into the specific use cases, it's important to understand why so many successful e-commerce companies rely on internet scraping. From competitive pricing to customer satisfaction, scraping empowers businesses to make informed decisions quickly and stay one step ahead in the fast-paced digital landscape.
Below are the top 7 Use cases of internet scraping.
1. Price Monitoring
Online retailers scrape competitor sites to monitor prices in real-time, enabling dynamic pricing strategies and maintaining competitiveness. This allows brands to react quickly to price changes.
How It Works
It is programmed to extract pricing details for identical or similar SKUs across competitor sites. The data is compared to your product catalog, and dashboards or alerts are generated to notify you of changes. The scraper checks prices across various time intervals, such as hourly, daily, or weekly, depending on the market's volatility. This ensures businesses remain up-to-date with any price fluctuations that could impact their sales or profit margins.
Benefits of Price Monitoring
Competitive edge in pricing
Avoids underpricing or overpricing
Enhances profit margins while remaining attractive to customers
Helps with automatic repricing tools
Allows better seasonal pricing strategies
2. Product Catalog Optimization
Scraping competitor and marketplace listings helps optimize your product catalog by identifying missing information, keyword trends, or layout strategies that convert better.
How It Works
Scrapers collect product titles, images, descriptions, tags, and feature lists. The data is analyzed to identify gaps and opportunities in your listings. AI-driven catalog optimization tools use this scraped data to recommend ideal product titles, meta tags, and visual placements. Combining this with A/B testing can significantly improve your conversion rates.
Benefits
Better product visibility
Enhanced user experience and conversion rates
Identifies underperforming listings
Helps curate high-performing metadata templates
3. Competitor Analysis
Internet scraping provides detailed insights into your competitors’ strategies, such as pricing, promotions, product launches, and customer feedback, helping to shape your business approach.
How It Works
Scraped data from competitor websites and social platforms is organized and visualized for comparison. It includes pricing, stock levels, and promotional tactics. You can monitor their advertising frequency, ad types, pricing structure, customer engagement strategies, and feedback patterns. This creates a 360-degree understanding of what works in your industry.
Benefits
Uncover competitive trends
Benchmark product performance
Inform marketing and product strategy
Identify gaps in your offerings
Respond quickly to new product launches
4. Customer Sentiment Analysis
By scraping reviews and ratings from marketplaces and product pages, businesses can evaluate customer sentiment, discover pain points, and improve service quality.
How It Works
Natural language processing (NLP) is applied to scraped review content. Positive, negative, and neutral sentiments are categorized, and common themes are highlighted. Text analysis on these reviews helps detect not just satisfaction levels but also recurring quality issues or logistics complaints. This can guide product improvements and operational refinements.
Benefits
Improve product and customer experience
Monitor brand reputation
Address negative feedback proactively
Build trust and transparency
Adapt to changing customer preferences
5. Inventory and Availability Tracking
Track your competitors' stock levels and restocking schedules to predict demand and plan your inventory efficiently.
How It Works
Scrapers monitor product availability indicators (like "In Stock", "Out of Stock") and gather timestamps to track restocking frequency. This enables brands to respond quickly to opportunities when competitors go out of stock. It also supports real-time alerts for critical stock thresholds.
Benefits
Avoid overstocking or stockouts
Align promotions with competitor shortages
Streamline supply chain decisions
Improve vendor negotiation strategies
Forecast demand more accurately
6. Market Trend Identification
Scraping data from marketplaces and social commerce platforms helps identify trending products, search terms, and buyer behaviors.
How It Works
Scraped data from platforms like Amazon, eBay, or Etsy is analyzed for keyword frequency, popularity scores, and rising product categories. Trends can also be extracted from user-generated content and influencer reviews, giving your brand insights before a product goes mainstream.
Benefits
Stay ahead of consumer demand
Launch timely product lines
Align campaigns with seasonal or viral trends
Prevent dead inventory
Invest confidently in new product development
7. Lead Generation and Business Intelligence
Gather contact details, seller profiles, or niche market data from directories and B2B marketplaces to fuel outreach campaigns and business development.
How It Works
Scrapers extract publicly available email IDs, company names, product listings, and seller ratings. The data is filtered based on industry and size. Lead qualification becomes faster when you pre-analyze industry relevance, product categories, or market presence through scraped metadata.
Benefits
Expand B2B networks
Targeted marketing efforts
Increase qualified leads and partnerships
Boost outreach accuracy
Customize proposals based on scraped insights
How Does Internet Scraping Work in E-commerce?
Target Identification: Identify the websites and data types you want to scrape, such as pricing, product details, or reviews.
Bot Development: Create or configure a scraper bot using tools like Python, BeautifulSoup, or Scrapy, or use advanced scraping platforms like TagX.
Data Extraction: Bots navigate web pages, extract required data fields, and store them in structured formats (CSV, JSON, etc.).
Data Cleaning: Filter, de-duplicate, and normalize scraped data for analysis.
Data Analysis: Feed clean data into dashboards, CRMs, or analytics platforms for decision-making.
Automation and Scheduling: Set scraping frequency based on how dynamic the target sites are.
Integration: Sync data with internal tools like ERP, inventory systems, or marketing automation platforms.
Key Benefits of Internet Scraping for E-commerce
Scalable Insights: Access large volumes of data from multiple sources in real time
Improved Decision Making: Real-time data fuels smarter, faster decisions
Cost Efficiency: Reduces the need for manual research and data entry
Strategic Advantage: Gives brands an edge over slower-moving competitors
Enhanced Customer Experience: Drives better content, service, and personalization
Automation: Reduces human effort and speeds up analysis
Personalization: Tailor offers and messaging based on real-world competitor and customer data
Why Businesses Trust TagX for Internet Scraping
TagX offers enterprise-grade, customizable internet scraping solutions specifically designed for e-commerce businesses. With compliance-first approaches and powerful automation, TagX transforms raw online data into refined insights. Whether you're monitoring competitors, optimizing product pages, or discovering market trends, TagX helps you stay agile and informed.
Their team of data engineers and domain experts ensures that each scraping task is accurate, efficient, and aligned with your business goals. Plus, their built-in analytics dashboards reduce the time from data collection to actionable decision-making.
Final Thoughts
E-commerce success today is tied directly to how well you understand and react to market data. With internet scraping, brands can unlock insights that drive pricing, inventory, customer satisfaction, and competitive advantage. Whether you're a startup or a scaled enterprise, the smart use of scraping technology can set you apart.
Ready to outsmart the competition? Partner with TagX to start scraping smarter.
0 notes
Text
Data Science Trending in 2025
What is Data Science?
Data Science is an interdisciplinary field that combines scientific methods, processes, algorithms, and systems to extract knowledge and insights from structured and unstructured data. It is a blend of various tools, algorithms, and machine learning principles with the goal to discover hidden patterns from raw data.
Introduction to Data Science
In the digital era, data is being generated at an unprecedented scale—from social media interactions and financial transactions to IoT sensors and scientific research. This massive amount of data is often referred to as "Big Data." Making sense of this data requires specialized techniques and expertise, which is where Data Science comes into play.
Data Science enables organizations and researchers to transform raw data into meaningful information that can help make informed decisions, predict trends, and solve complex problems.
History and Evolution
The term "Data Science" was first coined in the 1960s, but the field has evolved significantly over the past few decades, particularly with the rise of big data and advancements in computing power.
Early days: Initially, data analysis was limited to simple statistical methods.
Growth of databases: With the emergence of databases, data management and retrieval improved.
Rise of machine learning: The integration of algorithms that can learn from data added a predictive dimension.
Big Data Era: Modern data science deals with massive volumes, velocity, and variety of data, leveraging distributed computing frameworks like Hadoop and Spark.
Components of Data Science
1. Data Collection and Storage
Data can come from multiple sources:
Databases (SQL, NoSQL)
APIs
Web scraping
Sensors and IoT devices
Social media platforms
The collected data is often stored in data warehouses or data lakes.
2. Data Cleaning and Preparation
Raw data is often messy—containing missing values, inconsistencies, and errors. Data cleaning involves:
Handling missing or corrupted data
Removing duplicates
Normalizing and transforming data into usable formats
3. Exploratory Data Analysis (EDA)
Before modeling, data scientists explore data visually and statistically to understand its main characteristics. Techniques include:
Summary statistics (mean, median, mode)
Data visualization (histograms, scatter plots)
Correlation analysis
4. Data Modeling and Machine Learning
Data scientists apply statistical models and machine learning algorithms to:
Identify patterns
Make predictions
Classify data into categories
Common models include regression, decision trees, clustering, and neural networks.
5. Interpretation and Communication
The results need to be interpreted and communicated clearly to stakeholders. Visualization tools like Tableau, Power BI, or matplotlib in Python help convey insights effectively.
Techniques and Tools in Data Science
Statistical Analysis
Foundational for understanding data properties and relationships.
Machine Learning
Supervised and unsupervised learning for predictions and pattern recognition.
Deep Learning
Advanced neural networks for complex tasks like image and speech recognition.
Natural Language Processing (NLP)
Techniques to analyze and generate human language.
Big Data Technologies
Hadoop, Spark, Kafka for handling massive datasets.
Programming Languages
Python: The most popular language due to its libraries like pandas, NumPy, scikit-learn.
R: Preferred for statistical analysis.
SQL: For database querying.
Applications of Data Science
Data Science is used across industries:
Healthcare: Predicting disease outbreaks, personalized medicine, medical image analysis.
Finance: Fraud detection, credit scoring, algorithmic trading.
Marketing: Customer segmentation, recommendation systems, sentiment analysis.
Manufacturing: Predictive maintenance, supply chain optimization.
Transportation: Route optimization, autonomous vehicles.
Entertainment: Content recommendation on platforms like Netflix and Spotify.
Challenges in Data Science
Data Quality: Poor data can lead to inaccurate results.
Data Privacy and Ethics: Ensuring responsible use of data and compliance with regulations.
Skill Gap: Requires multidisciplinary knowledge in statistics, programming, and domain expertise.
Scalability: Handling and processing vast amounts of data efficiently.
Future of Data Science
The future promises further integration of artificial intelligence and automation in data science workflows. Explainable AI, augmented analytics, and real-time data processing are areas of rapid growth.
As data continues to grow exponentially, the importance of data science in guiding strategic decisions and innovation across sectors will only increase.
Conclusion
Data Science is a transformative field that unlocks the power of data to solve real-world problems. Through a combination of techniques from statistics, computer science, and domain knowledge, data scientists help organizations make smarter decisions, innovate, and gain a competitive edge.
Whether you are a student, professional, or business leader, understanding data science and its potential can open doors to exciting opportunities and advancements in technology and society.
0 notes
Text
Beyond the Books: Real-World Coding Projects for Aspiring Developers
One of the best colleges in Jaipur, which is Arya College of Engineering & I.T. They transitioning from theoretical learning to hands-on coding is a crucial step in a computer science education. Real-world projects bridge this gap, enabling students to apply classroom concepts, build portfolios, and develop industry-ready skills. Here are impactful project ideas across various domains that every computer science student should consider:
Web Development
Personal Portfolio Website: Design and deploy a website to showcase your skills, projects, and resume. This project teaches HTML, CSS, JavaScript, and optionally frameworks like React or Bootstrap, and helps you understand web hosting and deployment.
E-Commerce Platform: Build a basic online store with product listings, shopping carts, and payment integration. This project introduces backend development, database management, and user authentication.
Mobile App Development
Recipe Finder App: Develop a mobile app that lets users search for recipes based on ingredients they have. This project covers UI/UX design, API integration, and mobile programming languages like Java (Android) or Swift (iOS).
Personal Finance Tracker: Create an app to help users manage expenses, budgets, and savings, integrating features like OCR for receipt scanning.
Data Science and Analytics
Social Media Trends Analysis Tool: Analyze data from platforms like Twitter or Instagram to identify trends and visualize user behavior. This project involves data scraping, natural language processing, and data visualization.
Stock Market Prediction Tool: Use historical stock data and machine learning algorithms to predict future trends, applying regression, classification, and data visualization techniques.
Artificial Intelligence and Machine Learning
Face Detection System: Implement a system that recognizes faces in images or video streams using OpenCV and Python. This project explores computer vision and deep learning.
Spam Filtering: Build a model to classify messages as spam or not using natural language processing and machine learning.
Cybersecurity
Virtual Private Network (VPN): Develop a simple VPN to understand network protocols and encryption. This project enhances your knowledge of cybersecurity fundamentals and system administration.
Intrusion Detection System (IDS): Create a tool to monitor network traffic and detect suspicious activities, requiring network programming and data analysis skills.
Collaborative and Cloud-Based Applications
Real-Time Collaborative Code Editor: Build a web-based editor where multiple users can code together in real time, using technologies like WebSocket, React, Node.js, and MongoDB. This project demonstrates real-time synchronization and operational transformation.
IoT and Automation
Smart Home Automation System: Design a system to control home devices (lights, thermostats, cameras) remotely, integrating hardware, software, and cloud services.
Attendance System with Facial Recognition: Automate attendance tracking using facial recognition and deploy it with hardware like Raspberry Pi.
Other Noteworthy Projects
Chatbots: Develop conversational agents for customer support or entertainment, leveraging natural language processing and AI.
Weather Forecasting App: Create a user-friendly app displaying real-time weather data and forecasts, using APIs and data visualization.
Game Development: Build a simple 2D or 3D game using Unity or Unreal Engine to combine programming with creativity.
Tips for Maximizing Project Impact
Align With Interests: Choose projects that resonate with your career goals or personal passions for sustained motivation.
Emphasize Teamwork: Collaborate with peers to enhance communication and project management skills.
Focus on Real-World Problems: Address genuine challenges to make your projects more relevant and impressive to employers.
Document and Present: Maintain clear documentation and present your work effectively to demonstrate professionalism and technical depth.
Conclusion
Engaging in real-world projects is the cornerstone of a robust computer science education. These experiences not only reinforce theoretical knowledge but also cultivate practical abilities, creativity, and confidence, preparing students for the demands of the tech industry.
0 notes
Text
Python App Development by NextGen2AI: Building Intelligent, Scalable Solutions with AI Integration
In a world where digital transformation is accelerating rapidly, businesses need applications that are not only robust and scalable but also intelligent. At NextGen2AI, we harness the power of Python and Artificial Intelligence to create next-generation applications that solve real-world problems, automate processes, and drive innovation.
Why Python for Modern App Development?
Python has emerged as a go-to language for AI, data science, automation, and web development due to its simplicity, flexibility, and an extensive library ecosystem.
Advantages of Python:
Clean, readable syntax for rapid development
Large community and support
Seamless integration with AI/ML frameworks like TensorFlow, PyTorch, Scikit-learn
Ideal for backend development, automation, and data handling
Our Approach: Merging Python Development with AI Intelligence
At NextGen2AI, we specialize in creating custom Python applications infused with AI capabilities tailored to each client's unique requirements. Whether it's building a data-driven dashboard or an automated chatbot, we deliver apps that learn, adapt, and perform.
Key Features of Our Python App Development Services
AI & Machine Learning Integration
We embed predictive models, classification engines, and intelligent decision-making into your applications.
Scalable Architecture
Our solutions are built to grow with your business using frameworks like Flask, Django, and FastAPI.
Data-Driven Applications
We build tools that process, visualize, and analyze large datasets for smarter business decisions.
Automation & Task Management
From scraping web data to automating workflows, we use Python to improve operational efficiency.
Cross-Platform Compatibility
Our Python apps are designed to function seamlessly across web, mobile, and desktop environments.
Use Cases We Specialize In
AI-Powered Analytics Dashboards
Chatbots & NLP Solutions
Image Recognition Systems
Business Process Automation
Custom API Development
IoT and Sensor Data Processing
Tools & Technologies We Use
Python 3.x
Flask, Django, FastAPI
TensorFlow, PyTorch, OpenCV
Pandas, NumPy, Matplotlib
Celery, Redis, PostgreSQL, MongoDB
REST & GraphQL APIs
Why Choose NextGen2AI?
AI-First Development Mindset End-to-End Project Delivery Agile Methodology & Transparent Process Focus on Security, Scalability, and UX
We don’t just build Python apps—we build intelligent solutions that evolve with your business.
Ready to Build Your Intelligent Python Application?
Let NextGen2AI bring your idea to life with custom-built, AI-enhanced Python applications designed for today’s challenges and tomorrow’s scale.
🔗 Explore our services: https://nextgen2ai.com
#PythonDevelopment#nextgen2ai#aiapps#PythonWithAI#MachineLearning#businessautomation#DataScience#AppDevelopment#CustomSoftware
0 notes
Text
How ESG Benchmarking Helps You Invest Better

Every investor needs a yardstick. Today, that measure increasingly revolves around ESG benchmarking—comparing an asset’s sustainability profile against peers, sectors, or global frameworks such as the Paris Agreement. It isn’t just feel-good PR: in recent surveys, 85% of investors said portfolios built with ESG benchmarks delivered stronger returns, greater resilience, and sharper fundamental insights. No wonder global ESG assets topped USD 30 trillion in 2022 and may clear USD 40 trillion by 2030.
Why ESG Benchmarks Matter More Than Ever
As capital races toward sustainable strategies, regular check-ins become vital. Investors now benchmark:
• Individual securities (bonds, equities)
• Company-level positions
• Sectors—from energy to healthcare
• Entire portfolios
• Regions or countries
This multi-layered view helps confirm whether holdings truly align with climate targets and social standards.
Why More Data Doesn’t Always Mean Better Insight
Data availability isn’t the problem: by 2022, 98% of S&P 500 firms published ESG disclosures, and 70% sought third-party assurance. Advanced databases let analysts slice, dice, and rank companies as leaders, laggards, or somewhere in between.
Yet quantity doesn’t always equal quality. Inconsistent metrics, patchy validation, and outright “greenwashing” create background noise—muddying apples-to-apples comparisons and limiting the effectiveness of comprehensive ESG benchmarking strategies.
Building Reliability into the Process
That’s why investors are pairing traditional reports with alternative data—externally sourced information that adds color and context. Think credit card transactions, satellite imagery, social media sentiment, weather feeds, geo-location trends, or web-scraped traffic.
Blending these signals with classic financials strengthens risk management, exposes fast-moving reputation issues, and enriches benchmarking ESG performance over time.
From Raw Signals to Actionable Insights
Imagine an analytics platform that fuses filings, regulatory disclosures, and sustainability reports with those alternative data streams. Machine-learning models can flag anomalies, score ESG risk in real time, and trace scores through months or years.
Dashboards show how a company stacks up against sector medians or regional leaders, highlighting genuine progress while filtering out marketing spin.
The ESG Intelligence Dashboard is built on exactly this hybrid approach. Users can filter across geographies, track company-level ESG risks and opportunities, and visualize performance shifts instantly. By spotlighting both strengths and vulnerabilities, the tool empowers investors to refine portfolios, avoid greenwashing traps, and capture alpha from emerging sustainability trends.
In summary, ESG benchmarking tools are essential for effective portfolio evaluation and sustainability analysis. Integrating fundamental and alternative data enables deeper insights, accurate peer comparisons, and informed decisions. With AI-driven strategies and real-time tracking, investors can enhance returns while aligning portfolios with long-term environmental and social goals. Ready to elevate your sustainable investing? Start benchmarking today.
0 notes
Text

Web Scraping 101: How Machines Read the Web
Ever wondered how data from your favorite websites gets pulled into apps, research tools, or dashboards? 🤖 This infographic breaks it down step-by-step — from crawling pages to parsing HTML and storing structured data.
Whether you're a beginner curious about automation or a developer diving into data collection, this visual guide will make the process crystal clear! 💡
From bots to parsing logic, it's all here. Ready to see how the web talks to machines?
👉 Check it out now and boost your data game!
#WebScraping#DataScience#Automation#Infographic#CodingLife#WebDevelopment#MachineLearning#BeautifulSoup#Scrapy#PythonDeveloper
0 notes
Text
AI & Machine Learning | Quick Commerce Data Scraping Role
Introduction
The rise of Quick Commerce (Q-Commerce) has transformed the way businesses manage inventory, pricing, and customer demands. With ultra-fast delivery expectations from platforms like Blinkit, Instacart, Getir, Swiggy Instamart, and Gorillas, businesses need real-time, data-driven insights to stay ahead. AI (Artificial Intelligence) and ML (Machine Learning) are revolutionizing data scraping for quick commerce by automating processes, enhancing accuracy, and providing predictive insights.
Retail Scrape, a leader in AI-driven web and mobile app scraping, enables businesses to extract valuable data to optimize pricing, monitor stock availability, and analyze market trends. This blog explores how AI & ML are reshaping Quick Commerce Data Scraping to drive smarter business decisions.
Why AI & ML are Crucial for Quick Commerce Scraping
Automating Data Extraction
Handling CAPTCHA & Anti-Bot Protections
Predicting Pricing & Demand Trends
Processing Large-Scale Data Efficiently
Ensuring High Data Accuracy
How AI & ML Enhance Quick Commerce Data Scraping
1. AI-Driven Dynamic Pricing Scraping
2. Machine Learning for Inventory Tracking
3. AI-Powered Competitor Analysis
4. ML-Driven Sentiment Analysis for Customer Insights
Challenges in AI-Powered Quick Commerce Scraping & Solutions
AI-powered solutions help overcome key web scraping challenges. When websites change structure often, machine learning scrapers adapt automatically. For tough anti-scraping tools like CAPTCHAs and bot detection, AI uses rotating proxies and human-like interactions. Real-time pricing and stock changes are tracked using scheduled scrapers.
Geo-blocked deals and personalized offers are accessed with geo-targeted proxies and behavior replication. Large data volumes and API limits are handled with request throttling and cloud-based AI scraping. AI also cleans messy data using NLP to turn raw HTML into insights. Finally, data from web, mobile, and APIs is unified using AI tools that merge different formats like JSON and CSV.
Industries Benefiting from AI & ML in Quick Commerce Scraping
1. eCommerce & Retail
2. FMCG & Grocery Brands
3. Market Research & Analytics Firms
4. Logistics & Supply Chain Companies
How Retail Scrape Leverages AI & ML for Data Scraping
Retail Scrape provides AI-driven Quick Commerce Data Scraping Solutions to help businesses harness actionable insights. Our offerings include:
1. Automated Web & Mobile App Scraping for Quick Commerce Data.
2. Competitor Price & Inventory Tracking with AI-Powered Analysis.
3. Real-Time Data Extraction & API Integration.
4. Custom Dashboards for Data Visualization & Predictive Insights.
Conclusion
AI and ML are transforming Quick Commerce Data Scraping by enabling businesses to make smarter, data-driven decisions. With the rapid evolution of Blinkit, Getir, Instacart, and Swiggy Instamart, leveraging AI-powered scraping ensures businesses stay ahead of competitors.
With Retail Scrape’s AI-driven solutions, companies can efficiently extract, analyze, and utilize real-time pricing, inventory, and market insights for growth and profitability.
Looking to integrate AI-powered Quick Commerce Scraping? Contact Retail Scrape today for cutting-edge data extraction solutions!
Read more >>https://www.retailscrape.com/ai-machine-learning-quick-commerce-data-scraping.php
officially published by https://www.retailscrape.com/.
#QuickCommerceDataScrapingSolutions#AutomatingDataExtraction#DynamicPricingScraping#ScrapeWithAIAndML#MobileAppScraping#QuickCommerceData#RevolutionizingDataScraping#RealTimeDataExtraction#BlinkitDataExtraction#InstacartDataExtraction#SwiggyInstamartDataExtraction
0 notes
Text
"Bear with Ours" Infodump (article 16^12-thread 0x33/?)


(the other Shoshona, the human design one, being a commission I bought some week or so back)
As for some more clues for the 16^12 setting while I update my overall 16^12 reference Markdown document...
Here we go! Right below (kinda boilerplate-y though so my bad for it):
Delivering grand services to sapient-kinds so long overdue (aside from the psionic upgrade):
Write FemLisp Manifesto, LISP for neurodivergent coders (visual & hot-swap responsive REPLs), make animation / artsy software, LISP Salon, collaborate on OpenBSD GUIs
Poison AI datasets creatively, "How AI sucks so much?" zine, develop anti-AI plugin / addons, Queer health information / neurodivergence social scripts.
Worker co-op, document how to co-op techware, boycott proprietary technologies, launch Pflaumen Cooperative prototypes.
"Angora" Sourcebook, Angora Design Artbook, Ascendancy Driven Punk, Cozy Addventure.
Avoid Burnout, avoid Isolation, avoid ethical compromises.
Build up my own tech co-op, learn Common Lisp, sabotage generative AI, teach feminist programming
----
Demolish systemic Wilsonism before it takes us down.
Emergence of the Lisp Matriarchy
Syndicalism call for the communal causes
Androids, Tieflings, Aasimar... and the entire sapience Ocean of Clades.
Harmonious World Doctrine, in cooperation with natives everywhere.
GLOSS Triumvirate
Cooperative Techware
OpenPOWER Consortium
Post-Scarcity
Fem Techware
Opposing Cyberpunk Dystopia Pessimism
Androids as Citizens
UBI, solidarity, oversight boards, nationalize automation instead of private patents.
----
Ocean of Clades as intended, No enshittification.
Replace proprietary software with GLOSS
Build Worker-Owned Tech Cooperatives
End the AI apocalypse before it starts
Tutor, teach and train women over power tools
Lobby Right for Repair, Trust-Busting, Tax Proprietary Software.
Federated learning, fund public research, stop austerity.
Artist labor strikes, block web scraping, flood training data with noise.
Mandate AI nutrition labels, ban unregulated AI like asbestos, ban predicive policing / deepfakes / facial recognition.
Peer collaboration and mentorships, fund scholarships from women in symbolic AI research, compilers and GLOSS
Highlight pioneers, archive feminist tech collectives, LISP salons.
Replace crunch with sustainable pacing, value maintenance over disruption, unionize all programmers.
----
Makerspace, repairable modular "MOSAIC" tech...
Implement Work Automation International Program
Normalize Android Labor
Transparency, Open Source, Lucid, Libre, Free, Gratis, Responsible, Mature, Maintainable, Mindful, Collaborative, Distributive...
----

0 notes