#Waterfall chart in Excel
Explore tagged Tumblr posts
Visit Tumblr Blog
Explore Tumblr blogs with no restrictions, modern design and the best experience.
Last Seen Tumblr Blogs


Fun Fact
The Tumblr app for Google Glass was released on May 16, 2013.
Text
A Beginner’s Guide to Stacked Waterfall Charts
Summary: A Stacked Waterfall Chart enhances data visualization by stacking multiple data series, providing a comprehensive view of how components contribute to overall changes. It's ideal for detailed financial, project, and marketing analysis.

Introduction
Data visualization is crucial for simplifying complex data and making it easily understandable. One popular type is the waterfall chart, which shows how sequential positive and negative values impact an overall total.
A Stacked Waterfall Chart extends this concept by displaying multiple series stacked on top of each other, providing a deeper insight into the components contributing to the change. In this guide, we'll explore the essentials of Stacked Waterfall Charts, how to create them, and their key features, helping you to effectively communicate data-driven insights.
What is a Stacked Waterfall Chart?
A stacked waterfall chart is a visual representation that helps in understanding the cumulative effect of sequentially introduced positive or negative values. Unlike a standard waterfall chart, which shows the starting point, increases, decreases, and the ending point, a stacked waterfall chart provides a more detailed breakdown by grouping related data points.
It stacks segments on top of each other within each category, allowing for a comprehensive view of multiple data series. This chart type is particularly useful when analyzing various components contributing to the total effect, offering a clear visual of the impact of each element.
Differences Between a Standard Waterfall Chart and a Stacked Waterfall Chart
The primary difference between a standard waterfall chart and a stacked waterfall chart lies in their data presentation. In a standard waterfall chart, individual data points are represented as columns, with the changes between them indicated by positive or negative bars. This provides a simple view of the net change from one data point to the next.
In contrast, a stacked waterfall chart layers multiple data series within each category, stacking them vertically. This method allows for the visualization of the cumulative impact of different components or categories within each step of the sequence. For instance, in financial analysis, a stacked waterfall chart can show the contribution of different revenue streams or expense categories, highlighting the positive and negative contributions in a single view.
Common Use Cases and Applications
Stacked waterfall charts are versatile tools used across various industries and applications. In financial analysis, they are invaluable for breaking down profit and loss statements, providing insights into the contributions of different revenue streams and expense categories. By stacking different financial elements, analysts can easily identify which components are driving growth or losses.
In project management and tracking, stacked waterfall charts help in visualizing the progress and contributions of different project phases or departments. They can show how individual tasks or groups contribute to the overall project timeline, helping managers identify bottlenecks or areas for improvement.
Another common use case is in marketing analytics, where stacked waterfall charts can demonstrate the effectiveness of various campaigns or channels. By stacking the contributions of different marketing strategies, businesses can evaluate which efforts yield the most significant returns, aiding in strategic decision-making.
Key Features of a Stacked Waterfall Chart

Stacked waterfall charts are powerful tools for visualizing complex data and understanding the underlying factors that drive changes over time. They offer several unique features that enhance data analysis and interpretation.
Visual Breakdown of Categories or Components: Stacked waterfall charts provide a clear, visual representation of how different categories or components contribute to the overall result. By stacking bars, they show the incremental effect of each category, making it easy to see how individual elements interact and impact the total.
Easy Identification of Positive and Negative Contributions: These charts effectively distinguish between positive and negative contributions to the final value. The stacked format allows for immediate visual differentiation, helping analysts quickly grasp how various factors influence the overall outcome.
Enhanced Understanding of Cumulative Effects Over a Series: With stacked bars, the cumulative impact of each series becomes evident. This feature helps in tracking the progression of values, making it easier to understand how changes accumulate over time or through different stages.
Flexibility in Displaying Multiple Data Series: Stacked waterfall charts are versatile, allowing the display of multiple data series within the same chart. This capability provides a comprehensive view of how various series contribute to the overall change, facilitating more nuanced analysis and comparison.
How to Create a Stacked Waterfall Chart?
Creating a stacked waterfall chart involves several key steps, from data preparation to chart customization. This guide will walk you through selecting the right data set, structuring it correctly, and using popular tools like Excel, Tableau, and Power BI to create an effective visual representation.
Additionally, we’ll cover best practices to ensure clarity and accuracy in your chart.
Selecting the Right Data Set
Choosing the appropriate data set is crucial for creating a meaningful stacked waterfall chart. This type of chart is ideal for showing the cumulative effect of sequentially introduced positive or negative values.
It's commonly used in financial analysis to illustrate profit and loss statements, sales data, or budget allocations. The data set should have distinct categories or segments that contribute to a total, with each segment broken down into sub-categories or components.
Structuring Data for the Chart
Proper data structuring is essential for a clear and accurate stacked waterfall chart. Begin by organizing your data into categories (e.g., months, departments, or products) and series (e.g., revenue, costs, profits).
Each series should have data points that represent the contribution of each category. The first column in your data set typically represents the categories, while subsequent columns represent the series. For instance, in a financial analysis, categories might be months, and series could be different types of income and expenses.
Step-by-Step Guide
Creating a stacked waterfall chart can be done using several popular data visualization tools. Here’s a basic guide for three commonly used tools:
1. Excel:
Step 1: Prepare your data in a table format, with categories in the first column and series in the subsequent columns.
Step 2: Select the data range and go to the 'Insert' tab.
Step 3: Choose 'Waterfall Chart' from the chart options. Excel may not directly support stacked waterfall charts, so you might need to customize a standard waterfall chart.
Step 4: Adjust the colors and labels to differentiate between the series.
Further Read:
Stacked waterfall chart in Excel – Step by Step Tutorial.
Creating Waterfall Chart in Excel: Step-by-Step Tutorial.
2. Tableau:
Step 1: Import your data set into Tableau.
Step 2: Drag the categories to the Columns shelf and the values to the Rows shelf.
Step 3: Use the ‘Measure Names’ and ‘Measure Values’ to stack the series.
Step 4: Customize the chart by adding color, adjusting the axis, and labeling the data points.
3. Power BI:
Step 1: Load your data into Power BI.
Step 2: Add a 'Waterfall Chart' visual to your report.
Step 3: Drag categories to the 'Category' field and series to the 'Y-Axis' field.
Step 4: Customize the visual by modifying the colors, data labels, and legends.
Customizing the Chart
Customizing your stacked waterfall chart is critical for clarity and engagement. Start by assigning different colors to each series to distinguish between them easily. Use a color scheme that is easy on the eyes and provides sufficient contrast.
Adding data labels helps viewers quickly understand the values represented by each segment. Legends are essential for explaining what each color or pattern represents. Make sure to place the legend in a location that doesn't obstruct the data or clutter the chart.
Best Practices
Accuracy is paramount in data visualization. Double-check your data inputs and calculations to ensure they are correct. Avoid overloading the chart with too much information, as this can make it difficult to read. Keep the design simple and clean, using consistent formatting and spacing.
A stacked waterfall chart is an excellent tool for highlighting key changes and trends. Use annotations or callouts to draw attention to significant data points or transitions, such as a sudden increase in sales or a notable reduction in costs. These highlights can help viewers quickly grasp the most critical insights from the data.
Frequently Asked Questions
What is a Stacked Waterfall Chart?
A Stacked Waterfall Chart visualizes cumulative effects of sequential positive or negative values, stacking multiple data series within each category. It provides a detailed breakdown of the components contributing to the overall total.
How do I create a Stacked Waterfall Chart in Excel?
In Excel, prepare your data in a table, select the range, and insert a Waterfall Chart. Customize it by adjusting colors and labels to stack series, as Excel may require manual adjustments for stacked effects.
What are the main applications of a Stacked Waterfall Chart?
Stacked Waterfall Charts are used in financial analysis, project management, and marketing analytics. They break down profit and loss statements, project contributions, and marketing campaign effectiveness, offering a clear view of individual components' impact.
Conclusion
A Stacked Waterfall Chart is a powerful tool for visualizing the cumulative impact of sequential values. By stacking multiple series within each category, it offers a detailed view of how individual components contribute to overall changes.
Use this chart to enhance your data analysis, making it easier to understand complex data sets and identify key insights.
#A Beginner’s Guide to Stacked Waterfall Charts#stacked waterfall chart#excel#power bi#tableau#data visualization
0 notes
Text
Creating Waterfall Charts in Excel: A Step-By-Step Guide
Users may access robust tools through Excel Training to efficiently analyse and display data. A waterfall chart in Excel stands out among the different visualisation choices as a well-liked solution for displaying financial and quantitative data with simple and clear graphics. Whether you’re a student, business analyst, or financial professional, learning to make waterfall charts may improve your…

View On WordPress
1 note
·
View note
Text
Excel Like a Pro: The Ultimate Guide to Microsoft Excel Mastery
If you've ever felt overwhelmed looking at an Excel spreadsheet, you're not alone. Microsoft Excel can look intimidating with all its formulas, charts, tables, and tabs. But here’s the thing — once you master it, Excel becomes one of the most powerful tools you’ll ever use. Whether you're managing personal finances, analyzing data, or building dashboards for work, Excel has you covered.
So, how do you go from being an Excel rookie to someone who uses pivot tables in their sleep?
Simple. By learning from the Microsoft Excel: Ultimate Mastery from Beginner to Pro course — a comprehensive program designed to turn even the most hesitant users into Excel power users.
Let’s break down why this course is worth your time and how it can transform your skills from basic to brilliant.
Why Excel Mastery Matters in 2025 (and Beyond)
Excel is not just a tool. It’s practically a language spoken across all industries — from finance and marketing to healthcare and logistics. Here's what makes it essential:
Universal Application: Almost every job requires some level of data entry, reporting, or analysis.
Efficiency & Productivity: Mastering Excel helps you complete tasks faster and more accurately.
Career Advancement: Proficiency in Excel is a highly sought-after skill that can help you stand out.
Smarter Decision Making: With Excel, you can visualize data, forecast trends, and make data-driven decisions.
So, whether you're job hunting, starting a business, or looking to automate repetitive tasks, mastering Excel is a smart move.
What Makes This Excel Course So Effective?
There are tons of Excel tutorials out there, so why choose this one? The Microsoft Excel: Ultimate Mastery from Beginner to Pro course on Korshub is different. Here’s how:
✅ All-in-One Learning Path
Instead of bouncing between YouTube videos and random blog posts, this course gives you a structured, progressive roadmap. It starts with the basics like formatting cells and quickly moves into advanced territory like macros and data analysis.
✅ Hands-On Learning with Real-Life Examples
You won’t just learn how to use VLOOKUP or SUMIF — you’ll use them in real-world scenarios that simulate actual workplace tasks. That means what you learn is immediately applicable.
✅ Latest Excel 2021 Features Covered
With tools and techniques updated for Microsoft Excel 2021, this course ensures you're learning the most relevant and up-to-date content. Features like dynamic arrays, XLOOKUP, and improved charting functionalities are all part of the package.
✅ Lifetime Access with Future Updates
Once enrolled, you’ll have lifetime access to the course. Whenever there’s a new Excel update, you’ll be the first to know and learn how to use it.
What You’ll Learn — A Peek into the Curriculum
Here’s a quick overview of the skills you'll gain from beginner to pro level:
🟢 Beginner Essentials
Navigating Excel’s interface
Formatting cells and worksheets
Basic formulas and functions (SUM, AVERAGE, COUNT)
Sorting and filtering data
Creating and formatting simple charts
🔵 Intermediate Proficiency
Conditional formatting
Data validation
Pivot tables and Pivot charts
Logical functions like IF, AND, OR
Lookup functions (VLOOKUP, HLOOKUP, XLOOKUP)
🟣 Advanced Excel Techniques
Data visualization dashboards
Advanced charts (combo, waterfall, histogram)
What-If analysis (Goal Seek, Scenario Manager)
Named ranges and data tables
Working with large datasets
🔴 Excel Power Tools
Power Query & Power Pivot
Macros and VBA basics
Automating reports
Connecting Excel to other data sources
Advanced data modeling and forecasting
Real-World Applications: How Excel Helps You Every Day
You might be wondering, "Will I really use all this?" The short answer: YES.
Here’s how Excel shows up in real life:
For Students: Organize study schedules, calculate GPA, track expenses.
For Freelancers: Invoice clients, calculate earnings, manage projects.
For Office Workers: Analyze sales data, create performance dashboards, generate automated reports.
For Small Business Owners: Track inventory, monitor cash flow, create financial projections.
And the best part? Once you’ve taken the Microsoft Excel: Ultimate Mastery from Beginner to Pro course, you’ll be doing all this with ease and speed.
Who Is This Course For?
This course is designed for everyone — regardless of your background or experience. Here's who will benefit most:
Absolute Beginners: No prior Excel knowledge needed.
Intermediate Users: Fill in knowledge gaps and explore new features.
Business Professionals: Improve productivity and data analysis.
Job Seekers: Boost your resume with a high-demand skill.
Entrepreneurs: Manage and grow your business more efficiently.
Key Features That Set This Course Apart
🌟 20+ Hours of Engaging Video Content
Packed with digestible lessons that keep you motivated.
🌟 Downloadable Resources & Workbooks
Practice what you learn with ready-to-use files.
🌟 Quizzes & Real-World Projects
Put your skills to the test with interactive assignments.
🌟 Certificate of Completion
Showcase your achievement and add it to your LinkedIn profile.
What Students Are Saying
"I thought Excel was only for accountants. After taking this course, I use it for everything — budgeting, planning, even my side hustle. Totally worth it!" — Priya M., Freelancer
"I landed a job partly because of the Excel dashboard I built as part of this course. Hiring managers were impressed!" — Jason T., Data Analyst
"This course is like having a mentor walk you through Excel step-by-step. I finally understand formulas, charts, and even macros!" — Alisha R., College Student
How to Get Started
Ready to transform how you work with data?
It only takes a few minutes to enroll in the Microsoft Excel: Ultimate Mastery from Beginner to Pro course. From there, you can start learning at your own pace — pause, rewind, practice — and gradually build mastery.
Excel Tips to Keep in Your Back Pocket
To give you a head start, here are a few tips that’ll instantly improve your Excel game:
CTRL + Arrow Keys: Jump quickly across large datasets.
Use Named Ranges: They make formulas easier to read and manage.
Combine Functions: Nest IF, AND, OR for powerful logical analysis.
Flash Fill: Excel predicts and completes repetitive entries for you.
Use Tables for Dynamic Ranges: Automatically updates data references when new rows are added.
Of course, all these tricks (and hundreds more) are covered inside the course!
Final Thoughts: Excel Isn’t Optional Anymore
Whether you're building your career, managing your own business, or simply trying to stay organized, Excel is one skill that pays for itself many times over. And you don’t need to spend months trying to figure it all out.
With the Microsoft Excel: Ultimate Mastery from Beginner to Pro course, you’ll go from confused to confident — unlocking the full power of spreadsheets, dashboards, and data automation.
0 notes
Text
The Evolving Landscape of Project Management Software: 2025 and Beyond
Project management has always been about bringing order to chaos, transforming ideas into reality, and ensuring goals are met on time and within budget. But the tools facilitating this crucial discipline are evolving at an unprecedented pace. As we navigate 2025, project management software is no longer just a digital whiteboard; it's an intelligent, interconnected ecosystem empowering teams to achieve more with greater efficiency and foresight.
Gone are the days of clunky, siloed systems. Today's leading project management software is characterized by a suite of powerful capabilities designed to address the complexities of modern work, especially the widespread adoption of remote and hybrid models.

The Pillars of Modern Project Management Software:
At its core, contemporary project management software excels in several key areas:
Enhanced Collaboration and Communication: With teams often dispersed across different locations and time zones, robust communication features are paramount. Real-time chat, video conferencing integrations, centralized document sharing with version control, and in-context commenting are no longer luxuries but necessities. Tools like Click Up, Asana, and Monday.com are designed to break down communication silos and foster seamless teamwork.
Intelligent Task and Workflow Management: Beyond simple task lists, modern software offers dynamic task tracking, dependencies, and customizable workflows. Features like Gantt charts provide visual timelines and highlight critical paths, while Kanban boards offer agile teams a flexible way to visualize progress. Automation is key here, reducing manual effort for repetitive tasks like assigning work, scheduling deadlines, and sending reminders.
AI and Automation Taking Center Stage: This is perhaps the most significant trend shaping project management software. AI is not just a buzzword; it's becoming an invaluable partner. AI-powered tools are now capable of:
Predictive Analytics: Forecasting potential roadblocks, delays, and budget overruns by analyzing historical data and patterns.
Intelligent Resource Allocation: Optimizing resource utilization by assessing team member skills, availability, and workload, ensuring efficient deployment.
Automated Task Management: Streamlining routine tasks, from generating reports and summaries to tracking progress and sending notifications.
Risk Management: Proactively identifying and flagging potential risks, offering insights and suggesting corrective actions before they escalate.
Generative AI: Assisting with project planning, creating initial project summaries, and even refining communication.
Data-Driven Decision Making: Project managers are increasingly leveraging data analytics to gain deeper insights into project performance. Comprehensive dashboards provide real-time visibility into KPIs, budget variances, and resource utilization. This data empowers informed decision-making, allowing teams to adapt quickly to changing conditions and optimize outcomes.
Flexibility for Hybrid Methodologies: The traditional "Waterfall vs. Agile" debate is increasingly giving way to hybrid approaches. Project management software now caters to this shift, allowing teams to blend structured planning with agile sprints. Tools like Zoho Projects seamlessly integrate features for both, enabling organizations to choose the best approach for different project phases or types.

Beyond the Features: The Impact
The benefits of adopting advanced project management software extend far beyond mere task organization:
Increased Efficiency and Productivity: By automating repetitive tasks and providing clear visibility, teams can focus on strategic work, leading to faster project completion and higher output.
Improved Transparency and Accountability: Clear task ownership, progress tracking, and centralized information foster accountability and reduce the need for constant follow-ups.
Better Resource Management: Real-time insights into team workloads and capacity prevent burnout and optimize the allocation of talent.
Proactive Risk Mitigation: AI-driven insights help identify and address potential issues before they become critical, safeguarding project success.
Enhanced Client and Stakeholder Communication: Shared timelines, progress reports, and collaborative workspaces improve transparency and foster stronger relationships.
The Road Ahead
As we look towards the rest of 2025 and beyond, project management software will continue to evolve, becoming even more intuitive, predictive, and integrated. Expect further advancements in generative AI, deeper integrations with other business applications, and an increased focus on user experience to make these powerful tools accessible to every team member, regardless of their technical expertise. The future of project management is intelligent, collaborative, and, most importantly, geared towards continuous success.
#project management software#task management software#employee management software#client management software#hrms
0 notes
Text
Project Management Assignment Help – Complete Guide for Students
Introduction
Are you struggling with tight deadlines or complex academic projects? You're not alone. Many students find it hard to manage time and complete assignments effectively. At Gritty Tech Academy, we offer expert-level Project Management Assignment Help to guide you through your academic journey For More…
Our services are designed to help students submit high-quality assignments on time while learning essential project management principles. Whether you’re facing difficulties in planning, execution, risk analysis, or using tools like Gantt charts or Agile methodology, our tutors can assist you from start to finish.
With a proven record of helping students across various universities, we ensure your assignments are completed quickly, accurately, and without plagiarism. Connect with our experts now to make your academic life easier and more productive.
About Gritty Tech Academy
Gritty Tech Academy has been providing educational assistance for over a decade. Specializing in management, engineering, and technology courses, the academy has earned a reputation for excellence. Our goal is to provide students with the academic support they need to succeed.
We focus on offering personalized solutions. Our team of certified tutors is committed to delivering top-quality assignment help in various subjects, including project management. Every assignment is carefully handled to meet academic standards and ensure originality. Gritty Tech Academy is not just a service provider — we’re your academic growth partner.
Why Choose Our Project Management Assignment Help
1. Expert Tutors with Industry Knowledge
All our tutors are highly qualified with practical experience in project management. They are familiar with industry standards like PMI, Agile, Waterfall, and PRINCE2.
2. Plagiarism-Free Content
Every assignment is written from scratch. We use licensed plagiarism detection software to ensure 100% originality in every delivery.
3. Fast Turnaround
Need a project done within 24 hours? No problem. We specialize in delivering quality work even under tight deadlines.
4. Affordable Pricing
We understand student budgets. Our pricing is transparent and designed to be pocket-friendly without compromising quality.
5. 24/7 Support
Have a question at midnight? Our support team is available 24/7 to assist you with any queries or updates related to your project.
How Our Project Management Assignment Help Works
Submit Your Assignment Requirements Upload your assignment brief and mention the deadline.
Get Matched with an Expert Tutor We assign a subject-matter expert based on your topic.
Track Progress in Real-Time Stay updated through our portal or chat with your assigned tutor.
Receive Completed Assignment Download your assignment before the deadline, with full originality and academic formatting.
Topics Covered in Project Management Assignments
We offer comprehensive support on topics such as:
Work Breakdown Structure (WBS)
Gantt Charts and PERT Diagrams
Agile Project Management
PRINCE2 Methodology
Risk Management
Project Lifecycle
Project Cost Estimation
Communication Planning
Stakeholder Analysis
Whether it's a case study, a project plan, or a theoretical analysis, we cover all areas under our Project Management Assignment Help.
Testimonials from Students
Amit S., MBA Student – Delhi University: "I had a tight deadline and no clue how to start. Gritty Tech Academy provided incredible support. The quality was top-notch, and I learned a lot!"
Rachel M., Project Management Diploma – Melbourne: "Best decision ever! The tutor was helpful and explained the concepts clearly while completing my assignment perfectly."
James K., Engineering Management – UK: "Not only did I get great grades, but I also gained clarity on project risk analysis. Highly recommend their project management assignment help."
Our Tutors' Experience
Our team includes:
Certified PMP professionals
Former university lecturers
Industry project managers with over 10 years of experience
Academic writers with subject-matter expertise
Agile and Scrum-certified consultants
Their combined knowledge ensures you receive practical insights along with academic accuracy in every assignment.
FAQs – Project Management Assignment Help
Q1: What is Project Management Assignment Help? A: It is a specialized academic support service where expert tutors assist students in completing their project management assignments with high quality and zero plagiarism.
Q2: Who will write my project management assignment? A: Only experienced professionals and certified tutors with relevant qualifications handle your assignments. Our team ensures academic integrity and thorough research.
Q3: Can I learn while getting assignment help? A: Absolutely. Our tutors provide explanations and step-by-step breakdowns to help you understand the topic as you complete your assignment.
Q4: How do I ensure my assignment is plagiarism-free? A: Every task is created from scratch. We also provide a plagiarism report on request to assure you of originality.
Q5: Why should I choose Gritty Tech Academy for project management assignment help? A: We offer fast, reliable, and affordable services from qualified experts, backed by years of experience and 24/7 support.
Conclusion
In today's academic environment, managing time and maintaining quality in assignments can be overwhelming. That’s where Gritty Tech Academy’s Project Management Assignment Help becomes your reliable academic partner.
We offer more than just assignment writing — we provide mentorship, clarity, and academic growth. With plagiarism-free content, experienced tutors, and round-the-clock assistance, you can trust us to guide you to academic excellence.
Don’t let deadlines stress you. Reach out to Gritty Tech Academy and experience the best Project Management Assignment Help tailored for your success.
0 notes
Text
Advanced Excel Courses at DICS Innovatives
In today's data-driven world, Excel skills are essential for professionals across various industries. If you're looking to enhance your Excel capabilities, enrolling in an advanced Excel institute in Pitampura can make a significant difference. For residents of Pitampura, one of the best advanced Excel institutes is DICS Innovatives.

Key Features of Advanced Excel
Data Analysis and Reporting
Advanced Excel empowers you to perform in-depth data analysis and generate comprehensive reports. With tools like:
Power Query: Transform and clean your data efficiently.
Power Pivot: Create sophisticated data models and perform complex calculations across multiple tables.
Automation with Macros and VBA
For repetitive tasks, mastering Macros and VBA (Visual Basic for Applications) can save time and reduce errors. You’ll learn how to:
Record and edit Macros to automate routine processes.
Write custom VBA scripts to extend Excel's capabilities, allowing for tailored solutions to specific problems.
Data Visualization Techniques
Understanding how to represent data visually is crucial for effective communication. At DICS Innovatives, you'll learn to:
Create advanced charts, including waterfall, funnel, and radar charts.
Use conditional formatting to highlight key data points and trends, making reports more intuitive.
Scenario Analysis and Forecasting
Excel is a powerful tool for financial modeling and forecasting. You’ll explore:
What-If Analysis: Use tools like Goal Seek and Data Tables to analyze different scenarios.
Forecasting: Learn techniques to predict future trends based on historical data, utilizing Excel’s built-in forecasting tools.
Why Choose DICS Innovatives?
DICS Innovatives stands out as a premier institute for advanced Excel training. Here are some reasons why you should consider their courses:
1. Comprehensive Curriculum
DICS Innovatives offers a well-structured curriculum that covers all aspects of advanced Excel. Key topics include:
Advanced Formulas: Learn to use complex functions such as SUMIFS, COUNTIFS, and array formulas to perform sophisticated calculations.
Pivot Tables and Charts: Master the art of summarizing large datasets quickly and effectively, creating dynamic reports that help in decision-making.
Data Validation: Implement data validation rules to maintain data integrity and ensure accurate data entry.
2. Experienced Instructors
The instructors at DICS Innovatives are industry experts with extensive experience in using Excel for real-world applications. Their practical insights help students understand the nuances of Excel and its applications in various business scenarios.
3. Flexible Learning Options
DICS Innovatives offers flexible learning options, including weekend batches and online classes, making it convenient for working professionals to enhance their skills without disrupting their schedules.
4. Certification
Upon completion of the course, participants receive a certification that adds value to their resumes and demonstrates their proficiency in advanced Excel skills—an asset in today’s job market.
Conclusion
If you're searching for the best advanced Excel institute in Pitampura, look no further than DICS Innovatives. Their comprehensive courses, expert instructors, and practical training methods will equip you with the skills needed to excel in your career. Don’t miss the opportunity to enhance your Excel proficiency and open up new avenues in your professional journey!
0 notes
Text

Why Top 10 Volakas Marble Design Trends You’ll See in 2025
Volakas marble, the epitome of Grecian elegance, has long been admired for its delicate white base and soft grey veining. But in 2025, this classic natural stone is taking center stage in fresh, bold, and futuristic design trends. Whether you're building a luxury villa, redesigning your kitchen, or crafting a five-star hotel lobby, Volakas marble is the material of choice for sophistication with a modern twist.
Let’s dive into the top 10 Volakas marble design trends that are set to dominate interiors in 2025 — brought to you by Shree Ram Stones (SRS), a pioneer in marble innovation and excellence.
1. Volakas Marble in Large Format Slabs
2025 will see the rise of minimal joints and seamless finishes. Large format Volakas marble slabs will be in high demand for walls, floors, and countertops. These expansive pieces elevate the space, reduce grout lines, and offer a continuous flow of natural beauty.
2. Bookmatched Volakas Walls
Artistic and dramatic — bookmatching creates a mirror image with two marble slabs, making a statement in entryways and living rooms. Expect to see this luxurious trend paired with gold accents and soft lighting in 2025.
3. Matte & Honed Finishes
Polished marble has been the go-to for decades, but in 2025, matte and honed finishes will dominate the trend chart. These finishes enhance the natural texture and give Volakas marble a warm, organic feel perfect for contemporary spaces.
4. Volakas Marble Kitchen Islands
Kitchens in 2025 will focus on minimalism with a splash of elegance. Volakas marble islands with waterfall edges are poised to be the focal point, blending functionality and beauty effortlessly.
5. Sculptural Furniture & Decor
From sleek coffee tables to artistic sculptures, Volakas marble will transcend traditional surfaces. Designers are now using it for bespoke decor pieces that add luxury and personality to interiors.
6. Volakas Bathroom Retreats
Spa-inspired bathrooms featuring full-height Volakas marble walls and flooring will be trending. Think walk-in showers, marble basins, and floating vanities — all in this iconic white and grey stone.
7. Backlit Volakas Panels
A show-stopping design trend for 2025 — translucent backlit Volakas marble. Perfect for feature walls and bar counters, this technique brings out the veining and adds a magical glow to spaces.
8. Outdoor Elegance with Volakas Marble
Though usually associated with interiors, Volakas marble is making its way outdoors. Patios, outdoor kitchens, and covered porches in this marble will offer a cohesive look that transitions smoothly from indoors to nature.
9. Volakas Fireplace Surrounds
Fireplaces clad in Volakas marble will be the epitome of cozy luxury. In 2025, this trend will focus on blending traditional warmth with minimalist design, making the fireplace a statement piece.
10. Volakas Marble Accent Walls
Accent walls are making a major comeback — and Volakas is the star of the show. Whether it's behind the bed in a master suite or in a boutique retail store, a marble accent wall adds timeless sophistication.
Why Choose Shree Ram Stones (SRS) for Volakas Marble?
At Shree Ram Stones (SRS), we don’t just supply marble — we curate design journeys. Our team of experts offers top-grade Volakas marble, precision cutting, and tailored design advice to meet every architectural vision.
✅ Premium Volakas marble sourced with integrity
✅ Large inventory and custom slab sizes
✅ On-time global delivery
✅ End-to-end project consultation
✅ Competitive pricing without compromise
Talk to Our Stone Expert Today
Let your dream design begin with us.
📞 Contact Us: +91 92521 01111 📧 Email: [email protected] 🌐 Website: Shree Ram Stones
Bonus: Grab Our Book – The Secrets of Marble Industry
Want to understand the craftsmanship, secrets, and trends that rule the marble world? Don’t miss our exclusive publication — "THE SECRETS OF MARBLE INDUSTRY" — a treasure trove for architects, designers, and homeowners alike.

Final Thoughts
Volakas marble has withstood the test of time — and in 2025, it’s becoming bolder, more versatile, and more desirable than ever. From high-end residential interiors to luxury commercial spaces, the top Volakas marble trends reflect a perfect balance of tradition and innovation.
Choose Shree Ram Stones (SRS) — where quality meets creativity — and bring timeless beauty to your next design.
🔖 Frequently Asked Questions (FAQs)
Q1: Is Volakas marble suitable for high-traffic areas? A1: Yes, with proper sealing and maintenance, Volakas marble is perfect for both residential and commercial spaces.
Q2: Can Volakas marble be used in bathrooms? A2: Absolutely! It’s water-resistant and adds spa-like luxury to any bathroom.
Q3: What finishes are available in Volakas marble at SRS? A3: We offer polished, honed, brushed, leather, and customized finishes.
Q4: How can I ensure long-lasting shine and durability? A4: Regular cleaning with a pH-neutral cleaner and periodic sealing is recommended.
Q5: Does SRS offer international delivery? A5: Yes, we export globally with safe packaging and prompt shipping.
0 notes
Text
Best course in the market currently .
Advance Excel course in Delhi
Advanced Excel refers to a set of more complex and specialized skills that go beyond basic spreadsheet functions. These skills are typically used to analyze large sets of data, automate tasks, and create professional-level reports and dashboards. Here are some key topics and techniques covered in advanced Excel.
Tools like Power Query and Power Pivot help with data transformation and working with large datasets, enabling efficient analysis. Visualizations are enhanced with advanced chart types such as combo and waterfall charts, along with Conditional Formatting to highlight important data trends. Additionally, Macros and VBA (Visual Basic for Applications) allow for automation and custom solutions, saving time on repetitive tasks.
Career in Advance Excel
Improved Efficiency: With advanced Excel skills, you can automate repetitive tasks, analyze large datasets quickly, and create sophisticated reports, making you much more efficient in your work. This is highly valued in data-driven roles.
Better Data Analysis and Decision-Making: Advanced Excel enables you to perform in-depth analysis using tools like Pivot Tables, Power Query, and What-If Analysis. This helps you provide valuable insights that can inform business decisions, making you an asset to any organization.
Increased Job Opportunities: Excel proficiency is required or preferred for many roles in finance, accounting, data analysis, marketing, project management, and other fields. Employers often seek candidates with strong Excel skills for positions like data analyst, financial analyst, business analyst, and operations manager.
Higher Earning Potential: Employees with advanced Excel skills are often compensated with higher salaries due to their ability to streamline workflows, analyze data effectively, and provide actionable insights that improve business performance.
Career Advancement: Mastering advanced Excel can help you take on more complex and strategic roles within an organization. It can also increase your chances of promotion, as you're able to contribute more effectively to business analysis and decision-making processes.
Scope in Advance Excel
The scope of Advanced Excel is expansive, covering a broad range of industries, job functions, and career levels. Its versatility and wide application ensure that mastering it opens numerous opportunities for personal growth and professional development. Whether you're working with financial models, business reports, data analysis, or automating tasks, Advanced Excel is a powerful tool that will remain relevant and in demand for years to come.
Author
Hello I am Tushar from New Delhi . I have done Advance Excel course from DICS . This course is ideal for professionals looking to improve their efficiency, enhance decision-making capabilities, and advance their careers by mastering Excel’s most powerful tools.

0 notes
Text
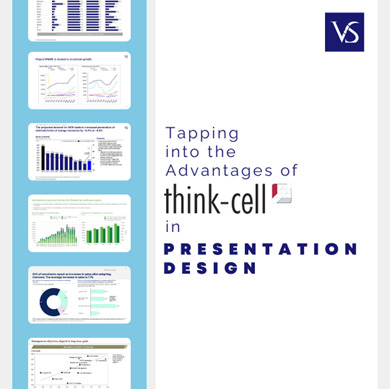
The Essential Features of Think-Cell for Effective Presentations
Think cell charts: Q & A Tutorial
1. What kind of software is think-cell?
think-cell is a software tool primarily used for creating professional presentations and charts, particularly in Microsoft PowerPoint. It streamlines the process of designing complex data visualizations, such as Gantt charts and waterfalls, enhancing productivity for professionals in consulting, finance, and business. think-cell integrates seamlessly with Excel, allowing users to import and update data efficiently.
2. What is think-cell license used for?
A think-cell license is used for the think-cell software, which is primarily designed to enhance productivity in creating presentations in Microsoft PowerPoint and charts in Excel. It simplifies the process of making complex visualizations, automates chart creation, and improves workflow efficiency for professionals, particularly in consulting and finance sectors.
3. What are the benefits of think-cell?
Think-cell enhances PowerPoint by streamlining chart creation, automating slide layouts, and improving data visualization. It saves time with built-in templates and ensures consistency in presentations. Users can easily update charts with new data, and its intuitive interface simplifies complex presentations, making it ideal for professionals in consulting and finance who need to convey data effectively.
4. Does McKinsey use think-cell?
Yes, McKinsey & Company often uses think-cell, a software tool that facilitates the creation of charts and presentations in Microsoft PowerPoint. It helps consultants streamline their work and improve the efficiency of data visualization, which is essential for their client presentations and reports. However, the specific tools used can vary by team and project.
5. How do you use the think-cell connector?
To use the think-cell connector, first open your PowerPoint or Excel file. Then, select the chart or data you want to connect. Use the think-cell add-in to create a chart in PowerPoint, linking it to your Excel data. Make sure to update the data in Excel, and the chart in PowerPoint will automatically refresh.

Visit: VS Website See: VS Portfolio
0 notes
Text
Unlocking Project Success: The Power of Fundamental Management Pillars

Project management is the backbone of business success, ensuring tasks are completed on time, within budget, and to the highest standards. However, successful project execution doesn’t happen by chance—it is built on a strong foundation of fundamental management pillars. These pillars provide the structure, strategy, and direction needed to navigate complexities, mitigate risks, and drive efficiency.
1. Clear Project Objectives and Scope
A well-defined project begins with clarity on objectives, scope, and deliverables. Without a clear roadmap, projects can drift, leading to scope creep, misalignment, and inefficiencies. Defining clear goals ensures that all stakeholders—teams, clients, and leadership—are aligned, fostering better decision-making and resource allocation.
Set SMART (Specific, Measurable, Achievable, Relevant, Time-bound) goals.
Define project milestones and expected outcomes.
Ensure a robust change management plan to handle scope adjustments.
2. Effective Planning and Scheduling
A solid plan is the foundation of a successful project. Without a structured approach, timelines can stretch, and budgets can spiral out of control. Planning involves breaking down tasks, assigning responsibilities, and setting realistic deadlines.
Use Work Breakdown Structures (WBS) to organize tasks into manageable components.
Leverage project scheduling tools like Gantt charts to track progress.
Implement Agile or Waterfall methodologies based on project complexity.
3. Resource Management and Allocation
Optimal utilization of resources—human, financial, and technological—is critical for project efficiency. Poor resource planning can lead to bottlenecks, burnout, or underutilization.
Assign roles based on expertise and workload capacity.
Use resource management tools to forecast demand and availability.
Balance workloads to prevent employee fatigue and maintain productivity.
4. Risk Assessment and Mitigation
Every project faces risks, but proactive risk management minimizes their impact. Identifying potential threats early allows teams to create contingency plans and avoid costly delays.
Conduct a risk assessment at the project initiation phase.
Categorize risks based on severity and likelihood.
Develop mitigation strategies, such as backup plans and alternative suppliers.
5. Seamless Communication and Collaboration
Successful project execution relies on clear, open communication. Ineffective collaboration can lead to misunderstandings, missed deadlines, and decreased productivity.
Use collaboration tools like Slack, Microsoft Teams, or project management platforms.
Hold regular check-ins and status meetings to align stakeholders.
Encourage a culture of transparency to foster trust and accountability.
6. Performance Monitoring and Continuous Improvement
Measuring project performance ensures continuous improvement and efficiency. Tracking progress against KPIs (Key Performance Indicators) helps teams stay on course and adapt as needed.
Monitor progress through dashboards and analytics.
Conduct post-project evaluations to assess strengths and weaknesses.
Encourage feedback from stakeholders to refine future processes.
Conclusion
Project success is not a one-time achievement but a result of disciplined execution across fundamental management pillars. By focusing on well-defined objectives, strategic planning, efficient resource allocation, proactive risk management, effective communication, and continuous improvement, organizations can drive project excellence. Investing in the right methodologies and tools ensures that projects meet business goals while fostering a culture of efficiency and innovation.
0 notes
Text
Waterfall Chart: Breaking Down the Journey of Your Dat
A waterfall chart is like a story that takes you through each part of a journey, one step at a time. Imagine you’re following your savings journey over a few months, with each paycheck, expense, and unexpected cost adding or taking away from your total. The waterfall chart helps you visualize these changes, showing where you started, what’s impacted the balance along the way, and where you end up.
What is a Waterfall Chart?
In simple terms, a waterfall chart is a visual tool that tracks how an initial number changes after going through a series of positive and negative values, ending in a final total. It’s often used in business settings to break down revenue, expenses, or project milestones. The chart’s unique format shows each step in the process, helping you see what added or subtracted from the final value.
Why is it Useful?
Waterfall charts are helpful because they make complex data easy to understand. Rather than showing just a final total, it shows the steps that got you there, allowing anyone to spot trends, issues, or opportunities quickly.
Let’s say you’re running a small business and want to know how monthly revenue stacks up against expenses. A waterfall chart can help you show each month’s income and expenses side-by-side, making it easy to see which months were profitable and which were not. The chart doesn’t just give you a final balance but breaks down the journey, making it clear where your business stands financially.
How to Make a Waterfall Chart
Creating a waterfall chart might sound complex, but most spreadsheet programs like Excel and Google Sheets make it simple. Here’s a basic guide:
Start with Your Data: Organize your data in order, such as your starting value, each positive addition, each negative deduction, and the ending balance.
Insert the Chart: Highlight your data, go to the “Insert” menu, and select “Waterfall Chart.”
Label and Color-Code: Use colors to differentiate between positive and negative values so that gains and losses stand out.
After you’ve made your chart, you can read it like a story, where each bar tells you what happened at each step of the journey.
Real-Life Examples of Waterfall Charts
Let’s dive into some real-world scenarios where a waterfall chart could come in handy:
Personal Savings Goal: Suppose you’re trying to save for a car. You begin with a small savings base, add contributions each month, and subtract for unexpected expenses like repairs or birthdays. The waterfall chart would show each month’s effect on your savings, allowing you to visualize your progress.
Home Budget: Imagine you’re tracking your monthly household budget. You start with your paycheck, add any side income, and then subtract for rent, groceries, bills, and entertainment. The waterfall chart will clearly show what expenses take the most out of your budget, making it easy to spot any spending trends.
Business Profit Analysis: In a business setting, you could use a waterfall chart to track revenue and expenses over a quarter. Starting with initial sales, you would add income from new clients, subtract production costs, rent, and employee salaries, ending with your net profit. This chart gives you an easy view of what’s driving profits or causing losses.
Conclusion
Waterfall charts are a powerful way to visually break down complex data into clear, easy-to-understand steps. Whether you’re tracking personal finances, analyzing business revenue, or managing a project budget, this chart helps you see the journey from start to finish. By showing how each addition and deduction impacts the final result, a waterfall chart tells a story that’s not only insightful but also actionable. So, next time you want to understand where your numbers are coming from, consider a waterfall chart to bring clarity to the journey.
0 notes
Text
Data Analyst Course and Storytelling: Creating Impactful Dashboards and Charts Using Tools Like Tableau and Power BI
In the modern data-driven world, raw data is only as valuable as the insights derived from it. For businesses, conveying these insights in an impactful and comprehensible way is critical for decision-making. This is where the art of storytelling in data analysis comes into play. A dedicated module on data visualisation and storytelling in a Data Analyst Course in Nagpur equips professionals to create impactful dashboards and charts using industry-leading tools like Tableau and Power BI.
The Role of Storytelling in Data Analysis
Storytelling in data analysis involves transforming complex datasets into visually compelling narratives that resonate with stakeholders. It bridges the gap that creeps in between data insights and actionable business strategies. Key components of effective data storytelling include:
Clarity: Simplifying complex information for easy comprehension.
Context: Providing relevant background to make data meaningful.
Engagement: Using visuals to capture and hold attention.
Actionability: Delivering insights that lead to informed decisions.
Why Focus on Dashboards and Charts?
Dashboards and charts serve as the backbone of data storytelling. They provide an interactive and visual medium to:
Monitor key performance indicators (KPIs).
Track trends and patterns over time.
Highlight anomalies and areas requiring attention.
Support data-driven decision-making with clarity and precision.
Key Features of Tableau and Power BI
Tableau:
Renowned for its user-friendly interface and powerful visualisation capabilities.
Allows integration with multiple sources of data for comprehensive analysis.
Offers advanced features like drag-and-drop functionality, real-time data updates, and storytelling dashboards.
Supports interactive visualisations like heatmaps, treemaps, and scatter plots.
Power BI:
A robust Microsoft tool that integrates seamlessly with Office 365 and other Microsoft products.
Provides AI-driven insights and natural language querying.
Offers a wide range of visual templates and customisation options.
Ideal for creating enterprise-grade reports and dashboards.
Course Highlights: Mastering Visualisation Tools
A Data Analyst Course focusing on storytelling and visualisation covers the following key areas:
Data Preparation and Cleaning:
Importing, cleaning, and organising datasets for visualisation.
Handling large and disparate data sources.
Designing Dashboards:
Principles of effective dashboard design: layout, colour theory, and usability.
Building interactive and dynamic dashboards in Tableau and Power BI.
Charting Techniques:
Selecting the right chart type for the data and audience.
Creating advanced visualisations like histograms, box plots, and waterfall charts.
Storytelling Frameworks:
Structuring narratives around visualisations.
Using annotations, highlights, and sequences to guide the audience.
Real-World Projects:
Hands-on experience with industry-relevant datasets.
Creating end-to-end dashboards addressing business scenarios.
Benefits of Mastering Data Storytelling
Professionals trained in data storytelling with tools like Tableau and Power BI can:
Communicate insights effectively and efficiently to both technical and non-technical audiences.
Drive strategic decisions with data-backed narratives.
Enhance their employability in industries prioritising data-driven approaches.
Build visually engaging reports that foster collaboration and understanding.
Conclusion
A Data Analyst Course in Nagpur emphasising storytelling and visualisation is essential for anyone aiming to excel in today’s data-centric roles. By mastering tools like Tableau and Power BI, participants can create dashboards and charts that not only inform but inspire action. This skillset ensures that data analysis evolves from mere number crunching to impactful decision-making support.
0 notes
Text
An Overview of CompTIA Project+ Certification: A Gateway to Project Management Excellence
Project management is an essential skill set for professionals across industries, whether they are working in technology, finance, healthcare, or any other sector. A project’s success often hinges on the skills and coordination of the project manager who is responsible for steering the project from initiation to completion. With the growing demand for competent project managers, acquiring a recognized certification like CompTIA Project+ can significantly boost your career prospects.
CompTIA Project+ is a globally recognized certification that validates foundational project management skills. It is designed for professionals who manage small to medium-sized projects but do not necessarily work full-time as project managers. In this blog, we’ll take a closer look at what the CompTIA Project+ certification entails, its benefits, who should pursue it, and how it compares with other project management certifications like PMP and CAPM.
What is CompTIA Project+?
CompTIA Project+ is an entry-level certification offered by the Computing Technology Industry Association (CompTIA). Unlike other project management certifications that focus solely on one methodology (such as Agile or Waterfall), CompTIA Project+ covers essential project management concepts across a variety of methodologies. This makes it ideal for professionals who may work in dynamic environments where they need to adapt their management style depending on the project requirements.
The certification exam tests your understanding of the entire project lifecycle, including the initiation, planning, execution, monitoring, and closure phases. Additionally, it evaluates your ability to manage project constraints like budget, scope, and timelines, as well as communication, risk management, and conflict resolution skills.
Who Should Pursue CompTIA Project+?
While CompTIA Project+ is designed for entry-level professionals, it is versatile enough to benefit a wide range of individuals, including:
New project managers: If you are just starting your career in project management, this certification provides a comprehensive overview of project management fundamentals.
Project team members: Professionals working in roles where they contribute to project tasks but do not manage projects full-time can use this certification to better understand the broader project management process.
IT professionals: Many IT professionals find themselves leading projects or managing teams without formal project management training. CompTIA Project+ can help bridge that gap.
Business managers: If you are in a business role but frequently interact with project managers or oversee project teams, this certification can help you speak the language of project management and contribute more effectively to project discussions.

Key Domains Covered in the Exam
The CompTIA Project+ certification exam focuses on four key domains:
Project Management Concepts (16% of the exam): This section covers the basic terminology and framework of project management, including various methodologies like Agile, Waterfall, and hybrid approaches.
Project Lifecycle Phases (30% of the exam): You will be tested on your knowledge of the phases of a project lifecycle, from initiation to closure. This includes developing project charters, defining scope, managing project execution, and ensuring proper project closure.
Communication and Change Management (26% of the exam): This section focuses on ensuring that project managers can effectively communicate with stakeholders and manage changes within the project, which are critical skills for any project’s success.
Project Tools and Documentation (28% of the exam): The exam also tests your ability to use common project management tools and documentation techniques such as Gantt charts, work breakdown structures (WBS), and project status reports.
Why Choose CompTIA Project+?
Broad Coverage of Methodologies: Unlike certifications such as PMP, which may emphasize a particular methodology, CompTIA Project+ covers a broad range of project management practices, making it ideal for professionals who need flexibility in their roles.
No Prerequisites: One of the most appealing aspects of the CompTIA Project+ certification is that it does not require any prerequisites, making it accessible for professionals at different stages of their careers. In contrast, certifications like PMP require extensive experience before qualifying for the exam.
Affordability: CompTIA Project+ is also more affordable than many other project management certifications. The exam fee is relatively low compared to more advanced certifications, making it a cost-effective way to boost your credentials.
Quicker Path to Certification: The Project+ certification process is quicker and less intensive compared to other project management certifications like PMP, which require months of study and documented project management experience. CompTIA Project+ allows you to gain certification more rapidly, making it ideal for professionals looking for a quick boost in credentials.
CompTIA Project+ vs. PMP and CAPM
When comparing CompTIA Project+ with other popular project management certifications like PMP (Project Management Professional) and CAPM (Certified Associate in Project Management), there are some notable differences:
PMP: The PMP certification is more advanced and geared toward experienced project managers. It requires a significant amount of project management experience and preparation time, focusing heavily on traditional Waterfall methodologies. PMP is ideal for professionals looking to manage larger, more complex projects.
CAPM: CAPM, like CompTIA Project+, is an entry-level certification, but it is aligned with the Project Management Institute’s (PMI) methodologies and frameworks. CAPM is focused more on theory and less on practical application compared to Project+, making it more suitable for professionals looking to dive deeper into PMI's practices.
Preparing for CompTIA Project+
To prepare for the CompTIA Project+ exam, candidates typically engage in self-study or take formal courses. CompTIA offers a wide range of study materials, including books, online courses, and practice exams. You can also find numerous third-party resources, such as video tutorials, boot camps, and community forums, to supplement your preparation.
Conclusion
The CompTIA Project+ certification offers an accessible and valuable entry point into the world of project management. With its broad coverage of project management concepts and methodologies, it is a versatile certification that can serve professionals in various roles, from IT to business. Whether you are new to project management or looking to formalize your existing knowledge, CompTIA Project+ can provide the credentials needed to advance your career.
0 notes
Link
Check out this listing I just added to my Poshmark closet: MACKAGE Noelia leather Waterfall Jacket sz.
0 notes
Text
Getting Started with Think-cell: A Guide to Elevating Your Excel Presentations
Data Visualization – Charts, Graphs and Infographic designs - ThinkCell: Expert Q&A Insights
1.What are the features of think-cell in Excel?
Think-cell enhances Excel by providing automated chart creation, including Gantt charts and waterfall charts. It offers features like smart layout adjustments, easy data linking, and customizable design options. Users can quickly generate professional presentations with integrated PowerPoint functionality, enabling seamless updates of charts and data. Overall, think-cell streamlines the process of visualizing and presenting data effectively.
2. What is Thinkcell used for?
Thinkcell is a software tool primarily used for creating presentations and visualizing data in Microsoft PowerPoint. It helps users design charts, graphs, and other visual elements quickly and efficiently, streamlining the process of turning complex data into clear and impactful visuals. It's commonly utilized by consultants, analysts, and business professionals for effective communication of insights.
3. What are the advantages of think-cell?
Think-cell offers several advantages, including streamlined creation of professional presentations and charts in PowerPoint, automation of data visualization from Excel, and time-saving templates for slide design. It enhances productivity with features like automatic layout adjustments and easy updates to charts, allowing users to focus on content rather than formatting. This leads to clearer communication of complex data.
4. How to use think-cell in Excel?
To use think-cell in Excel, first install the think-cell add-in. Open Excel, then create or select your data. Access think-cell via the ribbon, where you'll find options for creating charts, such as Gantt charts or waterfall charts. Follow the prompts to insert and customize your chart based on your data. Use the think-cell features to enhance your presentation.
5. What is the think-cell?
Think-Cell is a software tool designed to enhance Microsoft PowerPoint and Excel, primarily for creating professional presentations and charts efficiently. It automates the creation of complex data visualizations, such as Gantt charts and waterfall charts, and streamlines the presentation design process, helping users save time while maintaining high-quality visual standards in their work.
Visit: VS Website See: VS Portfolio
#DataVisualization#PresentationTools#BusinessIntelligence#ChartingSoftware#ProductivityTools#ExcelFeatures
0 notes