#bearishpatterns
Explore tagged Tumblr posts
Visit Tumblr Blog
Explore Tumblr blogs with no restrictions, modern design and the best experience.
Last Seen Tumblr Blogs


Fun Fact
Tumblr Inc. has $15.1M in annual revenue.
Text
Candlestick Patterns and Their Role in Trading
In the world of trading, understanding and predicting market movements is crucial for success. Among the various tools available to traders, candlestick patterns stand out as one of the most powerful and widely used methods for technical analysis. Candlestick patterns not only help traders anticipate market trends but also offer valuable insights into the psychology of market participants. This article delves into what candlestick patterns are, their significance in trading, and how traders can use them to make more informed decisions.

What Are Candlestick Patterns?
Candlestick patterns are a type of chart pattern that originated in Japan in the 18th century. They were first used by Japanese rice traders to track and predict price movements. Over time, these patterns gained popularity in the Western world and have become an essential tool for modern traders.
Each candlestick on a chart represents the price movement for a specific time frame, such as one minute, one hour, or one day. A single candlestick is composed of four key pieces of information:
Open Price – The price at which the trading period started.
Close Price – The price at which the trading period ended.
High Price – The highest price reached during the trading period.
Low Price – The lowest price reached during the trading period.
The body of the candlestick (the rectangular part) shows the range between the open and close prices, while the thin lines above and below (called wicks or shadows) represent the high and low prices.
Bullish vs. Bearish Candlesticks
Bullish Candlestick: Indicates that the closing price is higher than the opening price. It’s often colored green or white and signifies upward price movement.
Bearish Candlestick: Indicates that the closing price is lower than the opening price. It’s often colored red or black and signifies downward price movement.
Understanding how to read individual candlesticks is the foundation for recognizing more complex candlestick patterns.
Why Are Candlestick Patterns Important?
Candlestick patterns provide valuable insights into market sentiment and potential future price movements. Unlike other technical indicators that rely on calculations and formulas, candlestick patterns offer a visual representation of the battle between buyers and sellers.
These patterns can:
Identify market reversals: Some patterns signal that a trend may be about to reverse direction.
Confirm existing trends: Others confirm the continuation of an ongoing trend.
Provide entry and exit points: Candlestick patterns help traders time their trades effectively.
Enhance decision-making: By understanding market psychology, traders can make more informed decisions.
Popular Candlestick Patterns Every Trader Should Know
There are numerous candlestick patterns, but some are more reliable and commonly used than others. These patterns can be broadly classified into two categories: reversal patterns and continuation patterns.
Reversal Patterns
Reversal patterns indicate a potential change in the current trend direction.
Hammer
Description: A single candlestick with a small body and a long lower wick.
Significance: Appears at the bottom of a downtrend, signaling a potential reversal to the upside.
Example: A hammer indicates that sellers pushed the price lower during the session, but buyers regained control before the close.
Shooting Star
Description: A single candlestick with a small body and a long upper wick.
Significance: Appears at the top of an uptrend, indicating a potential reversal to the downside.
Engulfing Pattern
Bullish Engulfing: A larger green candlestick completely engulfs the previous red candlestick, signaling a potential upward reversal.
Bearish Engulfing: A larger red candlestick engulfs the previous green candlestick, signaling a potential downward reversal.
Morning Star and Evening Star
Morning Star: A three-candlestick pattern that signals a bullish reversal. It consists of a bearish candle, a small indecisive candle, and a bullish candle.
Evening Star: The bearish counterpart of the Morning Star, signaling a potential downward reversal.
Continuation Patterns
Continuation patterns indicate that the current trend is likely to continue.
Doji
Description: A candlestick with an almost equal open and close price, resulting in a very small body.
Significance: Reflects market indecision. Depending on its position in the trend, it can either signal a continuation or a potential reversal.
Three White Soldiers
Description: Three consecutive bullish candlesticks with higher closes each time.
Significance: A strong bullish continuation pattern.
Three Black Crows
Description: Three consecutive bearish candlesticks with lower closes each time.
Significance: A strong bearish continuation pattern.
Rising and Falling Three Methods
Rising Three Methods: A bullish continuation pattern consisting of several small bearish candles followed by a large bullish candle.
Falling Three Methods: The bearish counterpart of the Rising Three Methods.
How to Use Candlestick Patterns in Trading
Recognizing candlestick patterns is only the first step. To use them effectively, traders must combine them with other technical indicators and strategies. Here are some practical tips for incorporating candlestick patterns into your trading plan:
Combine with Support and Resistance Levels Candlestick patterns are more reliable when they appear near significant support or resistance levels. For instance, a bullish engulfing pattern at a strong support level is a more reliable buy signal.
Use Multiple Time Frames Analyzing candlestick patterns across multiple time frames can provide a clearer picture of market trends. A pattern that appears on a daily chart is generally more significant than one on a five-minute chart.
Confirm with Technical Indicators Indicators such as the Relative Strength Index (RSI), Moving Averages, and Bollinger Bands can help confirm the signals provided by candlestick patterns.
Practice Risk Management No pattern guarantees success. Always use stop-loss orders and maintain a disciplined approach to risk management.
Monitor Market Context Always consider the broader market context. A candlestick pattern that appears during a news event or high-volatility period may behave differently than one in a stable market.
Common Mistakes to Avoid
While candlestick patterns can be powerful, they are not foolproof. Here are some common mistakes traders should avoid:
Over-reliance on a single pattern: Always seek confirmation from other indicators or patterns.
Ignoring the trend: Patterns are more reliable when traded in the direction of the prevailing trend.
Forgetting risk management: Even the most reliable patterns can fail, so proper risk management is essential.
Failing to practice: New traders should practice identifying and interpreting candlestick patterns using demo accounts before trading with real money.
Conclusion
Candlestick patterns are a valuable tool for traders seeking to anticipate market movements and improve their decision-making. At Shenzhou Capital, we believe that understanding the various patterns and how to use them effectively can give traders a significant edge in the markets. However, it’s essential to remember that no pattern is foolproof, and combining candlestick analysis with other technical tools and strategies is key to long-term success.
Whether you’re a beginner or an experienced trader, mastering candlestick patterns can enhance your trading journey and help you navigate the complexities of financial markets with greater confidence.
#CandlestickPatterns#TradingStrategies#TechnicalAnalysis#ForexTrading#StockMarket#CryptoTrading#MarketTrends#BullishPatterns#BearishPatterns#TradingTips
1 note
·
View note
Text
1 note
·
View note
Text
How to Read and Interpret Candlestick Charts in Trading

Mastering the Art of Analyzing Candlestick Charts for Effective Trading By Amir Shayan Candlestick charts are one of the most popular and widely used tools in technical analysis. They provide valuable insights into price action, market sentiment, and potential trading opportunities. If you're new to trading or want to enhance your chart analysis skills, learning how to read and interpret candlestick charts is essential. In this article, we will guide you through the process of understanding candlestick charts and using them effectively in your trading strategy.
What are Candlestick Charts?
Candlestick charts originated in Japan in the 18th century and have become a staple in technical analysis. They visually represent price movements over a specific time period, displaying the opening, closing, and high, and low prices of an asset. Each candlestick consists of a rectangular body and two wicks, also known as shadows or tails. The body of the candlestick represents the price range between the opening and closing prices. If the closing price exceeds the opening price, the body is typically filled or colored green, indicating a bullish or positive candle. Conversely, if the closing price is lower than the opening price, the body is typically hollow or colored red, indicating a bearish or negative candle. The wicks represent the price extremes reached during the time period. The upper wick extends from the top of the body and represents the highest price reached, while the lower wick extends from the bottom of the body and represents the lowest price reached.
Reading Candlestick Patterns
Candlestick patterns consist of one or more candlesticks arranged in specific formations. These patterns provide traders with valuable information about market sentiment and potential trend reversals. Here are some common candlestick patterns and their interpretations: - Bullish Engulfing Pattern: This pattern occurs when a small bearish candle is followed by a larger bullish candle that completely engulfs the previous candle. It indicates a potential reversal from a bearish to a bullish trend. - Bearish Engulfing Pattern: The opposite of the bullish engulfing pattern occurs when a small bullish candle is followed by a larger bearish candle that engulfs the previous candle. It suggests a potential reversal from a bullish to a bearish trend. - Hammer: A hammer candlestick has a small body and a long lower wick, resembling a hammer. It indicates a potential reversal from a downtrend to an uptrend and is considered a bullish signal. - Shooting Star: The shooting star candlestick has a small body and a long upper wick, resembling a shooting star. It suggests a potential reversal from an uptrend to a downtrend and is considered a bearish signal. - Doji: A doji candlestick has a small body and occurs when the opening and closing prices are virtually the same. It indicates indecision in the market and suggests a potential trend reversal.
Interpreting Candlestick Chart Patterns
While individual candlestick patterns can provide valuable insights, it is important to consider them within the context of the overall chart and other technical indicators. Here are some tips for interpreting candlestick chart patterns: - Trend Confirmation: Candlestick patterns can help confirm the continuation or reversal of an existing trend. For example, a series of bullish candlestick patterns in an uptrend may indicate the continuation of the upward movement. - Support and Resistance Levels: Candlestick patterns can provide clues about support and resistance levels. For instance, a bullish reversal pattern forming near a strong support level may suggest a potential bounce in prices. - Volume Analysis: Combining candlestick patterns with volume analysis can provide additional confirmation. Higher volume during a bullish pattern or lower volume during a bearish pattern can strengthen the validity of the signal. - Timeframe Consideration: Different candlestick patterns may have varying degrees of significance depending on the timeframe you're analyzing. A pattern that is significant on a daily chart may have less relevance on a shorter intraday chart. Candlestick patterns are best used in conjunction with other technical analysis tools and indicators to form a comprehensive trading strategy. Here are some additional factors to consider when interpreting candlestick charts: - Chart Patterns: Look for the formation of chart patterns alongside candlestick patterns. For example, a bullish candlestick pattern occurring within a bullish continuation pattern, such as a flag or a triangle, can strengthen the bullish bias. - Confluence of Signals: Seek confluence between candlestick patterns, support/resistance levels, trendlines, and other technical indicators. When multiple signals align, it increases the probability of a successful trade. - Market Conditions: Consider the broader market conditions and fundamental factors that may influence price movements. Candlestick patterns are more reliable when they align with the overall market trend and relevant news events. - Risk Management: Always implement proper risk management techniques, such as setting stop-loss orders and calculating risk-reward ratios. Candlestick patterns provide insights into potential market reversals, but risk management is crucial to protect your capital. - Practice and Observation: As with any trading skill, practice is essential. Familiarize yourself with different candlestick patterns and observe how they perform in real-market scenarios. Keep a trading journal to track the effectiveness of different patterns and refine your trading strategy over time.
Conclusion
Mastering the art of reading and interpreting candlestick charts can significantly enhance your trading decisions. Candlestick patterns offer valuable insights into market sentiment, trend reversals, and potential trading opportunities. However, it is important to remember that candlestick analysis should not be used in isolation but as part of a comprehensive trading strategy that incorporates other technical analysis tools and fundamental analysis. By combining candlestick patterns with other indicators and considering the broader market context, you can improve your trading accuracy and make informed decisions in the dynamic world of trading. Remember to practice and gain experience in applying candlestick patterns to different market scenarios. With time, patience, and diligent analysis, you can harness the power of candlestick charts to become a more proficient and successful trader. Read the full article
#bearishpatterns#bullishpatterns#candlestickcharts#chartanalysis#marketsentiment#priceaction#Technicalanalysis#tradingstrategy#Tradingtools#trendreversal
0 notes
Photo

EUR/JPY Technical Analysis ** This counter currently is in a rising wedge formation. ** It breaks the pattern & moves in a negative direction. ** Hence, it will be bearish from here. Get the free analysis now: Android: https://play.google.com/store/apps/details?id=com.traderpulse.analysis IOS: https://apps.apple.com/app/forex-analysis/id1358603638 Web: https://analysis.traderpulse.com
#risingwedge#wedgepattern#trendline#chartpattern#pricemove#bearishpattern#forexanalysis#EURJPY#traderpulse
0 notes
Photo

What is a Shooting Star candlestick pattern and how does it work? https://www.tradingwithrayner.com/shooting-star-candlestick-pattern/
#Shootingstar#forexeducation#candlestick#uptrend#bearishpattern#Movingaverage#stoploss#tradingformula#tradersir
0 notes
Link
0 notes
Photo

Recapping: Bullish Tweezers Candlestick Pattern. #candlestick
0 notes
Photo

🔥follow us for more updates 🔥 . . ⬛️ Hit Trader 🟥 www.Hit-trader.com . . #lowdrawdown #businessonline #bitcoin #scalpingtrader #digitalmarketing #crypto_currency #dollar #e_commerce #marketing #hittrader #nftmarket #investing #binance #cryptowallet #daytraders #cryptoholders #tradingmindset #candlesticks #HiTtrader #bullishpattern #cryptocurrencytrading #passiveincome #mindsets #onlinebusiness #bearishpattern #richlifestyles #trademarketing #onlineincome https://www.instagram.com/p/CjU4eyDMM3J/?igshid=NGJjMDIxMWI=
#lowdrawdown#businessonline#bitcoin#scalpingtrader#digitalmarketing#crypto_currency#dollar#e_commerce#marketing#hittrader#nftmarket#investing#binance#cryptowallet#daytraders#cryptoholders#tradingmindset#candlesticks#bullishpattern#cryptocurrencytrading#passiveincome#mindsets#onlinebusiness#bearishpattern#richlifestyles#trademarketing#onlineincome
0 notes
Text
How to Read and Interpret Candlestick Charts in Trading
Mastering the Art of Analyzing Candlestick Charts for Effective Trading By Amir Shayan Candlestick charts are one of the most popular and widely used tools in technical analysis. They provide valuable insights into price action, market sentiment, and potential trading opportunities. If you're new to trading or want to enhance your chart analysis skills, learning how to read and interpret candlestick charts is essential. In this article, we will guide you through the process of understanding candlestick charts and using them effectively in your trading strategy.
What are Candlestick Charts?
Candlestick charts originated in Japan in the 18th century and have become a staple in technical analysis. They visually represent price movements over a specific time period, displaying the opening, closing, and high, and low prices of an asset. Each candlestick consists of a rectangular body and two wicks, also known as shadows or tails. The body of the candlestick represents the price range between the opening and closing prices. If the closing price exceeds the opening price, the body is typically filled or colored green, indicating a bullish or positive candle. Conversely, if the closing price is lower than the opening price, the body is typically hollow or colored red, indicating a bearish or negative candle. The wicks represent the price extremes reached during the time period. The upper wick extends from the top of the body and represents the highest price reached, while the lower wick extends from the bottom of the body and represents the lowest price reached.
Reading Candlestick Patterns
Candlestick patterns consist of one or more candlesticks arranged in specific formations. These patterns provide traders with valuable information about market sentiment and potential trend reversals. Here are some common candlestick patterns and their interpretations: - Bullish Engulfing Pattern: This pattern occurs when a small bearish candle is followed by a larger bullish candle that completely engulfs the previous candle. It indicates a potential reversal from a bearish to a bullish trend. - Bearish Engulfing Pattern: The opposite of the bullish engulfing pattern occurs when a small bullish candle is followed by a larger bearish candle that engulfs the previous candle. It suggests a potential reversal from a bullish to a bearish trend. - Hammer: A hammer candlestick has a small body and a long lower wick, resembling a hammer. It indicates a potential reversal from a downtrend to an uptrend and is considered a bullish signal. - Shooting Star: The shooting star candlestick has a small body and a long upper wick, resembling a shooting star. It suggests a potential reversal from an uptrend to a downtrend and is considered a bearish signal. - Doji: A doji candlestick has a small body and occurs when the opening and closing prices are virtually the same. It indicates indecision in the market and suggests a potential trend reversal.
Interpreting Candlestick Chart Patterns
While individual candlestick patterns can provide valuable insights, it is important to consider them within the context of the overall chart and other technical indicators. Here are some tips for interpreting candlestick chart patterns: - Trend Confirmation: Candlestick patterns can help confirm the continuation or reversal of an existing trend. For example, a series of bullish candlestick patterns in an uptrend may indicate the continuation of the upward movement. - Support and Resistance Levels: Candlestick patterns can provide clues about support and resistance levels. For instance, a bullish reversal pattern forming near a strong support level may suggest a potential bounce in prices. - Volume Analysis: Combining candlestick patterns with volume analysis can provide additional confirmation. Higher volume during a bullish pattern or lower volume during a bearish pattern can strengthen the validity of the signal. - Timeframe Consideration: Different candlestick patterns may have varying degrees of significance depending on the timeframe you're analyzing. A pattern that is significant on a daily chart may have less relevance on a shorter intraday chart. Candlestick patterns are best used in conjunction with other technical analysis tools and indicators to form a comprehensive trading strategy. Here are some additional factors to consider when interpreting candlestick charts: - Chart Patterns: Look for the formation of chart patterns alongside candlestick patterns. For example, a bullish candlestick pattern occurring within a bullish continuation pattern, such as a flag or a triangle, can strengthen the bullish bias. - Confluence of Signals: Seek confluence between candlestick patterns, support/resistance levels, trendlines, and other technical indicators. When multiple signals align, it increases the probability of a successful trade. - Market Conditions: Consider the broader market conditions and fundamental factors that may influence price movements. Candlestick patterns are more reliable when they align with the overall market trend and relevant news events. - Risk Management: Always implement proper risk management techniques, such as setting stop-loss orders and calculating risk-reward ratios. Candlestick patterns provide insights into potential market reversals, but risk management is crucial to protect your capital. - Practice and Observation: As with any trading skill, practice is essential. Familiarize yourself with different candlestick patterns and observe how they perform in real-market scenarios. Keep a trading journal to track the effectiveness of different patterns and refine your trading strategy over time.
Conclusion
Mastering the art of reading and interpreting candlestick charts can significantly enhance your trading decisions. Candlestick patterns offer valuable insights into market sentiment, trend reversals, and potential trading opportunities. However, it is important to remember that candlestick analysis should not be used in isolation but as part of a comprehensive trading strategy that incorporates other technical analysis tools and fundamental analysis. By combining candlestick patterns with other indicators and considering the broader market context, you can improve your trading accuracy and make informed decisions in the dynamic world of trading. Remember to practice and gain experience in applying candlestick patterns to different market scenarios. With time, patience, and diligent analysis, you can harness the power of candlestick charts to become a more proficient and successful trader. Read the full article
#bearishpatterns#bullishpatterns#candlestickcharts#chartanalysis#marketsentiment#priceaction#Technicalanalysis#tradingstrategy#Tradingtools#trendreversal
0 notes
Photo

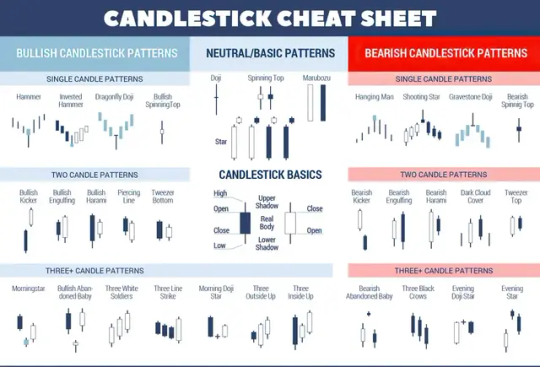
Bullish Pattern Bearish Pattern Bullish reversal patterns Bearish reversal patterns For full image visit our Telegram channel @SandhuValueInvesting https://t.me/SandhuValueInvesting https://sandhuvalueinvesting.wordpress.com/ #bullishpattern #bearishpattern #bullishreversalpattern #bearishreversalpattern #SandhuValueInvesting #technicalanalysis https://www.instagram.com/p/CXYuEEdvnc0/?utm_medium=tumblr
#bullishpattern#bearishpattern#bullishreversalpattern#bearishreversalpattern#sandhuvalueinvesting#technicalanalysis
0 notes
Photo

Recapping: Piercing Line Candlestick Pattern.
0 notes
Photo

Recapping: Bullish Harami Candlestick Pattern.
0 notes
Photo

Recapping: Bullish Harami Candlestick Pattern.
0 notes
Photo

Recapping: Inverted Hummer Candlestick Pattern.
0 notes
Photo

Recapping: Bullish Engulfing Candlestick Pattern
0 notes
Photo

😈 Do you want to get rich quickly? 😈 . . 🤌Hit Trader 👉www.Hit-trader.com . . #lowdrawdown #businessonline #bitcoin #scalpingtrader #digitalmarketing #crypto_currency #dollar #e_commerce #marketing #hittrader #nftmarket #investing #binance #cryptowallet #daytraders #cryptoholders #tradingmindset #candlesticks #Hittrader #bullishpattern #cryptocurrencytrading #passiveincome #mindsets #onlinebusiness #bearishpattern #richlifestyles #trademarketing #onlineincome https://www.instagram.com/p/CjSGxD_MNrd/?igshid=NGJjMDIxMWI=
#lowdrawdown#businessonline#bitcoin#scalpingtrader#digitalmarketing#crypto_currency#dollar#e_commerce#marketing#hittrader#nftmarket#investing#binance#cryptowallet#daytraders#cryptoholders#tradingmindset#candlesticks#bullishpattern#cryptocurrencytrading#passiveincome#mindsets#onlinebusiness#bearishpattern#richlifestyles#trademarketing#onlineincome
0 notes