#candlestickcharts
Text
Expert Tips for Using Trendlines with Candlestick Patterns
Trendlines pattern in candlestick charts helps visualize market direction. When prices follow a consistent trend, trendlines mark support and resistance levels, guiding traders to potential entry and exit points. They highlight the strength and direction of price movements.
0 notes
Text
How to Read and Interpret Candlestick Charts
Unveiling the Secrets of Candlestick Chart Interpretation
By Amir Shayan
Candlestick charts are a fundamental tool in the world of financial trading. They provide crucial insights into the price movements of various assets, helping traders make informed decisions. Understanding how to read and interpret candlestick charts is a skill that can greatly enhance your trading acumen. In this article, we will delve into the intricacies of candlestick charts, unraveling their significance and guiding you through the process of deciphering their patterns.
The Language of Candlestick Charts
Candlestick charts originated in Japan centuries ago and have since become a cornerstone of technical analysis. Each candlestick represents a specific time frame, whether it's a minute, an hour, a day, or longer. The chart consists of individual candles, and the patterns they form can reveal potential trends, reversals, and price movements.
Anatomy of a Candlestick
A single candlestick consists of several key components: the body, the wick (or shadow), and sometimes the tail. The body represents the difference between the opening and closing prices during the given time frame. If the closing price is higher than the opening price, the body is typically colored or filled. Conversely, if the opening price is higher than the closing price, the body is usually empty or transparent.
The wick or shadow extends above and below the body, indicating the range between the highest and lowest prices during the time period. The tail, if present, extends from the body's top or bottom, signifying the range beyond the wick.
Common Candlestick Patterns
Doji: A Doji occurs when the opening and closing prices are very close or even identical. It suggests uncertainty in the market and a potential reversal.
Hammer and Hanging Man: These patterns have small bodies and a long lower tail. A Hammer appears after a downtrend and implies a potential bullish reversal, while a Hanging Man after an uptrend can indicate a bearish reversal.
Bullish and Bearish Engulfing: A Bullish Engulfing pattern occurs when a small bearish candle is followed by a larger bullish one. The reverse is the Bearish Engulfing pattern. These suggest a reversal of the current trend.
Morning Star and Evening Star: The Morning Star is a three-candle pattern featuring a large bearish candle, a small bearish or bullish one, and a large bullish one. It indicates a potential reversal from a downtrend. The Evening Star is the opposite, signaling a potential reversal from an uptrend.
Interpreting Candlestick Patterns
Candlestick patterns provide valuable information about market sentiment and potential price movements. For instance, a series of bullish candlesticks indicates a strong uptrend, while a succession of bearish ones suggests a downtrend. Reversal patterns, as the name suggests, may indicate an impending change in the current trend.
It's important to note that while candlestick patterns can offer insights into market movements, they should be considered alongside other technical and fundamental analysis tools for a comprehensive understanding.
Conclusion
Candlestick charts are a visual representation of market dynamics, revealing the battle between buyers and sellers. By understanding the patterns they form, traders can gain a deeper understanding of market sentiment and potential price movements. However, like any tool, candlestick charts are most effective when used in conjunction with other forms of analysis.
Learning to read and interpret candlestick charts takes time and practice, but it's a skill that can greatly improve your trading decisions. As you become more proficient in deciphering these patterns, you'll be better equipped to navigate the complexities of financial markets and make informed choices that align with your trading strategy.
Read the full article
#candlestickcharts#candlestickpatterns#Chartinterpretation#financialmarkets#marketanalysis#marketsentiment#PriceMovements#Technicalanalysis#Tradingpatterns#tradingstrategy
0 notes
Text
Candle Chart - Unveiling India's Stock Market | What Is Candlestick Chart? 🤔 | Complete Candlestick
youtube
#stockmarket#CandlestickChart#InvestingIndia#FinancialEducation#StockAnalysis#TradingStrategies#MarketTrends#StockMarketExplained#LearnWithUs#InvestmentTips#CandlestickPatterns#MarketAnalysis#Youtube
0 notes
Link
#BankNifty#BankNiftyAnalysis#Candlestickchart#flagpattern#IntradayTradeSetup#NationalStockExchange#Nifty50#Nifty50analysis#optionchain#optionchainanalysis#optionchaindata#priceactionconfirmation#technicalanalysis#tradingstrategy
0 notes
Text
Heikin-Ashi Trading Strategy: A Game-Changer for trader
Discover the Heikin-Ashi Trading Strategy, a unique approach to Forex trading that combines candlestick charts and momentum indicators. Learn how this powerful strategy can help you identify trend reversals and improve your trading performance.

The Heikin-Ashi charting technique is a unique and popular tool used by traders in the financial markets, particularly in the forex market. It provides a different perspective compared to traditional candlestick charts and offers valuable insights into price trends and reversals. This article will delve into the intricacies of the Heikin-Ashi Trading Strategy, exploring its calculation method, advantages, and how to effectively trade with it.
Understanding Heikin-Ashi Charts:
Heikin-Ashi charts resemble candlestick charts in appearance, but their construction and plotting differ significantly. Candlestick charts display the Open, Close, High, and Low prices for each period, whereas Heikin-Ashi charts utilize calculations based on the previous candle to plot the current one. This unique approach contributes to the smoothness of the Heikin-Ashi candles and provides a different perspective on market trends.
Here is how the four components of a Heikin-Ashi candle are calculated:
It is important to note that Heikin-Ashi candles are interdependent as the close and open prices of each candle are calculated using the previous candle's close and open prices. Moreover, the high and low prices are influenced by the preceding candle. This interrelation between candles contributes to the smoothing effect and delayed signals of Heikin-Ashi charts.
Advantages of Heikin-Ashi Trading:
Trading with Heikin-Ashi:
The Heikin-Ashi Trading Strategy combines the power of Heikin-Ashi reversal patterns with popular momentum indicators to enhance trading decisions. Here is a step-by-step guide on how to trade with Heikin-Ashi:
The Heikin-Ashi Trading Strategy is a powerful approach for traders in the forex market. By incorporating Heikin-Ashi charts and combining them with momentum indicators like the Stochastic Oscillator, traders can improve the accuracy of their trading decisions. The strategy's advantages, including smoothed price action, delayed signals, and clear trend identification, have contributed to its popularity among forex traders. However, it is essential to practice proper risk management and thoroughly backtest the strategy before applying it to live trading.
Please note that the answers provided above are for informational purposes only and should not be considered as financial advice. Trading in financial markets carries risks, and individuals should conduct thorough research and seek professional guidance before making any trading decisions.
#ForexTrading #TradingStrategy #HeikinAshi #CandlestickCharts #MomentumFilters #TrendReversals #TechnicalAnalysis
0 notes
Link
A forex chart shows a graphical illustration of the exchange rate between two currencies. You can see both the real-time data and the past history.
Read the article to know more.
https://tradersir.com/types-of-forex-charts/
#forex#fxtrading#technicalanalysis#forexcharts#linecharts#barcharts#candlestickcharts#bearish#bullish#tradingeducation#tradersir
0 notes
Link
0 notes
Text
How to Read and Interpret Candlestick Charts

Unveiling the Secrets of Candlestick Chart Interpretation
By Amir Shayan
Candlestick charts are a fundamental tool in the world of financial trading. They provide crucial insights into the price movements of various assets, helping traders make informed decisions. Understanding how to read and interpret candlestick charts is a skill that can greatly enhance your trading acumen. In this article, we will delve into the intricacies of candlestick charts, unraveling their significance and guiding you through the process of deciphering their patterns.
The Language of Candlestick Charts
Candlestick charts originated in Japan centuries ago and have since become a cornerstone of technical analysis. Each candlestick represents a specific time frame, whether it's a minute, an hour, a day, or longer. The chart consists of individual candles, and the patterns they form can reveal potential trends, reversals, and price movements.
Anatomy of a Candlestick
A single candlestick consists of several key components: the body, the wick (or shadow), and sometimes the tail. The body represents the difference between the opening and closing prices during the given time frame. If the closing price is higher than the opening price, the body is typically colored or filled. Conversely, if the opening price is higher than the closing price, the body is usually empty or transparent.
The wick or shadow extends above and below the body, indicating the range between the highest and lowest prices during the time period. The tail, if present, extends from the body's top or bottom, signifying the range beyond the wick.
Common Candlestick Patterns
Doji: A Doji occurs when the opening and closing prices are very close or even identical. It suggests uncertainty in the market and a potential reversal.
Hammer and Hanging Man: These patterns have small bodies and a long lower tail. A Hammer appears after a downtrend and implies a potential bullish reversal, while a Hanging Man after an uptrend can indicate a bearish reversal.
Bullish and Bearish Engulfing: A Bullish Engulfing pattern occurs when a small bearish candle is followed by a larger bullish one. The reverse is the Bearish Engulfing pattern. These suggest a reversal of the current trend.
Morning Star and Evening Star: The Morning Star is a three-candle pattern featuring a large bearish candle, a small bearish or bullish one, and a large bullish one. It indicates a potential reversal from a downtrend. The Evening Star is the opposite, signaling a potential reversal from an uptrend.
Interpreting Candlestick Patterns
Candlestick patterns provide valuable information about market sentiment and potential price movements. For instance, a series of bullish candlesticks indicates a strong uptrend, while a succession of bearish ones suggests a downtrend. Reversal patterns, as the name suggests, may indicate an impending change in the current trend.
It's important to note that while candlestick patterns can offer insights into market movements, they should be considered alongside other technical and fundamental analysis tools for a comprehensive understanding.
Conclusion
Candlestick charts are a visual representation of market dynamics, revealing the battle between buyers and sellers. By understanding the patterns they form, traders can gain a deeper understanding of market sentiment and potential price movements. However, like any tool, candlestick charts are most effective when used in conjunction with other forms of analysis.
Learning to read and interpret candlestick charts takes time and practice, but it's a skill that can greatly improve your trading decisions. As you become more proficient in deciphering these patterns, you'll be better equipped to navigate the complexities of financial markets and make informed choices that align with your trading strategy.
Read the full article
#candlestickcharts#candlestickpatterns#Chartinterpretation#financialmarkets#marketanalysis#marketsentiment#PriceMovements#Technicalanalysis#Tradingpatterns#tradingstrategy
0 notes
Text
Candle Chart - Unveiling India's Stock Market | What Is Candlestick Chart? 🤔 | Complete Candlestick
youtube
0 notes
Photo

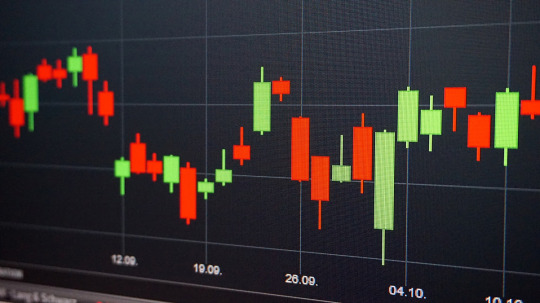
Different types of charts 1. Candlestick chart 2. Heiken ashi chart 3. Bar chart 4. Line chart 5. Renko chart Candlestick charts are one of the most commonly used chart bu stock traders. Candlesticks are useful when trading as they show four price points (open, close, high, and low) throughout the period of time the trader specifies. A line chart is a graphical representation of an asset's historical price action that connects a series of data points with a continuous line. This is the most basic type of chart used in finance and typically only depicts a security's closing prices over time. Heikin-Ashi, also means "average bar" in Japanese. The Heikin-Ashi technique can be used in conjunction with candlestick charts when trading securities to spot market trends and predict future prices. It's useful for making candlestick charts more readable and trends easier to analyze. A Renko chart is a type of chart, developed by the Japanese, that is built using price movement rather than both price and standardized time intervals like most charts are. #sharemarketmalayalam #technicalanalysis📊📈📉 #technicalanalysis #technicalanalysisdaily #cabdlestickchart #barchart #heikenashi #heikenashicandles #heikenashibars #heikenashicandlestrategy #heikenashistrategy #linechart #linecharts #renkochart #renkocharts #renkochartpatterns #renkochartexplanation #candlestickcharts #candlestickcharting #candlestickchartpatterns #typesofcharts #stocktrader #stockchart #intradaytrading #intradaytrader (at Teqmo Charts - Share Market Malayalam) https://www.instagram.com/p/CLvlAU2nqQv/?igshid=udkjujn2u2gj
#sharemarketmalayalam#technicalanalysis📊📈📉#technicalanalysis#technicalanalysisdaily#cabdlestickchart#barchart#heikenashi#heikenashicandles#heikenashibars#heikenashicandlestrategy#heikenashistrategy#linechart#linecharts#renkochart#renkocharts#renkochartpatterns#renkochartexplanation#candlestickcharts#candlestickcharting#candlestickchartpatterns#typesofcharts#stocktrader#stockchart#intradaytrading#intradaytrader
0 notes
Link
#BankNifty#Candlestickchart#NationalStockExchange#NationalStockExchangeofIndia#Nifty#Nifty50#Nifty50analysis#NiftyBank#optionchainanalysis#pivotpoint#stockmarket#StockTrading#Supportandresistancelevels#technicalanalysis#tradingstrategies#weeklyanalysis#WeeklyAnalysisofBankNiftyandNifty50
0 notes
Text
How Traders Succeed In Trading Stocks - Options Pop

Options Pop is a constructive step by step program that guides users on how to stock trade appropriately. Now, how does this occur? The guide provides you simple options trade alerts as well as training that help users get the best results possible. It will help you receive simple options alerts that give a higher probability of moving up in prices in a few days.
https://youtu.be/_Jb28hL2ijw
Why Investors Buy Options?
In the stock and option's market, the biggest profits come from owning Call or Put options. The reason is because buying options have high risk and high reward.
Call Option buyers make the most money when the stock rises in price.Put Option buyers make the most money when the stock drops in price.OptionsPop.com uses just one simple strategy: Buy Call or Put Options on certain stocks and sell them within 2 to 9 days!
What You Get In Options Pop Member Area
Instant and unlimited to the member’s area.Great ad profitable alerts.You will also get three options pop email buy alerts each and every week.There is also an inclusion of new options training updates.The program will help you to identify put or call options that are about to move up or down.You will discover that there is no complicated trading instructions or market analysis.This program will help you to discover the best ways through which you can generate income at the same time the right time to generate better profits.
Read the full article
#adamthomas#beginnerdaytradingstrategies#beginnertradingstrategies#bullputspread#callandputoption#calloption#calloptionandputoption#callorputoptions#callput#callputoption#candlestickcharts#daytrade#daytrader#daytrading#daytradingcourses#daytradingstrategiesforbeginners#Forextrading#Howto#howtobuystocks#howtodaytrade#howtomakemoneytrading#HowToSucceedinTradingOptions#howtotrade#howtotradepennystocks#ironcondor#livetrade#longstraddle#momentumdaytradingstrategies#momentumtrading#optionspopreviews2020
0 notes
Photo

#XRP #Ripple #altcoins #digitalmarketing #digitalcurrency #candlestickcharts #bulls #bears #stock #cryptocurrency #cryptocurrencies #legit #makemoney #workyourmoney #worldwid3mark3ting #godovermoney
#altcoins#digitalmarketing#godovermoney#bears#cryptocurrency#bulls#makemoney#worldwid3mark3ting#legit#ripple#cryptocurrencies#digitalcurrency#stock#xrp#workyourmoney#candlestickcharts
1 note
·
View note
Link
A forex chart shows a graphical illustration of the exchange rate between two currencies. You can see both the real-time data and the past history.
Read the article to know more.
https://tradersir.com/types-of-forex-charts/
#forex#fxtrading#technicalanalysis#forexcharts#linecharts#barcharts#candlestickcharts#bearish#bullish#tradingeducation#tradersir
0 notes
Photo

#rsidivergence #tweezersbottom #candlestickcharts #candlestickreading #educationalcontent #education #eurusd #forextrading #forex On the picture you can see a tweezers bottom followed by a #bullishengulfing at the #supportarea So you see 3 buy signals on the chart. https://www.instagram.com/p/BtGNtUAg-Ja/?utm_source=ig_tumblr_share&igshid=qlgoecage5bn
#rsidivergence#tweezersbottom#candlestickcharts#candlestickreading#educationalcontent#education#eurusd#forextrading#forex#bullishengulfing#supportarea
0 notes
Text
How to Read and Interpret Candlestick Charts in Trading
Mastering the Art of Analyzing Candlestick Charts for Effective Trading
By Amir Shayan
Candlestick charts are one of the most popular and widely used tools in technical analysis. They provide valuable insights into price action, market sentiment, and potential trading opportunities. If you're new to trading or want to enhance your chart analysis skills, learning how to read and interpret candlestick charts is essential. In this article, we will guide you through the process of understanding candlestick charts and using them effectively in your trading strategy.
What are Candlestick Charts?
Candlestick charts originated in Japan in the 18th century and have become a staple in technical analysis. They visually represent price movements over a specific time period, displaying the opening, closing, and high, and low prices of an asset. Each candlestick consists of a rectangular body and two wicks, also known as shadows or tails.
The body of the candlestick represents the price range between the opening and closing prices. If the closing price exceeds the opening price, the body is typically filled or colored green, indicating a bullish or positive candle. Conversely, if the closing price is lower than the opening price, the body is typically hollow or colored red, indicating a bearish or negative candle.
The wicks represent the price extremes reached during the time period. The upper wick extends from the top of the body and represents the highest price reached, while the lower wick extends from the bottom of the body and represents the lowest price reached.
Reading Candlestick Patterns
Candlestick patterns consist of one or more candlesticks arranged in specific formations. These patterns provide traders with valuable information about market sentiment and potential trend reversals. Here are some common candlestick patterns and their interpretations:
- Bullish Engulfing Pattern: This pattern occurs when a small bearish candle is followed by a larger bullish candle that completely engulfs the previous candle. It indicates a potential reversal from a bearish to a bullish trend.
- Bearish Engulfing Pattern: The opposite of the bullish engulfing pattern occurs when a small bullish candle is followed by a larger bearish candle that engulfs the previous candle. It suggests a potential reversal from a bullish to a bearish trend.
- Hammer: A hammer candlestick has a small body and a long lower wick, resembling a hammer. It indicates a potential reversal from a downtrend to an uptrend and is considered a bullish signal.
- Shooting Star: The shooting star candlestick has a small body and a long upper wick, resembling a shooting star. It suggests a potential reversal from an uptrend to a downtrend and is considered a bearish signal.
- Doji: A doji candlestick has a small body and occurs when the opening and closing prices are virtually the same. It indicates indecision in the market and suggests a potential trend reversal.
Interpreting Candlestick Chart Patterns
While individual candlestick patterns can provide valuable insights, it is important to consider them within the context of the overall chart and other technical indicators. Here are some tips for interpreting candlestick chart patterns:
- Trend Confirmation: Candlestick patterns can help confirm the continuation or reversal of an existing trend. For example, a series of bullish candlestick patterns in an uptrend may indicate the continuation of the upward movement.
- Support and Resistance Levels: Candlestick patterns can provide clues about support and resistance levels. For instance, a bullish reversal pattern forming near a strong support level may suggest a potential bounce in prices.
- Volume Analysis: Combining candlestick patterns with volume analysis can provide additional confirmation. Higher volume during a bullish pattern or lower volume during a bearish pattern can strengthen the validity of the signal.
- Timeframe Consideration: Different candlestick patterns may have varying degrees of significance depending on the timeframe you're analyzing. A pattern that is significant on a daily chart may have less relevance on a shorter intraday chart.
Candlestick patterns are best used in conjunction with other technical analysis tools and indicators to form a comprehensive trading strategy. Here are some additional factors to consider when interpreting candlestick charts:
- Chart Patterns: Look for the formation of chart patterns alongside candlestick patterns. For example, a bullish candlestick pattern occurring within a bullish continuation pattern, such as a flag or a triangle, can strengthen the bullish bias.
- Confluence of Signals: Seek confluence between candlestick patterns, support/resistance levels, trendlines, and other technical indicators. When multiple signals align, it increases the probability of a successful trade.
- Market Conditions: Consider the broader market conditions and fundamental factors that may influence price movements. Candlestick patterns are more reliable when they align with the overall market trend and relevant news events.
- Risk Management: Always implement proper risk management techniques, such as setting stop-loss orders and calculating risk-reward ratios. Candlestick patterns provide insights into potential market reversals, but risk management is crucial to protect your capital.
- Practice and Observation: As with any trading skill, practice is essential. Familiarize yourself with different candlestick patterns and observe how they perform in real-market scenarios. Keep a trading journal to track the effectiveness of different patterns and refine your trading strategy over time.
Conclusion
Mastering the art of reading and interpreting candlestick charts can significantly enhance your trading decisions. Candlestick patterns offer valuable insights into market sentiment, trend reversals, and potential trading opportunities. However, it is important to remember that candlestick analysis should not be used in isolation but as part of a comprehensive trading strategy that incorporates other technical analysis tools and fundamental analysis. By combining candlestick patterns with other indicators and considering the broader market context, you can improve your trading accuracy and make informed decisions in the dynamic world of trading.
Remember to practice and gain experience in applying candlestick patterns to different market scenarios. With time, patience, and diligent analysis, you can harness the power of candlestick charts to become a more proficient and successful trader.
Read the full article
#bearishpatterns#bullishpatterns#candlestickcharts#chartanalysis#marketsentiment#priceaction#Technicalanalysis#tradingstrategy#Tradingtools#trendreversal
0 notes
Last Seen Blogs

kiraruby
KiraRuby

momojan22
MomoJan Design

wanderer-on-the-steppe
Wanderer on the Steppe

kingliamsbitch
don't test me

babarobbie
Little Robby